| Param | Original file | Final file |
|---|---|---|
| Filename | modeM0/AS1A10_053T31_9000004540cztM0_level2.fits | modeM0/AS1A10_053T31_9000004540cztM0_level2_quad_clean.evt |
| Size (bytes) | 123,946,560 | 64,137,600 |
| Size | 118.2 MB | 61.2 MB |
| Events in quadrant A | 792,844 | 297,458 |
| Events in quadrant B | 728,832 | 290,230 |
| Events in quadrant C | 741,874 | 268,108 |
| Events in quadrant D | 662,710 | 257,769 |
| Mode M9 | |||
|---|---|---|---|
| Quadrant | BADHDUFLAG | Total packets | Discarded packets |
| A | 0 | 21 | 0 |
| B | 0 | 21 | 0 |
| C | 0 | 21 | 0 |
| D | 0 | 21 | 0 |
| Mode SS | |||
|---|---|---|---|
| Quadrant | BADHDUFLAG | Total packets | Discarded packets |
| A | 0 | 242 | 0 |
| B | 0 | 242 | 0 |
| C | 0 | 242 | 0 |
| D | 0 | 242 | 0 |
| Mode M0 | |||
|---|---|---|---|
| Quadrant | BADHDUFLAG | Total packets | Discarded packets |
| A | 0 | 24866 | 0 |
| B | 0 | 37102 | 0 |
| C | 0 | 29115 | 0 |
| D | 0 | 34283 | 0 |
| Quadrant | Total seconds | Saturated seconds | Saturation percentage |
|---|---|---|---|
| A | 11967 | 213 | 1.779895% |
| B | 11967 | 387 | 3.233893% |
| C | 11967 | 599 | 5.005432% |
| D | 11967 | 752 | 6.283948% |
Noise dominated data is calculated using 1-second bins in cleaned event files. If a bin has >2000 counts, and if more than 50% of those come from <1% of pixels, then it is considered to be noise-dominated and hence unusable.
| Quadrant | # 1 sec bins | Bins with >0 counts | Bins with >2000 counts | High rate bins dominated by noise | Noise dominated (total time) | Noise dominated (detector-on time) | Marked lightcurve |
|---|---|---|---|---|---|---|---|
| A | 14002 | 11967 | 0 | 0 | 0.00% | 0.00% |  |
| B | 14002 | 11966 | 0 | 0 | 0.00% | 0.00% |  |
| C | 14002 | 11957 | 0 | 0 | 0.00% | 0.00% |  |
| D | 14002 | 11961 | 0 | 0 | 0.00% | 0.00% | 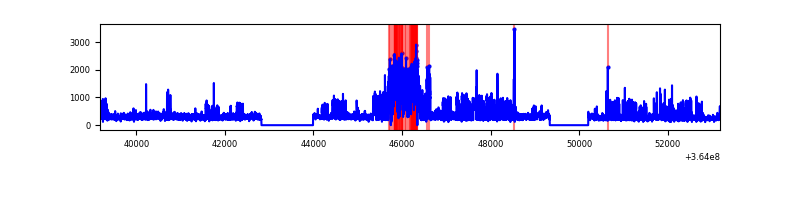 |
Top three noisy pixels from each quadrant. If the there are fewer than three noisy pixels in the level2.evt file, extra rows are filled as -1
| Pixel properties | Quadrant properties | ||||||
|---|---|---|---|---|---|---|---|
| Quadrant | DetID | PixID | Counts | Sigma | Mean | Median | Sigma |
| A | 0 | 29 | 658 | 8.88 | 206 | 194 | 52.2 |
| A | 14 | 95 | 604 | 7.85 | 206 | 194 | 52.2 |
| A | 7 | 110 | 597 | 7.71 | 206 | 194 | 52.2 |
| B | 2 | 9 | 578 | 9.68 | 193 | 184 | 40.7 |
| B | 3 | 80 | 519 | 8.23 | 193 | 184 | 40.7 |
| B | 5 | 232 | 512 | 8.06 | 193 | 184 | 40.7 |
| C | 1 | 81 | 590 | 7.89 | 196 | 184 | 51.5 |
| C | 1 | 80 | 563 | 7.36 | 196 | 184 | 51.5 |
| C | 3 | 202 | 562 | 7.34 | 196 | 184 | 51.5 |
| D | 3 | 14 | 472 | 5.82 | 189 | 173 | 51.4 |
| D | 7 | 5 | 461 | 5.6 | 189 | 173 | 51.4 |
| D | 6 | 231 | 461 | 5.6 | 189 | 173 | 51.4 |
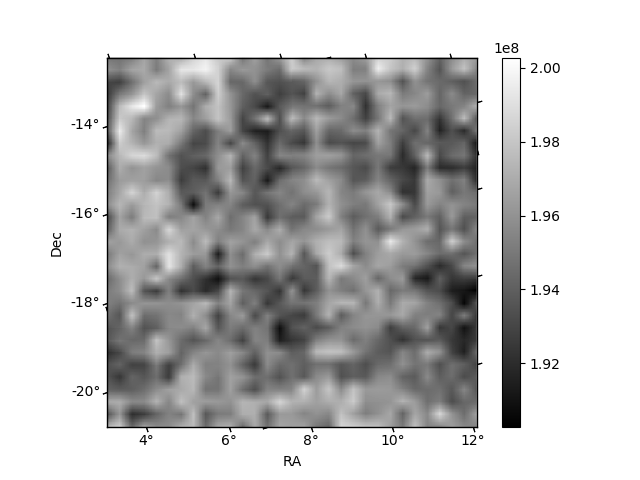
Histogram calculated using DETX and DETY for each event in the final _common_clean file
| Quadrant A |  |
 |
Quadrant B |
|---|---|---|---|
| Quadrant D |  |
 |
Quadrant C |
| Plot type | Count rate plots | Images |
|---|---|---|
| Comparison with Poisson distribution Blue bars denote a histogram of data divided into 1 sec bins. Red curve is a Poisson curve with rate = median count rate of data. |
 |
 |
| Quadrant-wise count rates Data is divided into 100 sec bins |
 |
|
| Module-wise count rates for Quadrant A Data is divided into 100 sec bins |
 |
 |
| Module-wise count rates for Quadrant B Data is divided into 100 sec bins |
 |
 |
| Module-wise count rates for Quadrant C Data is divided into 100 sec bins |
 |
 |
| Module-wise count rates for Quadrant D Data is divided into 100 sec bins |
 |
 |
| Parameter | Plot |
|---|---|
| CZT HV Monitor |  |
| D_VDD |  |
| Temperature 1 |  |
| Veto HV Monitor |  |
| Veto LLD |  |
| Alpha Counter |  |
| _CPM_Rate |  |
| CZT Counter |  |
| +2.5 Volts monitor |  |
| +5 Volts monitor |  |
| _ROLL_ROT |  |
| _Roll_DEC |  |
| _Roll_RA |  |
| Veto Counter |  |