| Param | Original file | Final file |
|---|---|---|
| Filename | modeM0/AS1A10_053T31_9000004540_31340cztM0_level2.evt | modeM0/AS1A10_053T31_9000004540_31340cztM0_level2_quad_clean.evt |
| Size (bytes) | 461,589,120 | 59,054,400 |
| Size | 440.2 MB | 56.3 MB |
| Events in quadrant A | 2,739,103 | 367,455 |
| Events in quadrant B | 4,312,104 | 360,374 |
| Events in quadrant C | 3,286,922 | 344,427 |
| Events in quadrant D | 3,285,235 | 347,810 |
| Mode M9 | |||
|---|---|---|---|
| Quadrant | BADHDUFLAG | Total packets | Discarded packets |
| A | 0 | 12 | 0 |
| B | 0 | 12 | 0 |
| C | 0 | 12 | 0 |
| D | 0 | 12 | 0 |
| Mode SS | |||
|---|---|---|---|
| Quadrant | BADHDUFLAG | Total packets | Discarded packets |
| A | 0 | 106 | 0 |
| B | 0 | 106 | 0 |
| C | 0 | 106 | 0 |
| D | 0 | 106 | 0 |
| Mode M0 | |||
|---|---|---|---|
| Quadrant | BADHDUFLAG | Total packets | Discarded packets |
| A | 0 | 11033 | 1 |
| B | 0 | 16333 | 3 |
| C | 0 | 13061 | 1 |
| D | 0 | 13199 | 1 |
| Quadrant | Total seconds | Saturated seconds | Saturation percentage |
|---|---|---|---|
| A | 5252 | 115 | 2.189642% |
| B | 5251 | 187 | 3.561226% |
| C | 5251 | 299 | 5.694153% |
| D | 5251 | 99 | 1.885355% |
Noise dominated data is calculated using 1-second bins in cleaned event files. If a bin has >2000 counts, and if more than 50% of those come from <1% of pixels, then it is considered to be noise-dominated and hence unusable.
| Quadrant | # 1 sec bins | Bins with >0 counts | Bins with >2000 counts | High rate bins dominated by noise | Noise dominated (total time) | Noise dominated (detector-on time) | Marked lightcurve |
|---|---|---|---|---|---|---|---|
| A | 6417 | 5253 | 0 | 0 | 0.00% | 0.00% | 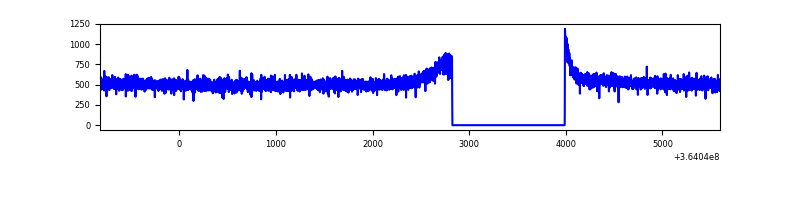 |
| B | 6416 | 5252 | 4 | 4 | 0.06% | 0.08% | 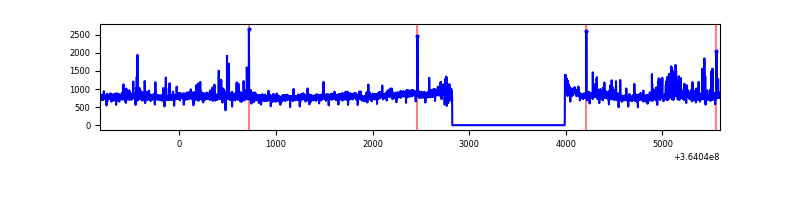 |
| C | 6416 | 5252 | 18 | 18 | 0.28% | 0.34% | 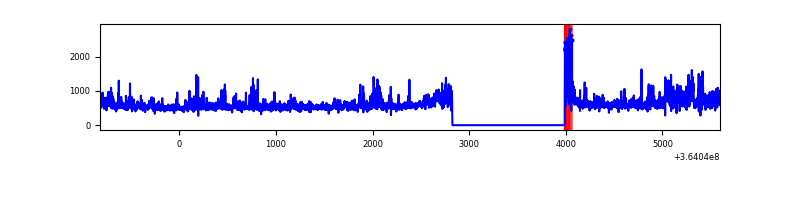 |
| D | 6416 | 5252 | 1 | 1 | 0.02% | 0.02% | 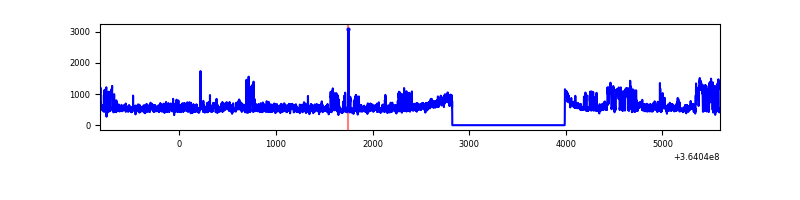 |
Top three noisy pixels from each quadrant. If the there are fewer than three noisy pixels in the level2.evt file, extra rows are filled as -1
| Pixel properties | Quadrant properties | ||||||
|---|---|---|---|---|---|---|---|
| Quadrant | DetID | PixID | Counts | Sigma | Mean | Median | Sigma |
| A | 13 | 254 | 9897 | 64.56 | 709 | 694 | 142.6 |
| A | 3 | 137 | 6727 | 42.32 | 709 | 694 | 142.6 |
| A | 0 | 226 | 6250 | 38.97 | 709 | 694 | 142.6 |
| B | 6 | 159 | 1388296 | 10405.11 | 688 | 673 | 133.4 |
| B | 0 | 190 | 144665 | 1079.73 | 688 | 673 | 133.4 |
| B | 15 | 33 | 25754 | 188.07 | 688 | 673 | 133.4 |
| C | 3 | 233 | 367309 | 2381.3 | 660 | 666 | 154.0 |
| C | 14 | 238 | 148798 | 962.1 | 660 | 666 | 154.0 |
| C | 0 | 10 | 116873 | 754.75 | 660 | 666 | 154.0 |
| D | 8 | 195 | 644325 | 3954.22 | 689 | 672 | 162.8 |
| D | 2 | 234 | 22670 | 135.14 | 689 | 672 | 162.8 |
| D | 12 | 233 | 16581 | 97.74 | 689 | 672 | 162.8 |
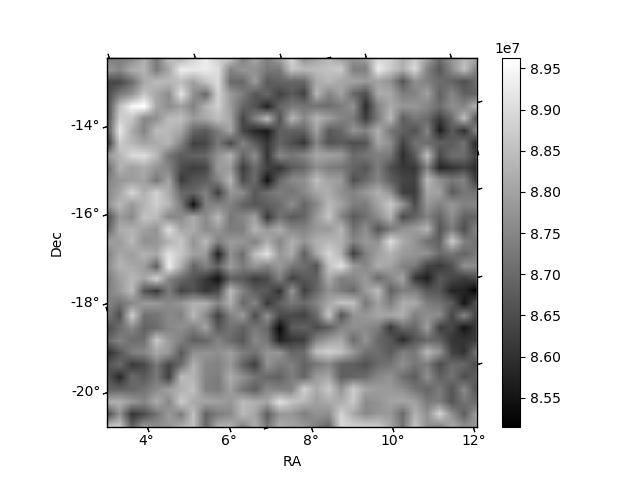
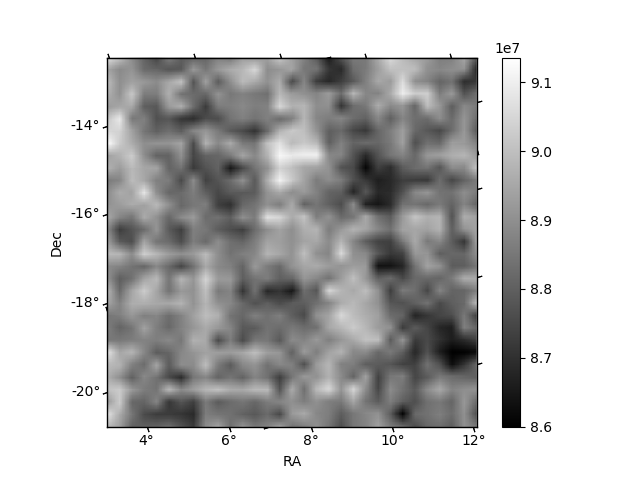
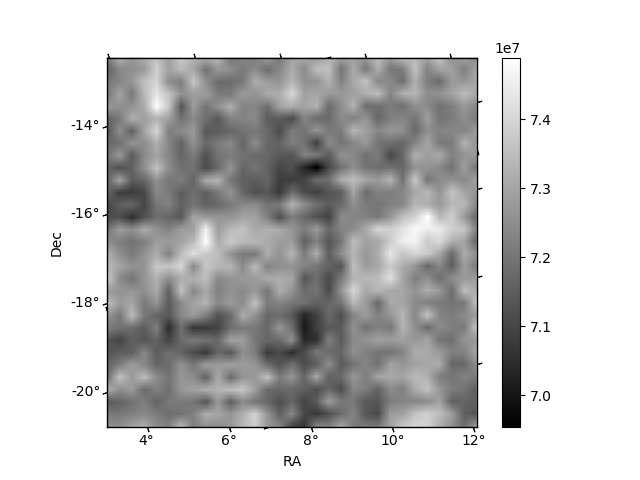
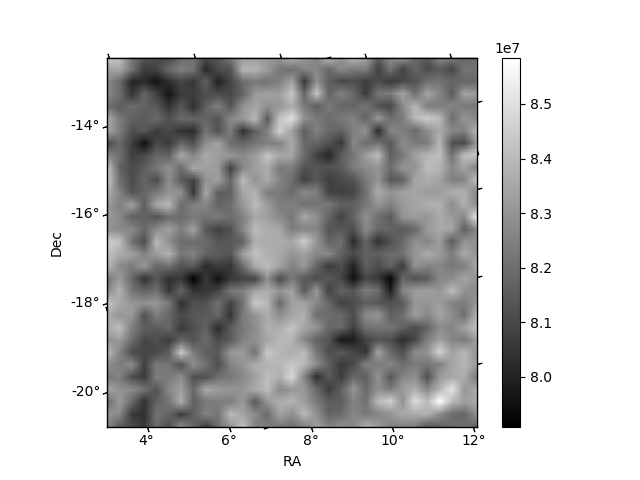
Histogram calculated using DETX and DETY for each event in the final _common_clean file
| Quadrant A | 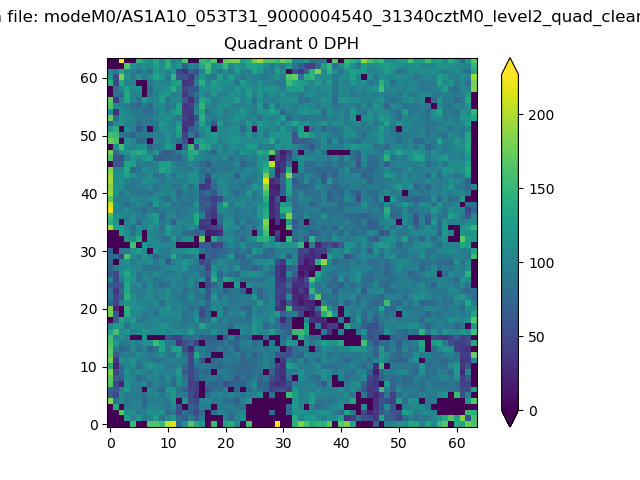 |
 |
Quadrant B |
|---|---|---|---|
| Quadrant D | 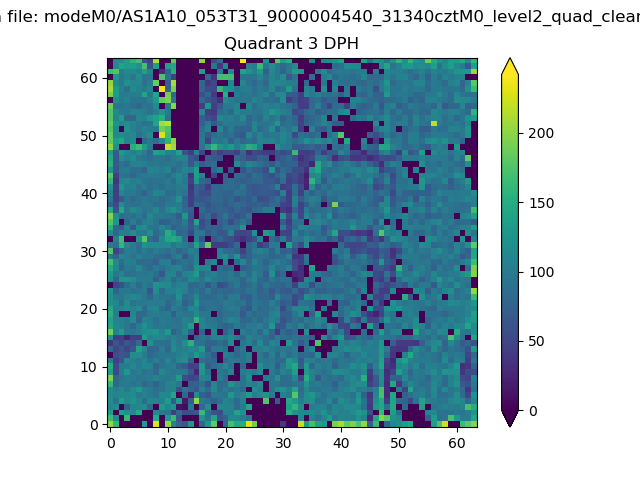 |
 |
Quadrant C |
| Plot type | Count rate plots | Images |
|---|---|---|
| Comparison with Poisson distribution Blue bars denote a histogram of data divided into 1 sec bins. Red curve is a Poisson curve with rate = median count rate of data. |
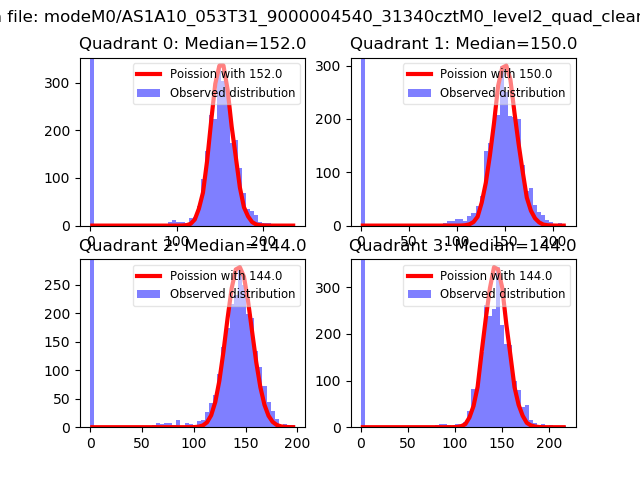 |
 |
| Quadrant-wise count rates Data is divided into 100 sec bins |
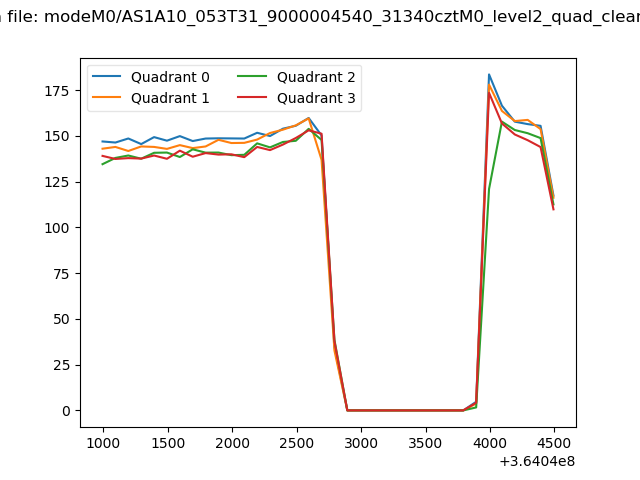 |
|
| Module-wise count rates for Quadrant A Data is divided into 100 sec bins |
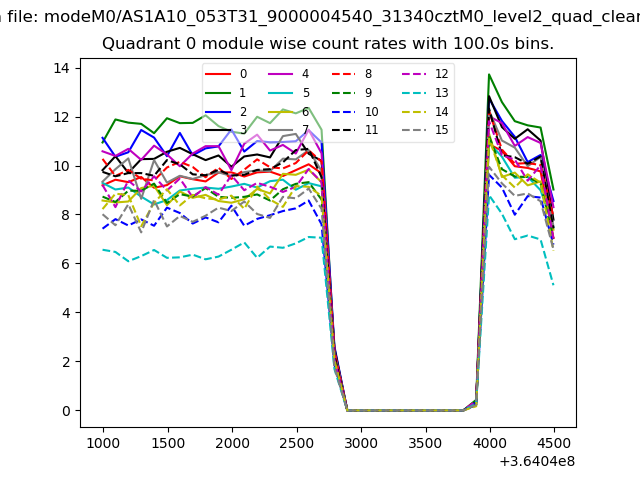 |
 |
| Module-wise count rates for Quadrant B Data is divided into 100 sec bins |
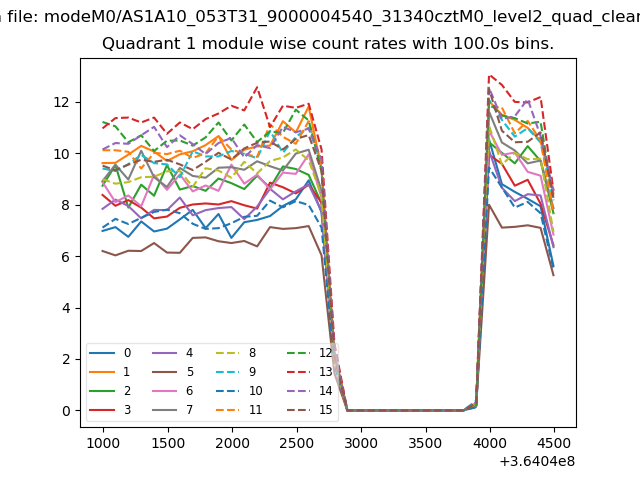 |
 |
| Module-wise count rates for Quadrant C Data is divided into 100 sec bins |
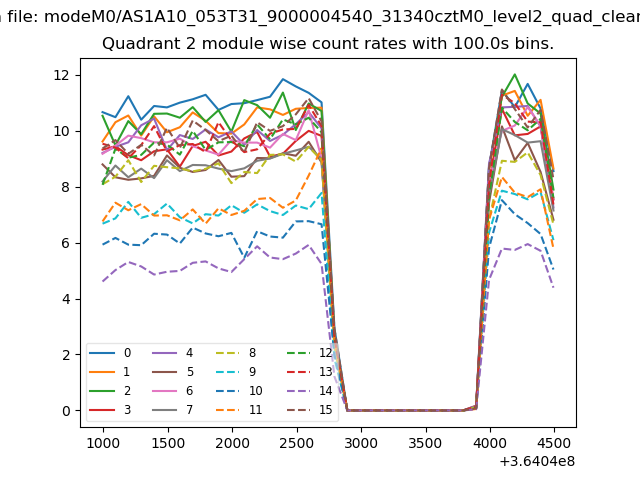 |
 |
| Module-wise count rates for Quadrant D Data is divided into 100 sec bins |
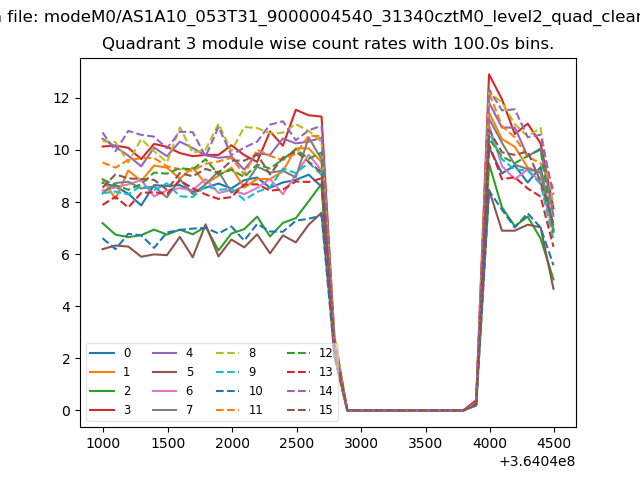 |
 |
| Parameter | Plot |
|---|---|
| CZT HV Monitor | 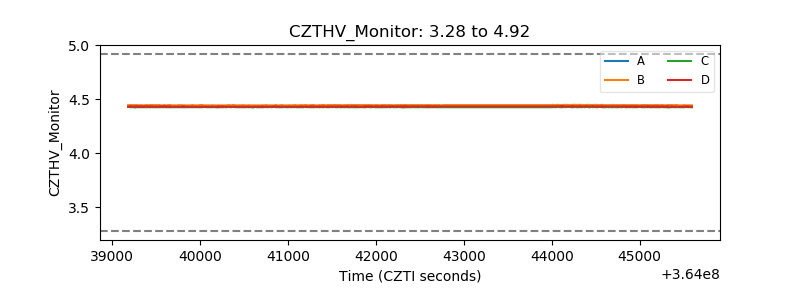 |
| D_VDD | 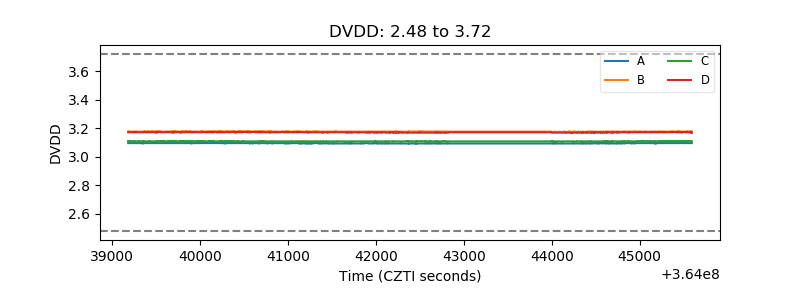 |
| Temperature 1 | 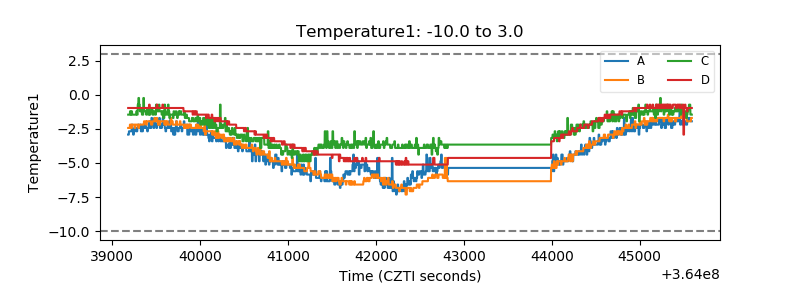 |
| Veto HV Monitor | 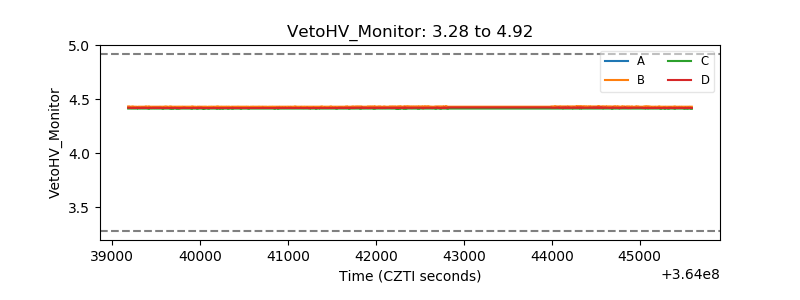 |
| Veto LLD | 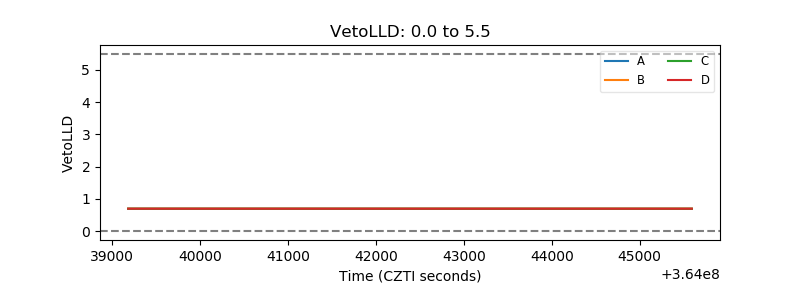 |
| Alpha Counter | 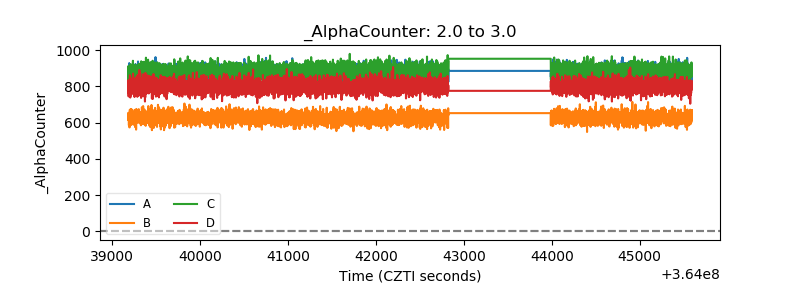 |
| _CPM_Rate | 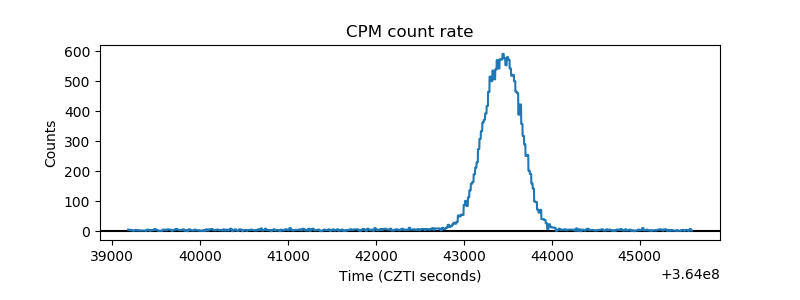 |
| CZT Counter | 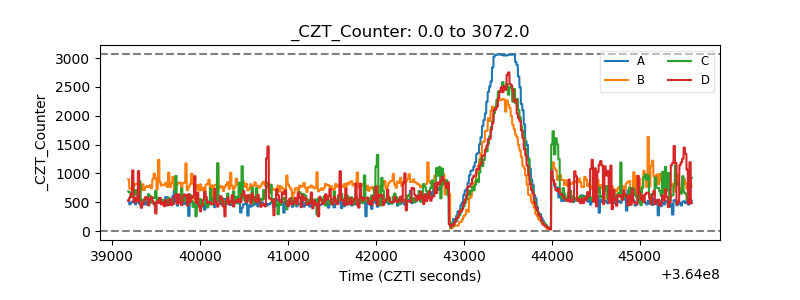 |
| +2.5 Volts monitor |  |
| +5 Volts monitor | 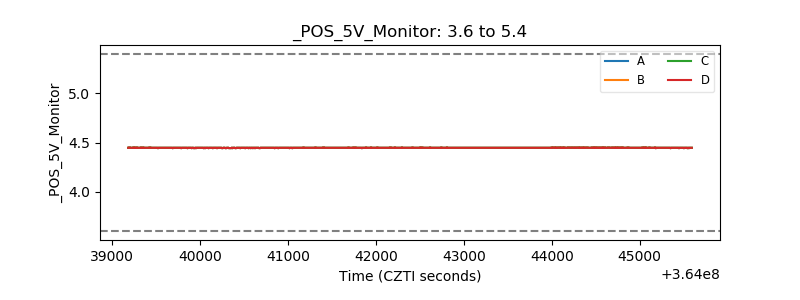 |
| _ROLL_ROT | 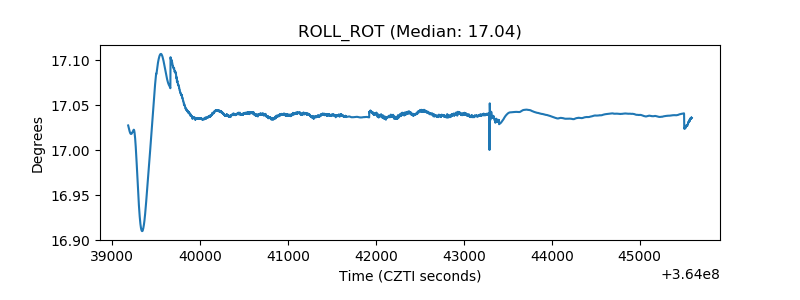 |
| _Roll_DEC | 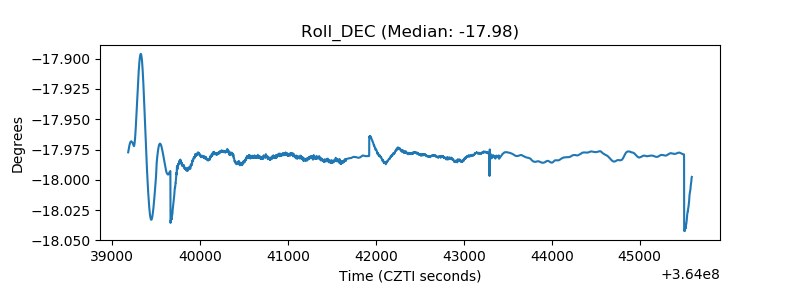 |
| _Roll_RA | 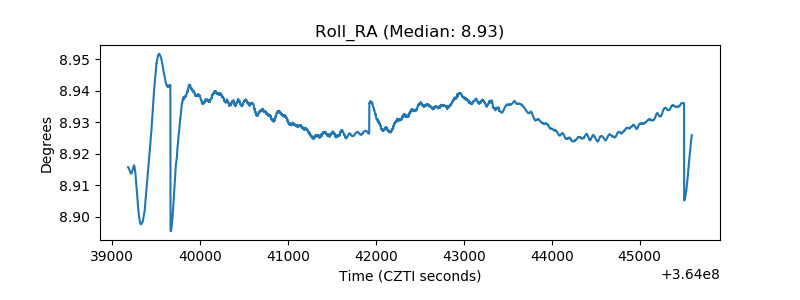 |
| Veto Counter | 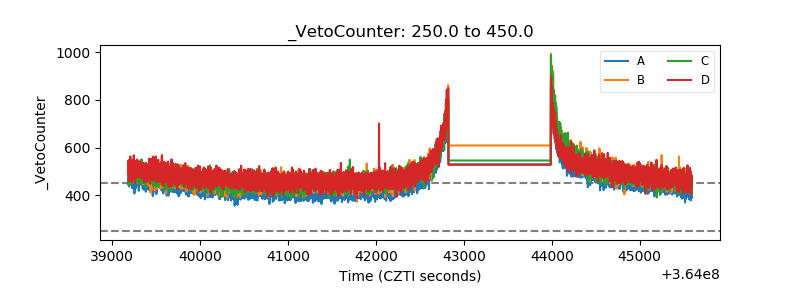 |