| Param | Original file | Final file |
|---|---|---|
| Filename | modeM0/AS1A10_053T31_9000004540_31341cztM0_level2.evt | modeM0/AS1A10_053T31_9000004540_31341cztM0_level2_quad_clean.evt |
| Size (bytes) | 667,307,520 | 77,368,320 |
| Size | 636.4 MB | 73.8 MB |
| Events in quadrant A | 3,558,893 | 483,047 |
| Events in quadrant B | 5,728,113 | 475,689 |
| Events in quadrant C | 4,463,253 | 444,456 |
| Events in quadrant D | 5,989,027 | 454,695 |
| Mode M9 | |||
|---|---|---|---|
| Quadrant | BADHDUFLAG | Total packets | Discarded packets |
| A | 0 | 12 | 0 |
| B | 0 | 13 | 0 |
| C | 0 | 13 | 0 |
| D | 0 | 13 | 0 |
| Mode SS | |||
|---|---|---|---|
| Quadrant | BADHDUFLAG | Total packets | Discarded packets |
| A | 0 | 140 | 0 |
| B | 0 | 140 | 0 |
| C | 0 | 140 | 0 |
| D | 0 | 140 | 0 |
| Mode M0 | |||
|---|---|---|---|
| Quadrant | BADHDUFLAG | Total packets | Discarded packets |
| A | 0 | 14562 | 2 |
| B | 0 | 21856 | 2 |
| C | 0 | 17730 | 2 |
| D | 0 | 22451 | 3 |
| Quadrant | Total seconds | Saturated seconds | Saturation percentage |
|---|---|---|---|
| A | 6962 | 112 | 1.608733% |
| B | 6962 | 240 | 3.447285% |
| C | 6962 | 404 | 5.802930% |
| D | 6961 | 650 | 9.337739% |
Noise dominated data is calculated using 1-second bins in cleaned event files. If a bin has >2000 counts, and if more than 50% of those come from <1% of pixels, then it is considered to be noise-dominated and hence unusable.
| Quadrant | # 1 sec bins | Bins with >0 counts | Bins with >2000 counts | High rate bins dominated by noise | Noise dominated (total time) | Noise dominated (detector-on time) | Marked lightcurve |
|---|---|---|---|---|---|---|---|
| A | 7832 | 6963 | 0 | 0 | 0.00% | 0.00% | 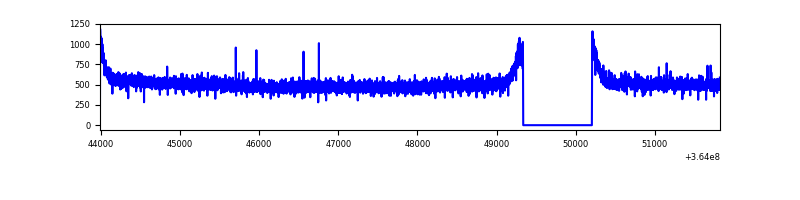 |
| B | 7832 | 6963 | 14 | 14 | 0.18% | 0.20% | 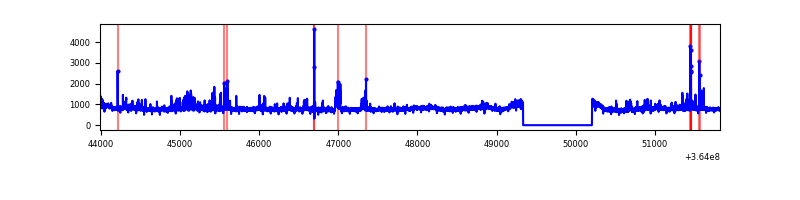 |
| C | 7832 | 6963 | 42 | 42 | 0.54% | 0.60% | 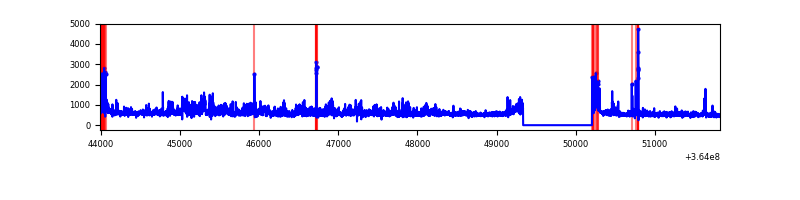 |
| D | 7831 | 6962 | 474 | 474 | 6.05% | 6.81% | 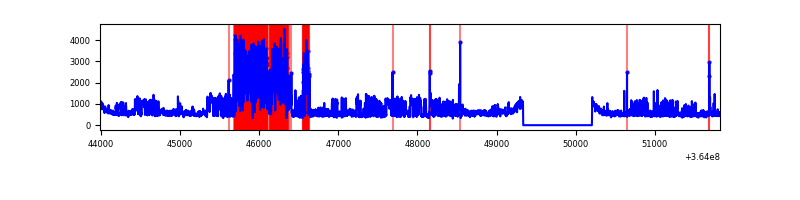 |
Top three noisy pixels from each quadrant. If the there are fewer than three noisy pixels in the level2.evt file, extra rows are filled as -1
| Pixel properties | Quadrant properties | ||||||
|---|---|---|---|---|---|---|---|
| Quadrant | DetID | PixID | Counts | Sigma | Mean | Median | Sigma |
| A | 13 | 254 | 12778 | 63.98 | 921 | 903 | 185.6 |
| A | 3 | 137 | 9098 | 44.15 | 921 | 903 | 185.6 |
| A | 0 | 226 | 7963 | 38.04 | 921 | 903 | 185.6 |
| B | 6 | 159 | 1889456 | 10914.16 | 896 | 873 | 173.0 |
| B | 0 | 190 | 162289 | 932.83 | 896 | 873 | 173.0 |
| B | 4 | 80 | 62925 | 358.6 | 896 | 873 | 173.0 |
| C | 3 | 233 | 542251 | 2704.46 | 853 | 860 | 200.2 |
| C | 0 | 10 | 226520 | 1127.26 | 853 | 860 | 200.2 |
| C | 14 | 238 | 217280 | 1081.1 | 853 | 860 | 200.2 |
| D | 12 | 233 | 1382627 | 6633.25 | 866 | 843 | 208.3 |
| D | 8 | 195 | 1275505 | 6119.01 | 866 | 843 | 208.3 |
| D | 2 | 234 | 27973 | 130.24 | 866 | 843 | 208.3 |
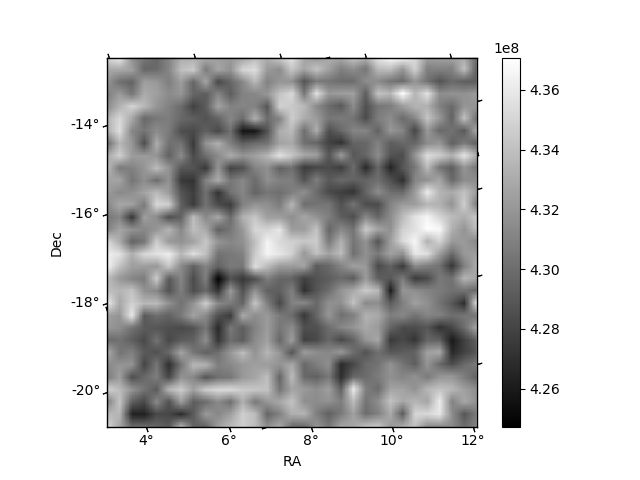
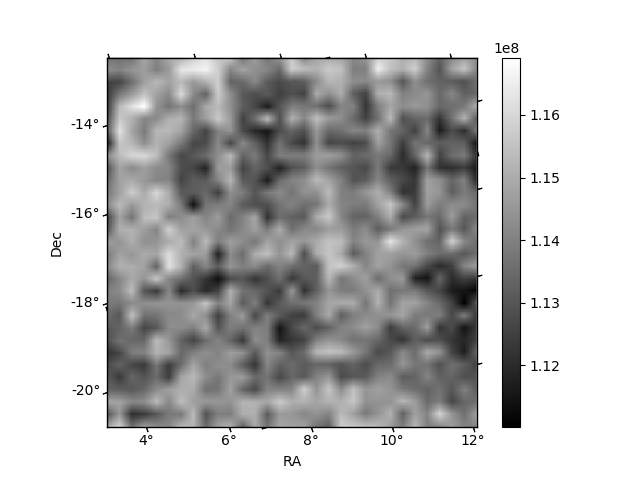
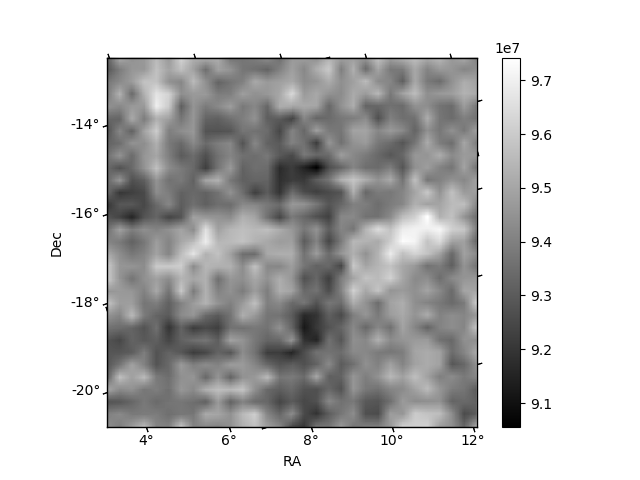
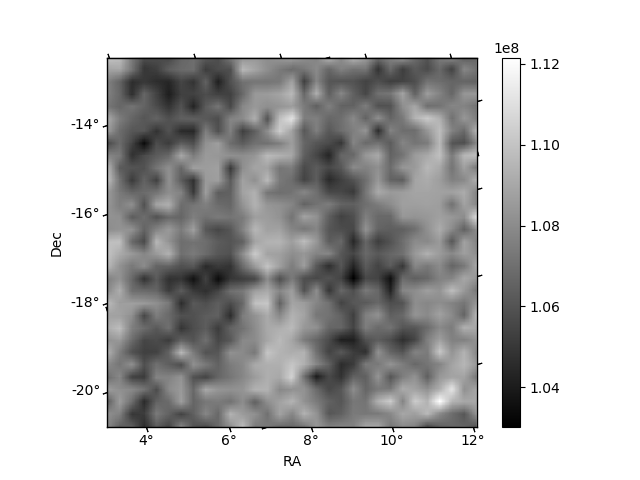
Histogram calculated using DETX and DETY for each event in the final _common_clean file
| Quadrant A | 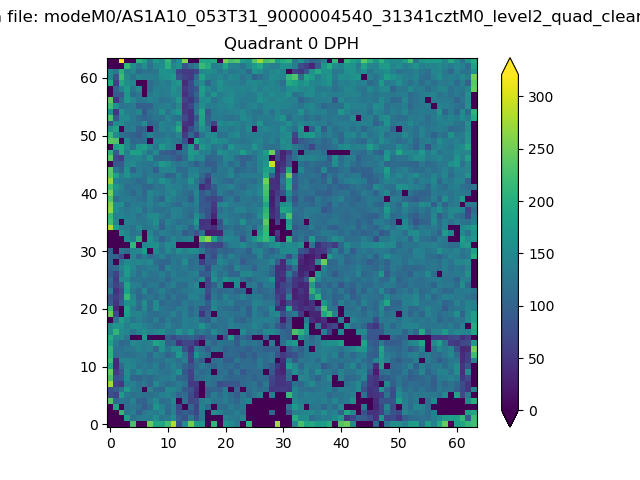 |
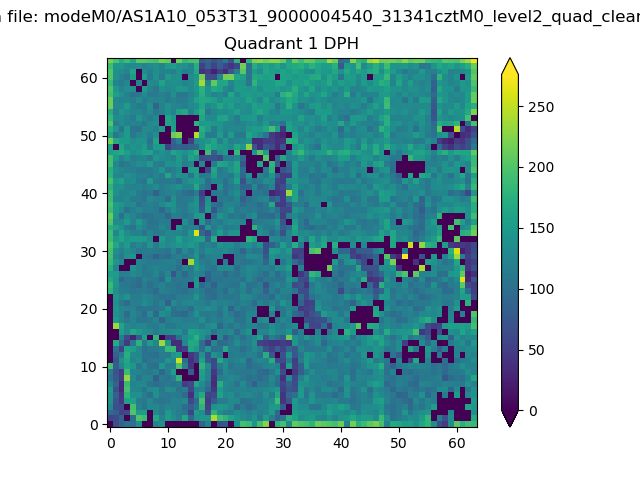 |
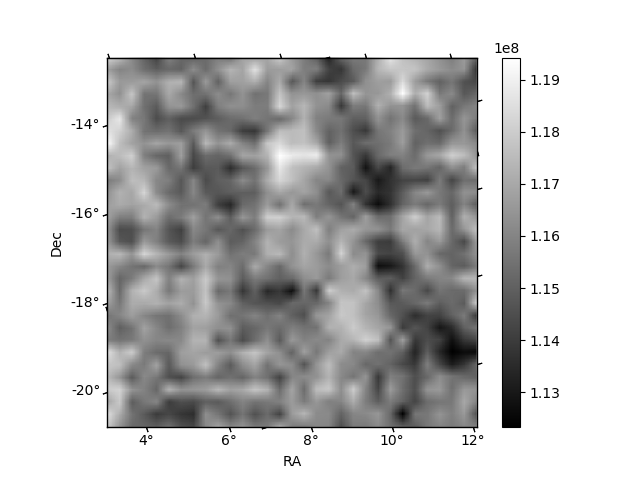
Quadrant B |
|---|---|---|---|
| Quadrant D | 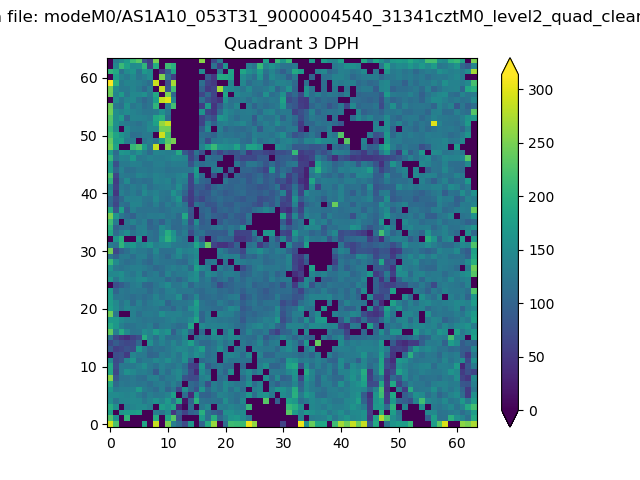 |
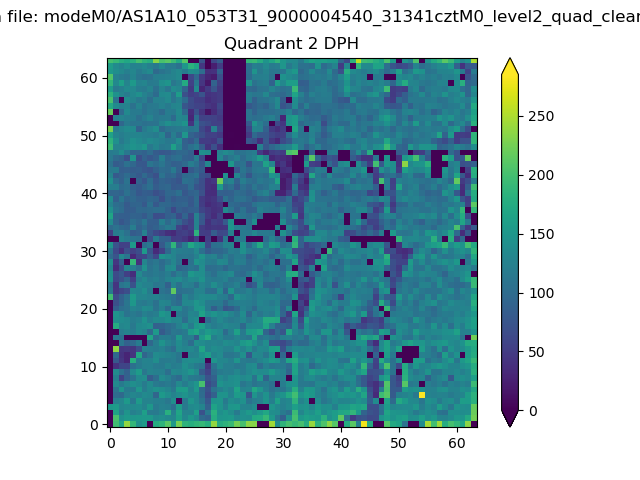 |
Quadrant C |
| Plot type | Count rate plots | Images |
|---|---|---|
| Comparison with Poisson distribution Blue bars denote a histogram of data divided into 1 sec bins. Red curve is a Poisson curve with rate = median count rate of data. |
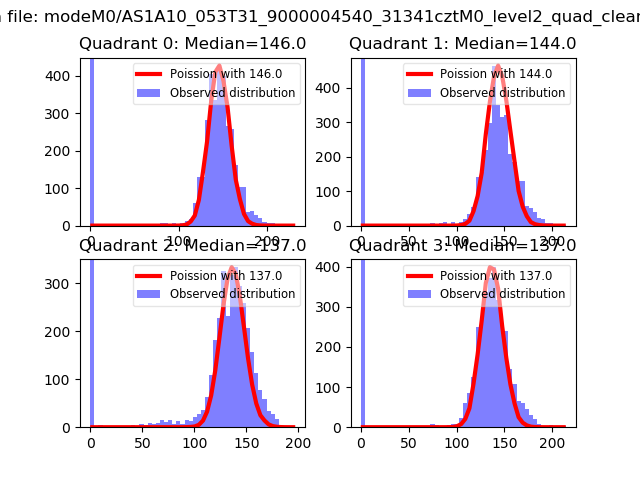 |
 |
| Quadrant-wise count rates Data is divided into 100 sec bins |
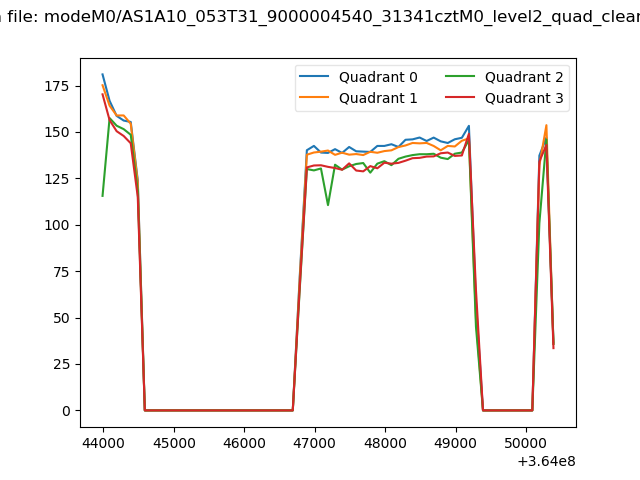 |
|
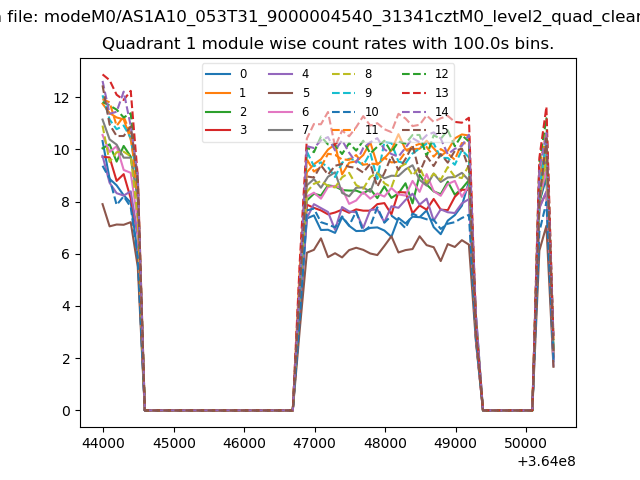
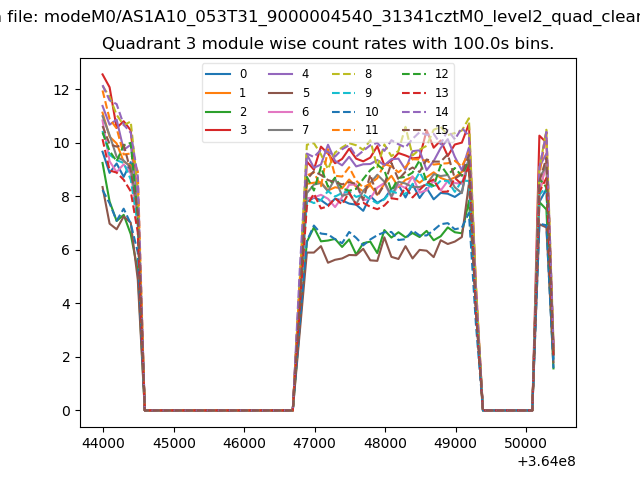
| Module-wise count rates for Quadrant A Data is divided into 100 sec bins |
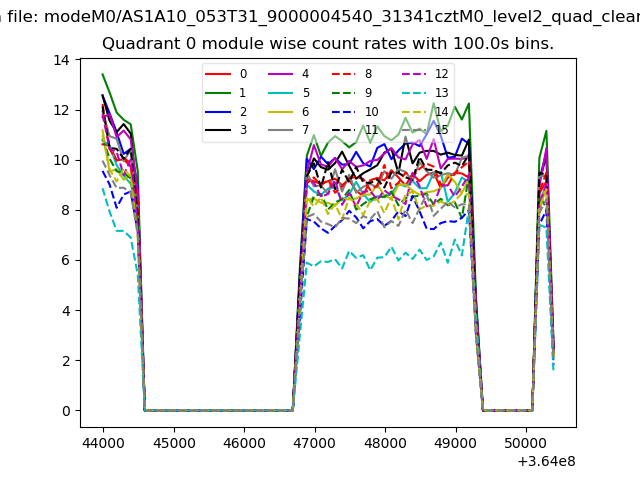 |
 |
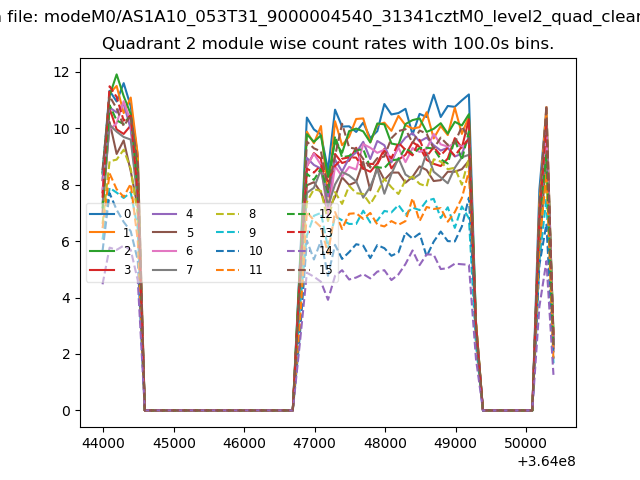
| Module-wise count rates for Quadrant B Data is divided into 100 sec bins |
 |
 |
| Module-wise count rates for Quadrant C Data is divided into 100 sec bins |
 |
 |
| Module-wise count rates for Quadrant D Data is divided into 100 sec bins |
 |
 |
| Parameter | Plot |
|---|---|
| CZT HV Monitor | 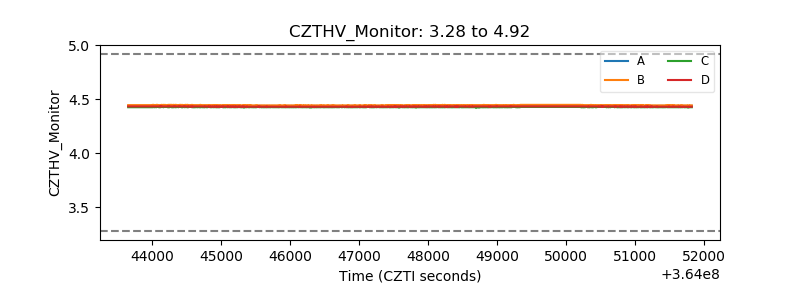 |
| D_VDD | 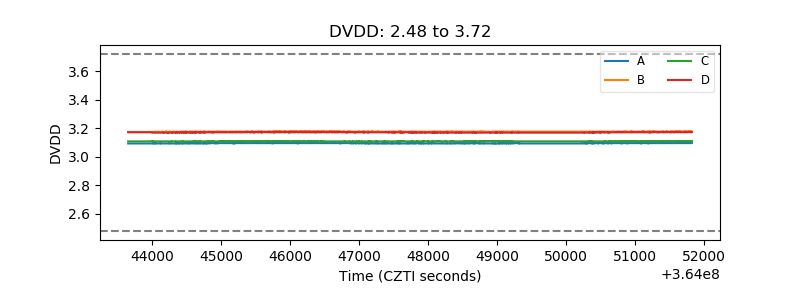 |
| Temperature 1 | 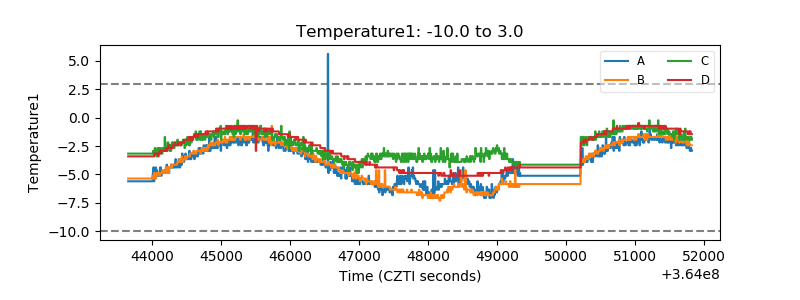 |
| Veto HV Monitor | 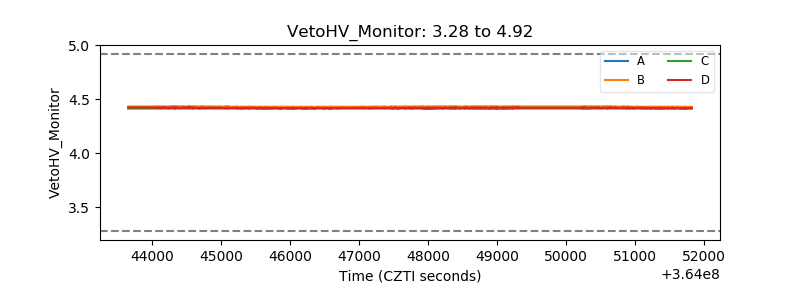 |
| Veto LLD | 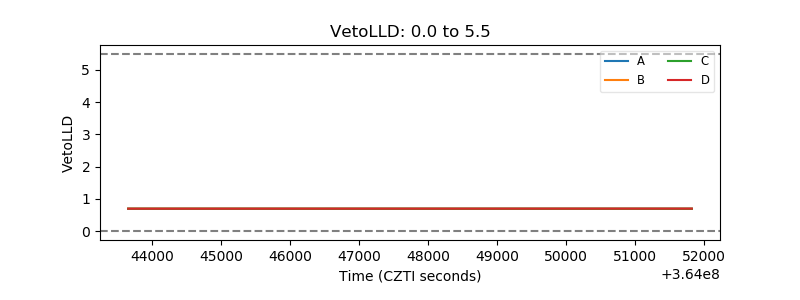 |
| Alpha Counter | 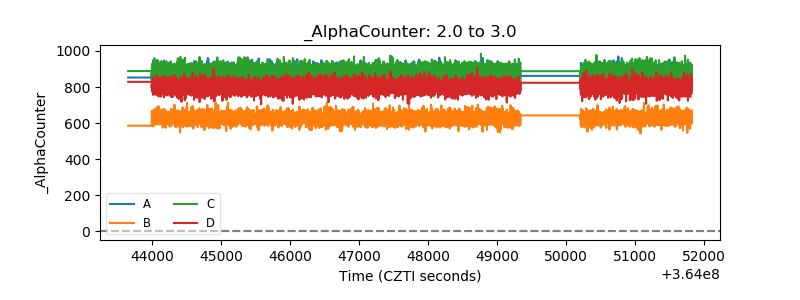 |
| _CPM_Rate | 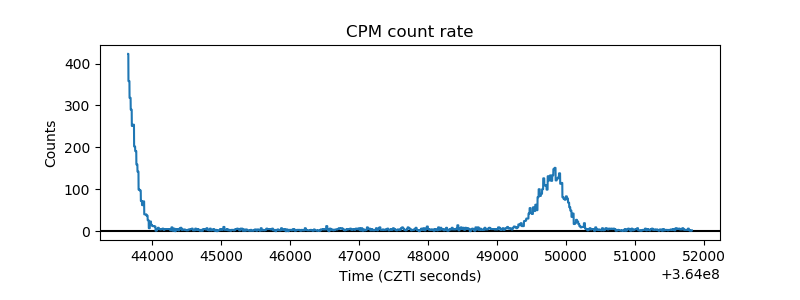 |
| CZT Counter | 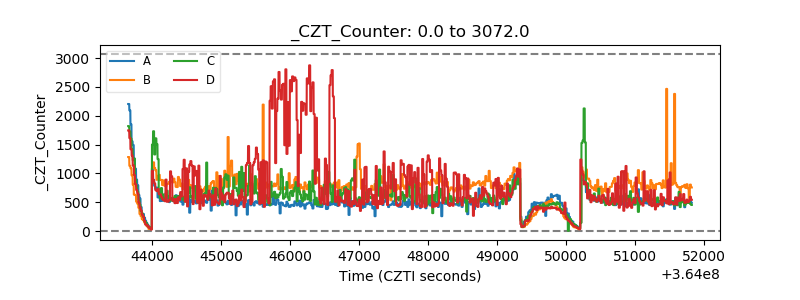 |
| +2.5 Volts monitor | 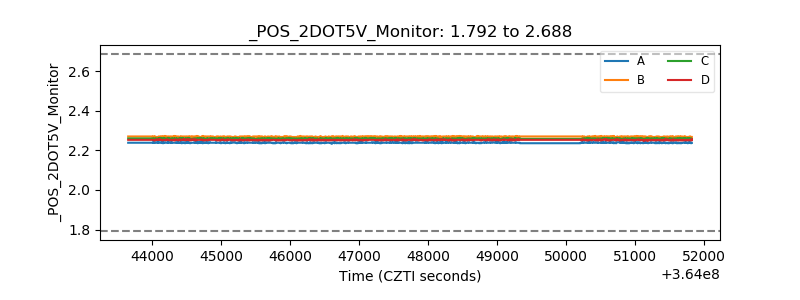 |
| +5 Volts monitor |  |
| _ROLL_ROT | 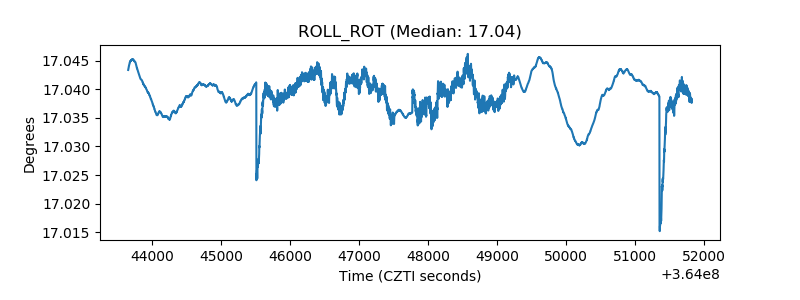 |
| _Roll_DEC | 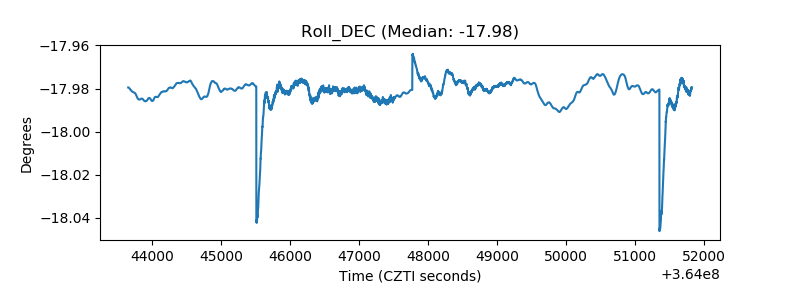 |
| _Roll_RA | 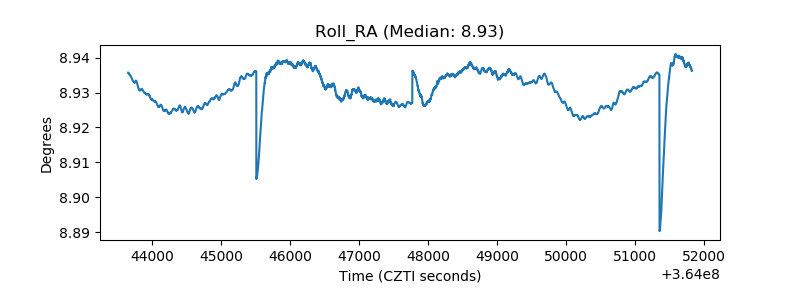 |
| Veto Counter | 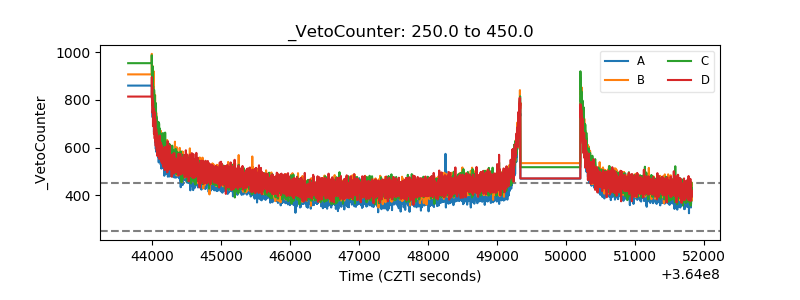 |