| Param | Original file | Final file |
|---|---|---|
| Filename | modeM0/AS1A10_053T31_9000004540_31342cztM0_level2.evt | modeM0/AS1A10_053T31_9000004540_31342cztM0_level2_quad_clean.evt |
| Size (bytes) | 235,039,680 | 17,706,240 |
| Size | 224.2 MB | 16.9 MB |
| Events in quadrant A | 1,400,304 | 84,364 |
| Events in quadrant B | 2,275,252 | 84,606 |
| Events in quadrant C | 1,573,159 | 79,304 |
| Events in quadrant D | 1,671,204 | 80,465 |
| Mode SS | |||
|---|---|---|---|
| Quadrant | BADHDUFLAG | Total packets | Discarded packets |
| A | 0 | 58 | 0 |
| B | 0 | 58 | 0 |
| C | 0 | 58 | 0 |
| D | 0 | 58 | 0 |
| Mode M0 | |||
|---|---|---|---|
| Quadrant | BADHDUFLAG | Total packets | Discarded packets |
| A | 0 | 5883 | 0 |
| B | 0 | 8893 | 0 |
| C | 0 | 6380 | 0 |
| D | 0 | 6849 | 0 |
| Quadrant | Total seconds | Saturated seconds | Saturation percentage |
|---|---|---|---|
| A | 2893 | 4 | 0.138265% |
| B | 2894 | 33 | 1.140290% |
| C | 2894 | 51 | 1.762267% |
| D | 2894 | 19 | 0.656531% |
Noise dominated data is calculated using 1-second bins in cleaned event files. If a bin has >2000 counts, and if more than 50% of those come from <1% of pixels, then it is considered to be noise-dominated and hence unusable.
| Quadrant | # 1 sec bins | Bins with >0 counts | Bins with >2000 counts | High rate bins dominated by noise | Noise dominated (total time) | Noise dominated (detector-on time) | Marked lightcurve |
|---|---|---|---|---|---|---|---|
| A | 2893 | 2893 | 0 | 0 | 0.00% | 0.00% | 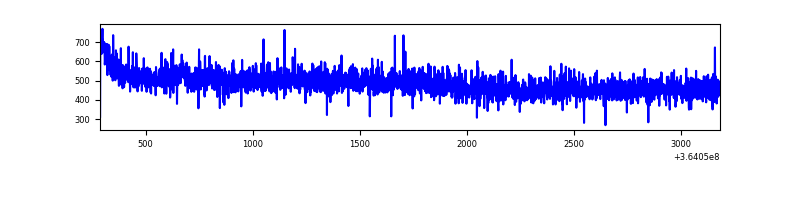 |
| B | 2894 | 2894 | 7 | 7 | 0.24% | 0.24% | 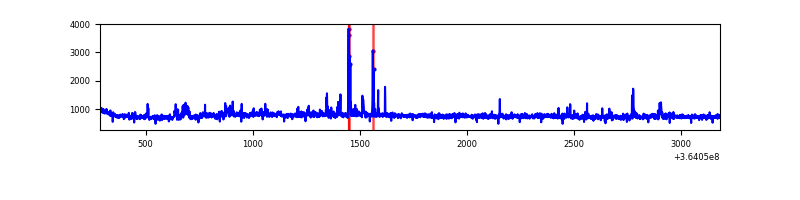 |
| C | 2894 | 2894 | 10 | 10 | 0.35% | 0.35% | 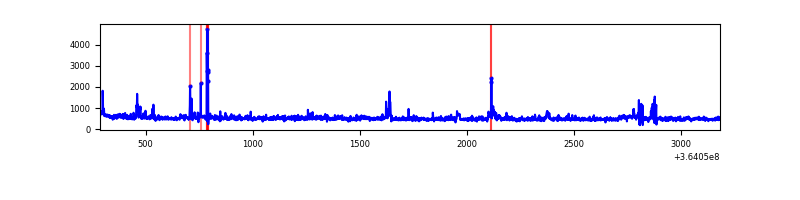 |
| D | 2894 | 2894 | 12 | 12 | 0.41% | 0.41% | 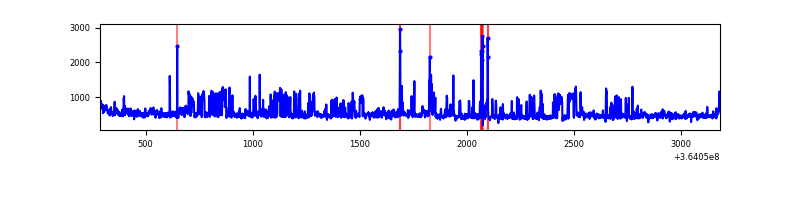 |
Top three noisy pixels from each quadrant. If the there are fewer than three noisy pixels in the level2.evt file, extra rows are filled as -1
| Pixel properties | Quadrant properties | ||||||
|---|---|---|---|---|---|---|---|
| Quadrant | DetID | PixID | Counts | Sigma | Mean | Median | Sigma |
| A | 13 | 254 | 5680 | 71.16 | 361 | 354 | 74.8 |
| A | 5 | 16 | 5371 | 67.03 | 361 | 354 | 74.8 |
| A | 3 | 137 | 3613 | 43.54 | 361 | 354 | 74.8 |
| B | 6 | 159 | 776556 | 11306.65 | 353 | 344 | 68.7 |
| B | 0 | 190 | 73400 | 1064.16 | 353 | 344 | 68.7 |
| B | 0 | 155 | 8997 | 126.04 | 353 | 344 | 68.7 |
| C | 3 | 233 | 119627 | 1472.54 | 337 | 339 | 81.0 |
| C | 14 | 238 | 63289 | 777.08 | 337 | 339 | 81.0 |
| C | 14 | 128 | 27308 | 332.92 | 337 | 339 | 81.0 |
| D | 8 | 195 | 291034 | 3417.28 | 347 | 337 | 85.1 |
| D | 7 | 69 | 21528 | 249.11 | 347 | 337 | 85.1 |
| D | 13 | 249 | 14315 | 164.32 | 347 | 337 | 85.1 |
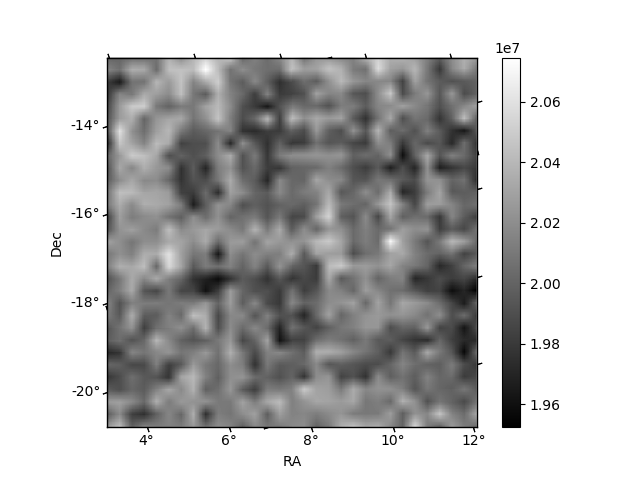
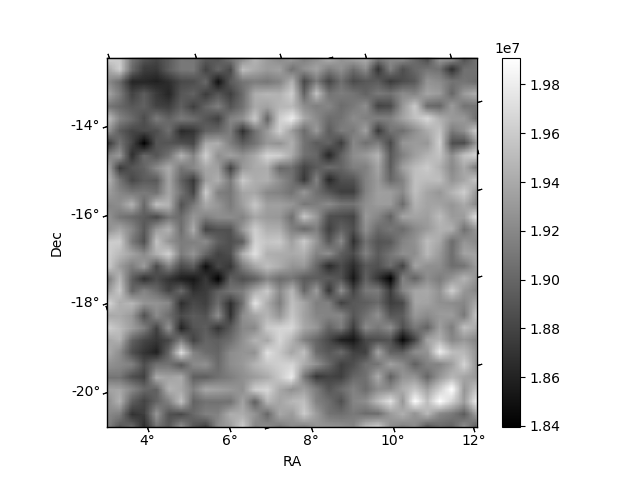
Histogram calculated using DETX and DETY for each event in the final _common_clean file
| Quadrant A | 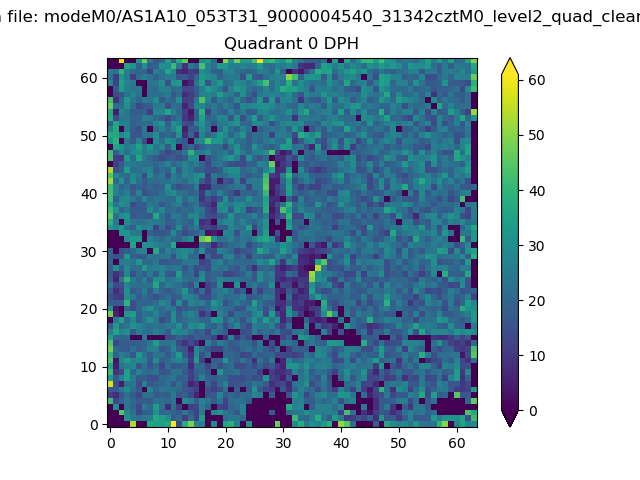 |
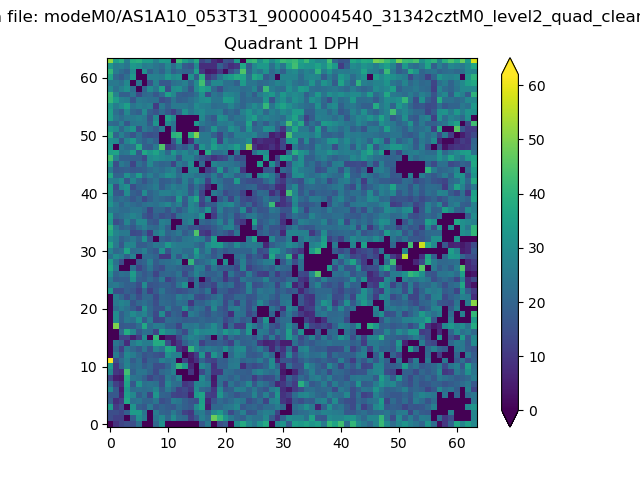 |
Quadrant B |
|---|---|---|---|
| Quadrant D | 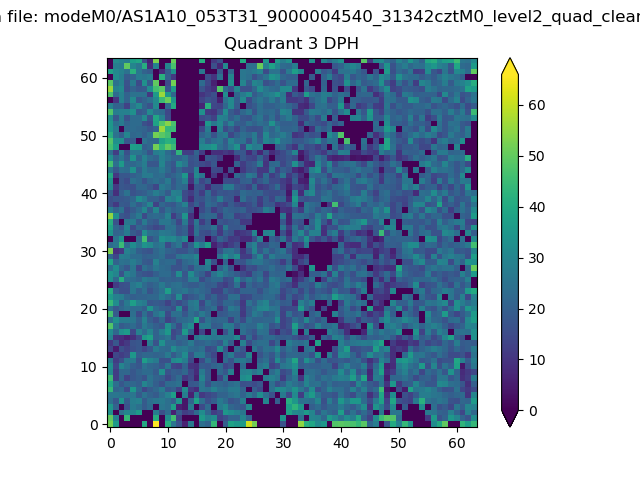 |
 |
Quadrant C |
| Plot type | Count rate plots | Images |
|---|---|---|
| Comparison with Poisson distribution Blue bars denote a histogram of data divided into 1 sec bins. Red curve is a Poisson curve with rate = median count rate of data. |
 |
 |
| Quadrant-wise count rates Data is divided into 100 sec bins |
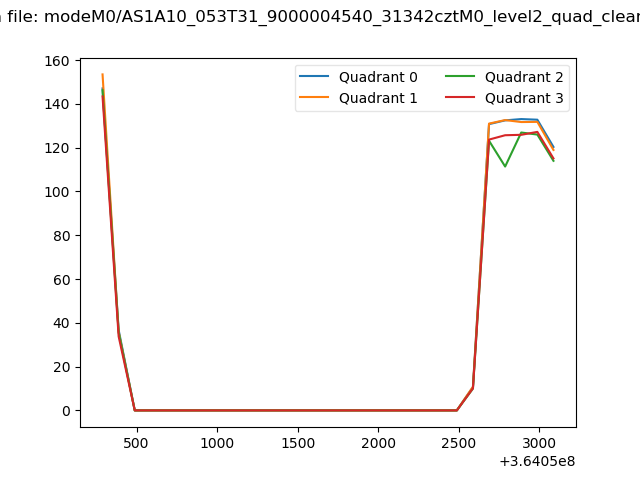 |
|
| Module-wise count rates for Quadrant A Data is divided into 100 sec bins |
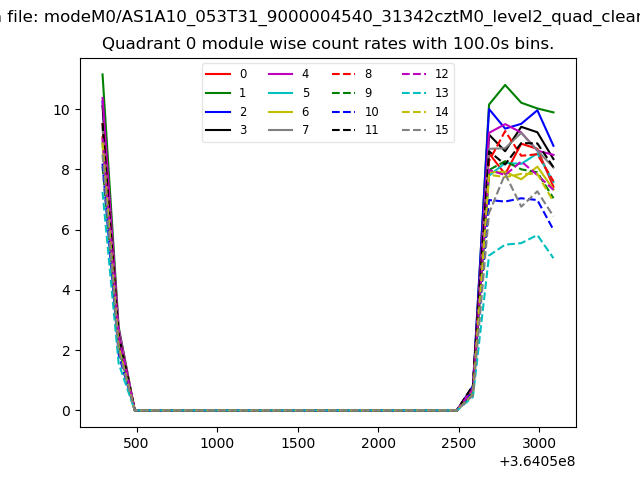 |
 |
| Module-wise count rates for Quadrant B Data is divided into 100 sec bins |
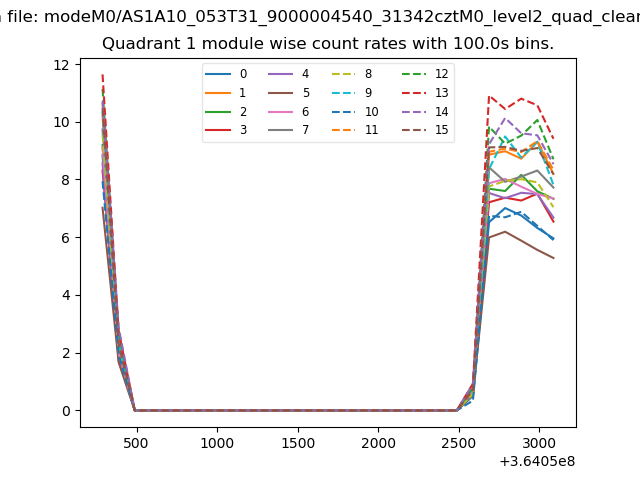 |
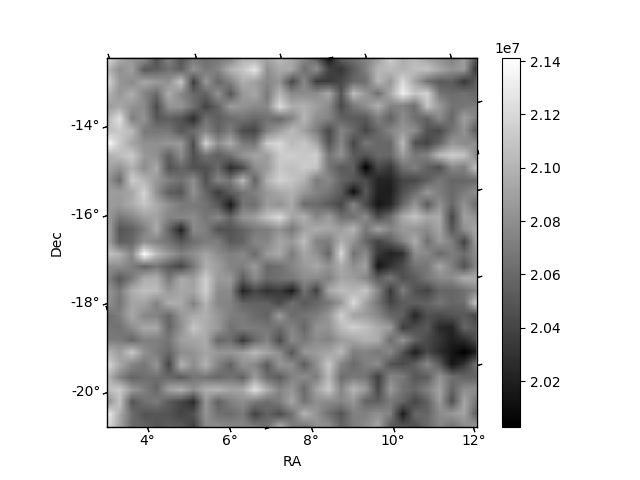 |
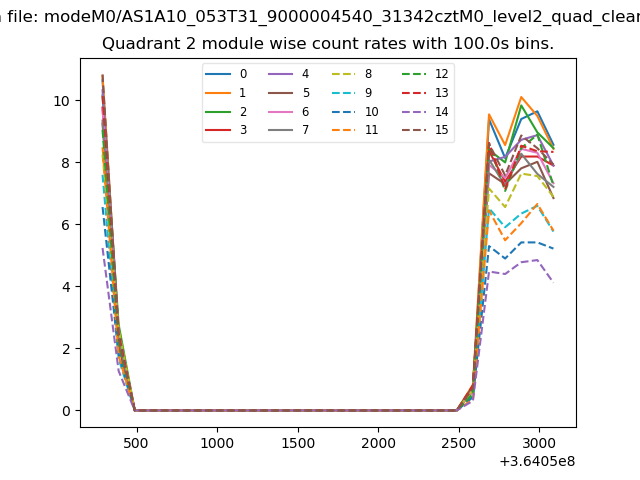
| Module-wise count rates for Quadrant C Data is divided into 100 sec bins |
 |
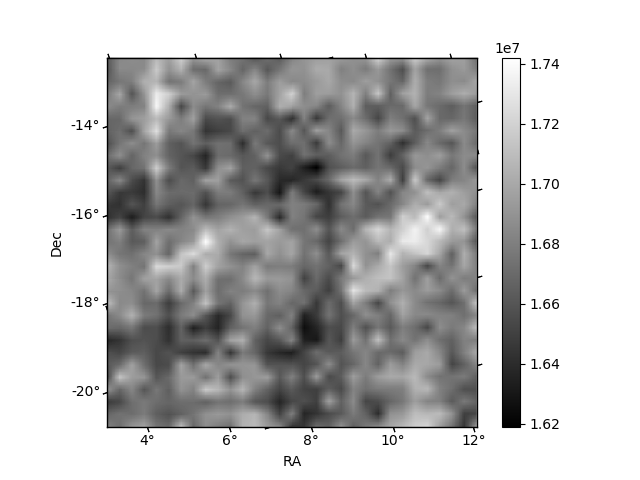 |
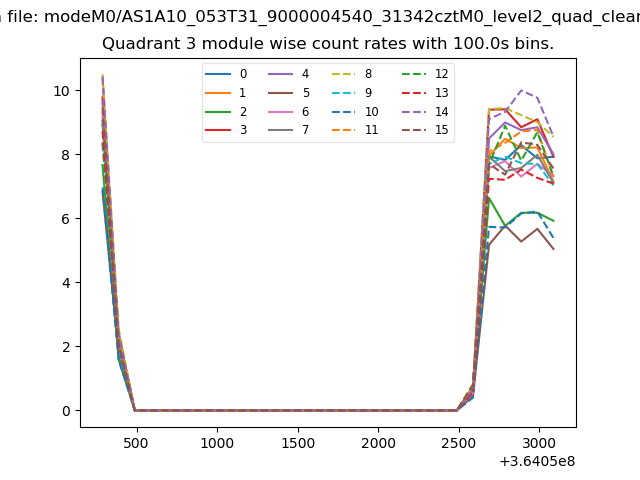
| Module-wise count rates for Quadrant D Data is divided into 100 sec bins |
 |
 |
| Parameter | Plot |
|---|---|
| CZT HV Monitor | 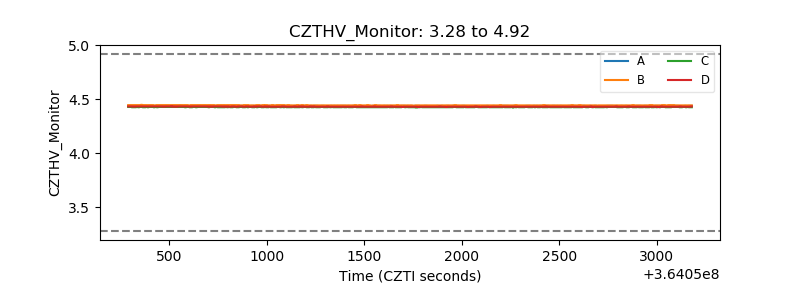 |
| D_VDD | 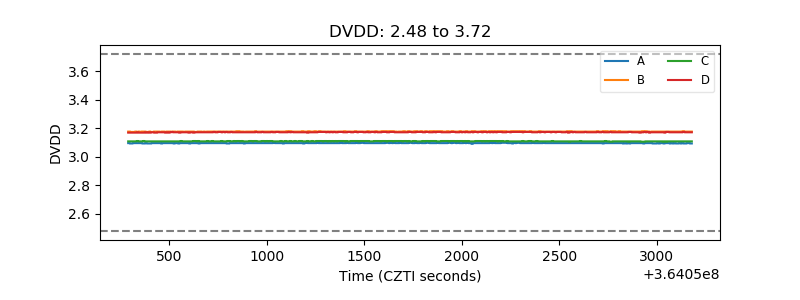 |
| Temperature 1 |  |
| Veto HV Monitor | 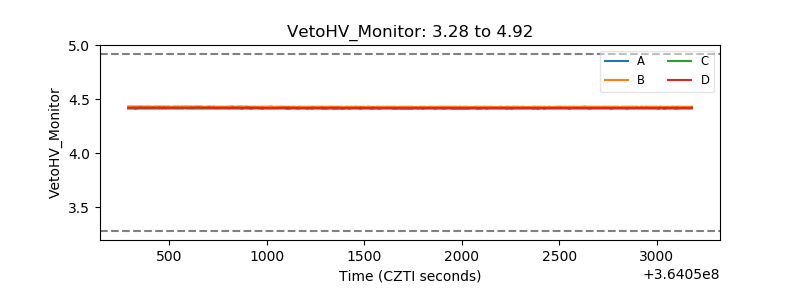 |
| Veto LLD | 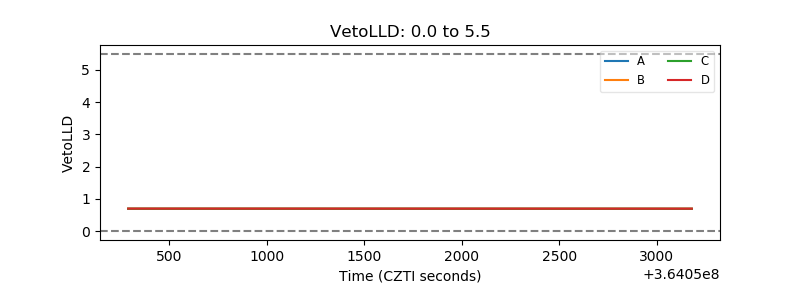 |
| Alpha Counter | 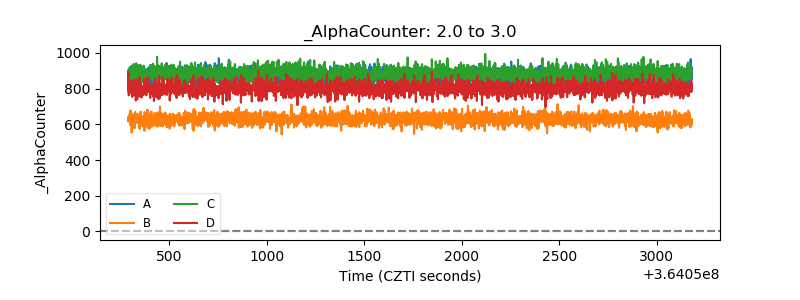 |
| _CPM_Rate | 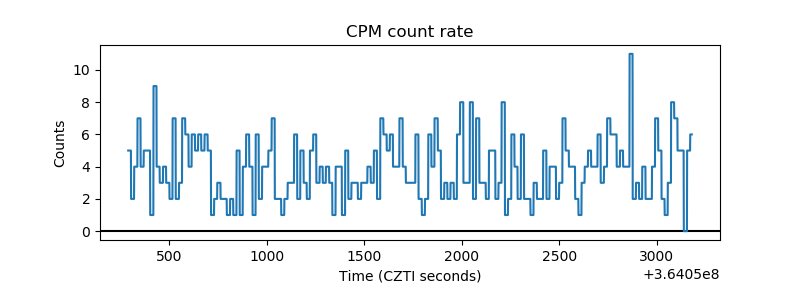 |
| CZT Counter |  |
| +2.5 Volts monitor |  |
| +5 Volts monitor |  |
| _ROLL_ROT | 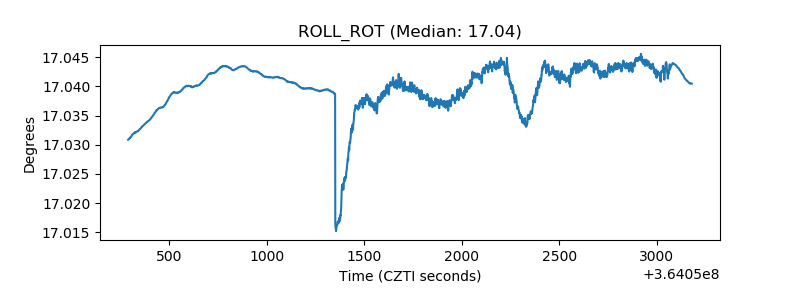 |
| _Roll_DEC | 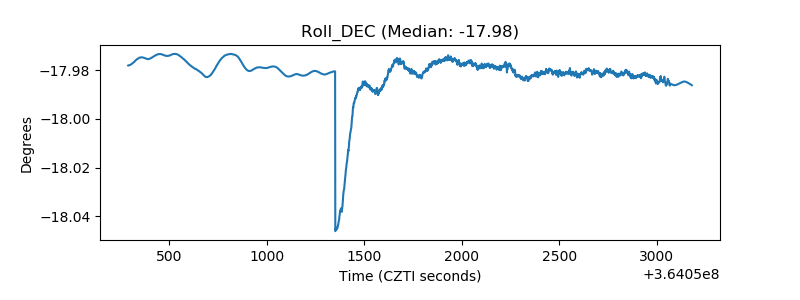 |
| _Roll_RA |  |
| Veto Counter | 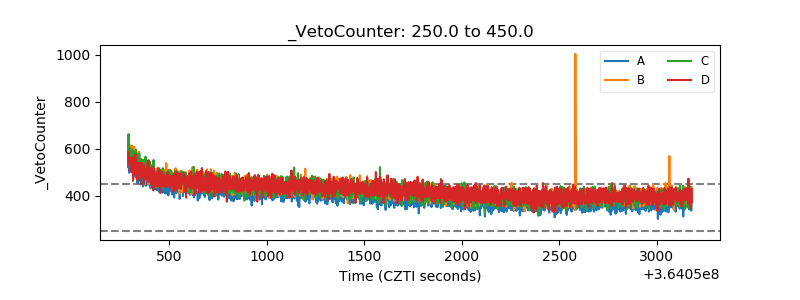 |