| Param | Original file | Final file |
|---|---|---|
| Filename | modeM0/AS1A10_053T40_9000004542cztM0_level2.fits | modeM0/AS1A10_053T40_9000004542cztM0_level2_quad_clean.evt |
| Size (bytes) | 111,859,200 | 110,482,560 |
| Size | 106.7 MB | 105.4 MB |
| Events in quadrant A | 692,892 | 674,552 |
| Events in quadrant B | 641,064 | 656,228 |
| Events in quadrant C | 655,994 | 623,204 |
| Events in quadrant D | 598,338 | 592,386 |
| Mode M0 | |||
|---|---|---|---|
| Quadrant | BADHDUFLAG | Total packets | Discarded packets |
| A | 0 | 24018 | 0 |
| B | 0 | 35444 | 0 |
| C | 0 | 25662 | 0 |
| D | 0 | 26924 | 0 |
| Mode SS | |||
|---|---|---|---|
| Quadrant | BADHDUFLAG | Total packets | Discarded packets |
| A | 0 | 236 | 0 |
| B | 0 | 236 | 0 |
| C | 0 | 236 | 0 |
| D | 0 | 236 | 0 |
| Mode M9 | |||
|---|---|---|---|
| Quadrant | BADHDUFLAG | Total packets | Discarded packets |
| A | 0 | 5 | 0 |
| B | 0 | 5 | 0 |
| C | 0 | 5 | 0 |
| D | 0 | 5 | 0 |
| Quadrant | Total seconds | Saturated seconds | Saturation percentage |
|---|---|---|---|
| A | 11545 | 304 | 2.633175% |
| B | 11545 | 478 | 4.140320% |
| C | 11545 | 634 | 5.491555% |
| D | 11545 | 261 | 2.260719% |
Noise dominated data is calculated using 1-second bins in cleaned event files. If a bin has >2000 counts, and if more than 50% of those come from <1% of pixels, then it is considered to be noise-dominated and hence unusable.
| Quadrant | # 1 sec bins | Bins with >0 counts | Bins with >2000 counts | High rate bins dominated by noise | Noise dominated (total time) | Noise dominated (detector-on time) | Marked lightcurve |
|---|---|---|---|---|---|---|---|
| A | 12055 | 11545 | 0 | 0 | 0.00% | 0.00% | 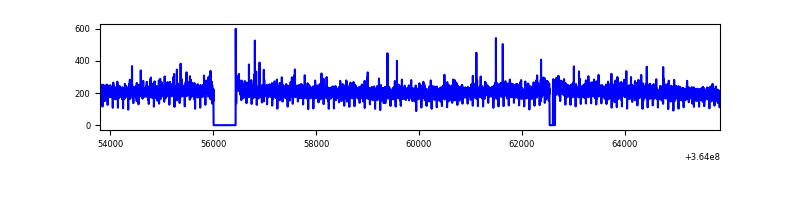 |
| B | 12055 | 11545 | 0 | 0 | 0.00% | 0.00% |  |
| C | 12055 | 11545 | 0 | 0 | 0.00% | 0.00% | 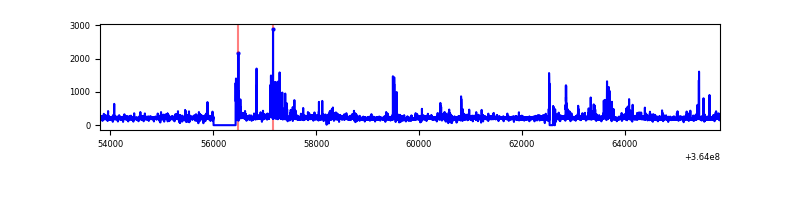 |
| D | 12055 | 11545 | 0 | 0 | 0.00% | 0.00% |  |
Top three noisy pixels from each quadrant. If the there are fewer than three noisy pixels in the level2.evt file, extra rows are filled as -1
| Pixel properties | Quadrant properties | ||||||
|---|---|---|---|---|---|---|---|
| Quadrant | DetID | PixID | Counts | Sigma | Mean | Median | Sigma |
| A | 0 | 29 | 692 | 11.44 | 180 | 170 | 45.6 |
| A | 7 | 110 | 583 | 9.05 | 180 | 170 | 45.6 |
| A | 0 | 30 | 564 | 8.64 | 180 | 170 | 45.6 |
| B | 2 | 9 | 552 | 11.09 | 169 | 161 | 35.3 |
| B | 5 | 232 | 461 | 8.51 | 169 | 161 | 35.3 |
| B | 3 | 80 | 447 | 8.11 | 169 | 161 | 35.3 |
| C | 12 | 241 | 460 | 6.68 | 173 | 161 | 44.7 |
| C | 7 | 111 | 454 | 6.55 | 173 | 161 | 44.7 |
| C | 7 | 233 | 441 | 6.26 | 173 | 161 | 44.7 |
| D | 1 | 3 | 424 | 5.65 | 171 | 155 | 47.6 |
| D | 10 | 189 | 412 | 5.4 | 171 | 155 | 47.6 |
| D | 4 | 160 | 409 | 5.33 | 171 | 155 | 47.6 |
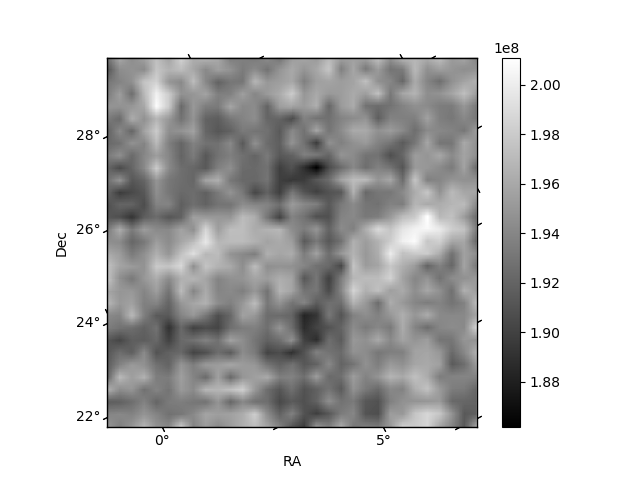
Histogram calculated using DETX and DETY for each event in the final _common_clean file
| Quadrant A | 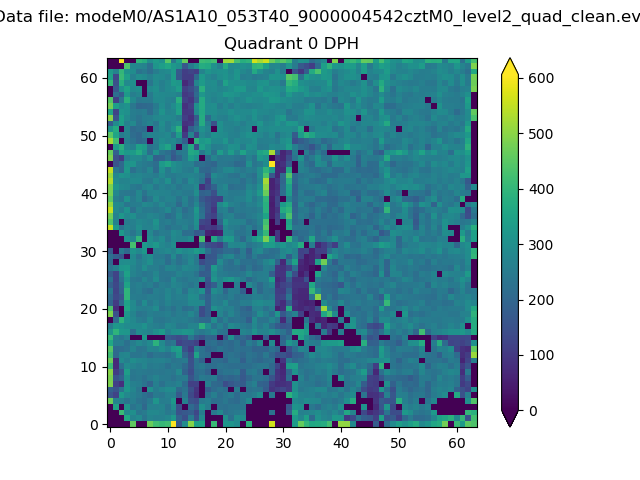 |
 |
Quadrant B |
|---|---|---|---|
| Quadrant D | 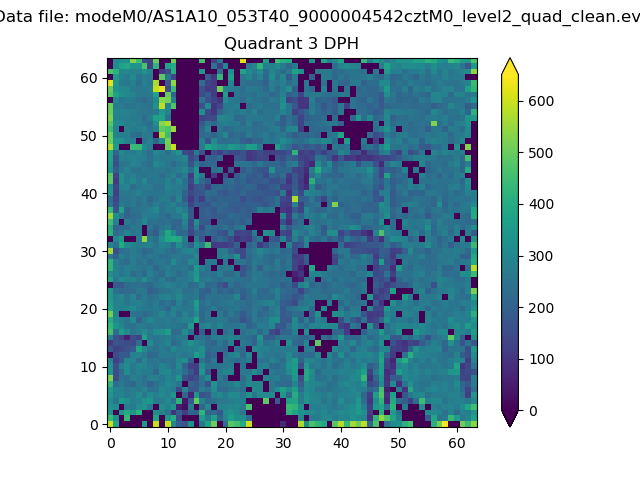 |
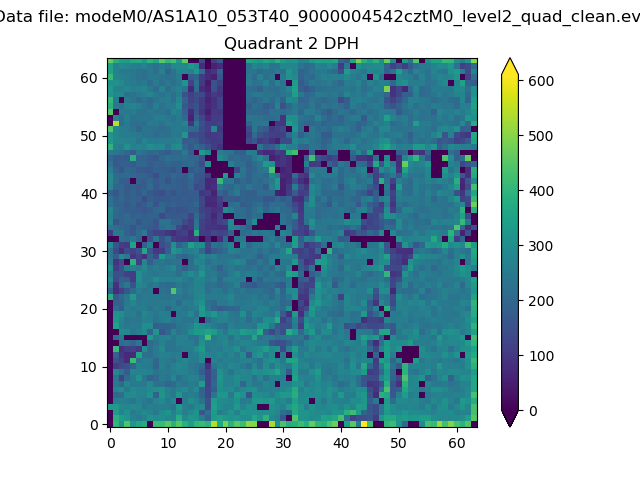 |
Quadrant C |
| Plot type | Count rate plots | Images |
|---|---|---|
| Comparison with Poisson distribution Blue bars denote a histogram of data divided into 1 sec bins. Red curve is a Poisson curve with rate = median count rate of data. |
 |
 |
| Quadrant-wise count rates Data is divided into 100 sec bins |
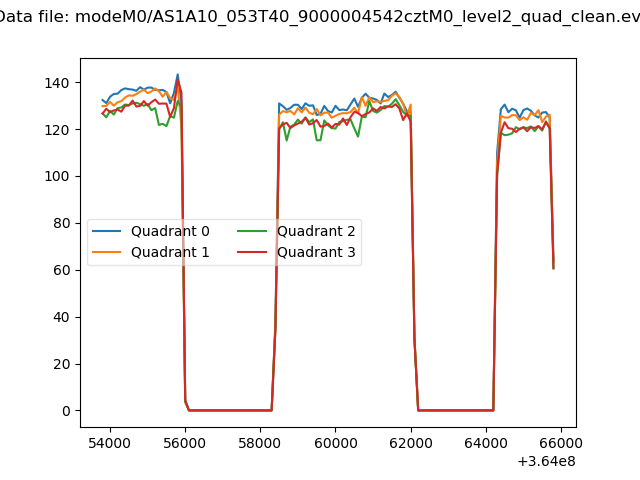 |
|
| Module-wise count rates for Quadrant A Data is divided into 100 sec bins |
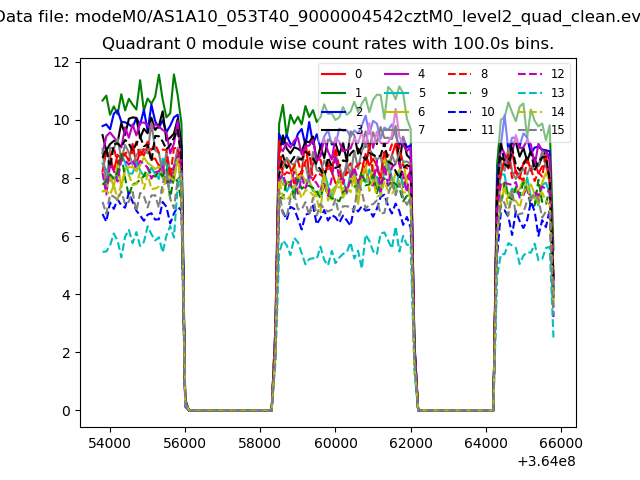 |
 |
| Module-wise count rates for Quadrant B Data is divided into 100 sec bins |
 |
 |
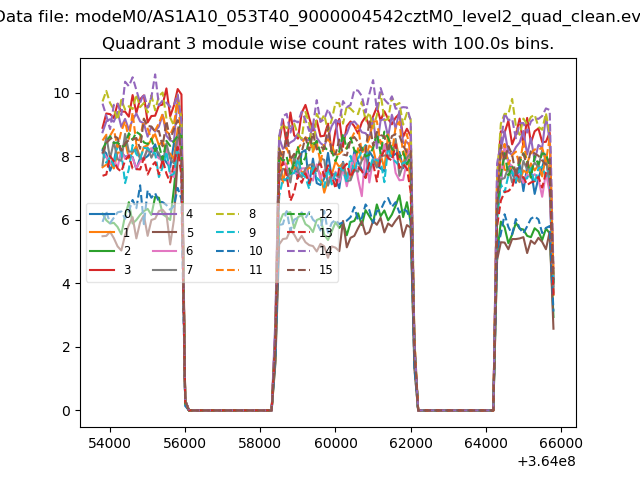
| Module-wise count rates for Quadrant C Data is divided into 100 sec bins |
 |
 |
| Module-wise count rates for Quadrant D Data is divided into 100 sec bins |
 |
 |
| Parameter | Plot |
|---|---|
| CZT HV Monitor |  |
| D_VDD | 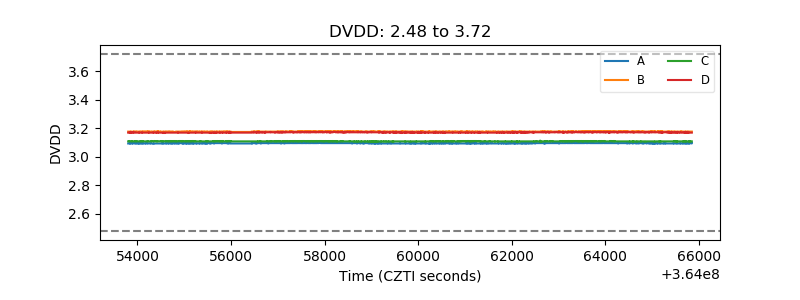 |
| Temperature 1 | 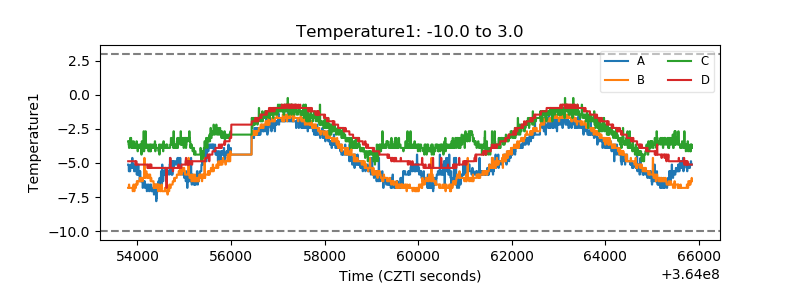 |
| Veto HV Monitor |  |
| Veto LLD |  |
| Alpha Counter | 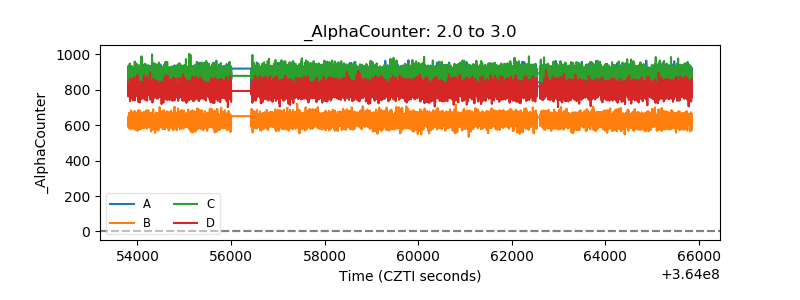 |
| _CPM_Rate | 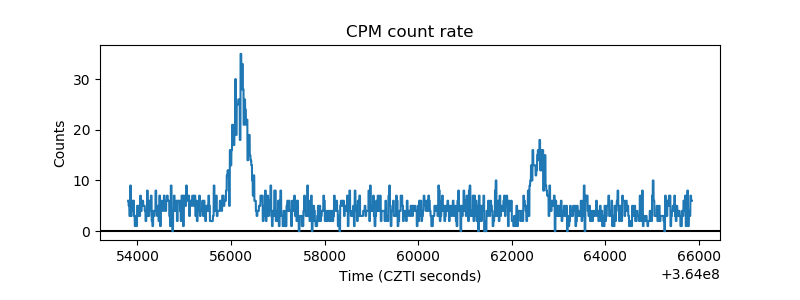 |
| CZT Counter |  |
| +2.5 Volts monitor |  |
| +5 Volts monitor | 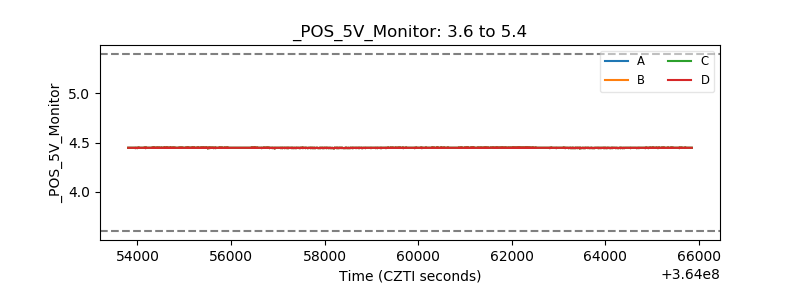 |
| _ROLL_ROT |  |
| _Roll_DEC |  |
| _Roll_RA |  |
| Veto Counter |  |