| Param | Original file | Final file |
|---|---|---|
| Filename | modeM0/AS1A10_053T40_9000004542_31342cztM0_level2.evt | modeM0/AS1A10_053T40_9000004542_31342cztM0_level2_quad_clean.evt |
| Size (bytes) | 310,852,800 | 47,183,040 |
| Size | 296.5 MB | 45.0 MB |
| Events in quadrant A | 1,888,601 | 300,140 |
| Events in quadrant B | 3,004,685 | 294,375 |
| Events in quadrant C | 2,175,574 | 281,430 |
| Events in quadrant D | 2,089,955 | 287,663 |
| Mode M0 | |||
|---|---|---|---|
| Quadrant | BADHDUFLAG | Total packets | Discarded packets |
| A | 0 | 7895 | 2 |
| B | 0 | 11619 | 1 |
| C | 0 | 8724 | 1 |
| D | 0 | 8650 | 1 |
| Mode SS | |||
|---|---|---|---|
| Quadrant | BADHDUFLAG | Total packets | Discarded packets |
| A | 0 | 78 | 0 |
| B | 0 | 78 | 0 |
| C | 0 | 78 | 0 |
| D | 0 | 78 | 0 |
| Mode M9 | |||
|---|---|---|---|
| Quadrant | BADHDUFLAG | Total packets | Discarded packets |
| A | 0 | 4 | 0 |
| B | 0 | 4 | 0 |
| C | 0 | 4 | 0 |
| D | 0 | 4 | 0 |
| Quadrant | Total seconds | Saturated seconds | Saturation percentage |
|---|---|---|---|
| A | 3738 | 115 | 3.076512% |
| B | 3738 | 191 | 5.109684% |
| C | 3738 | 282 | 7.544141% |
| D | 3738 | 94 | 2.514714% |
Noise dominated data is calculated using 1-second bins in cleaned event files. If a bin has >2000 counts, and if more than 50% of those come from <1% of pixels, then it is considered to be noise-dominated and hence unusable.
| Quadrant | # 1 sec bins | Bins with >0 counts | Bins with >2000 counts | High rate bins dominated by noise | Noise dominated (total time) | Noise dominated (detector-on time) | Marked lightcurve |
|---|---|---|---|---|---|---|---|
| A | 4168 | 3739 | 0 | 0 | 0.00% | 0.00% | 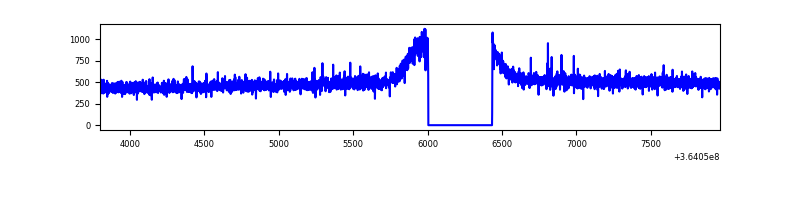 |
| B | 4168 | 3739 | 6 | 6 | 0.14% | 0.16% | 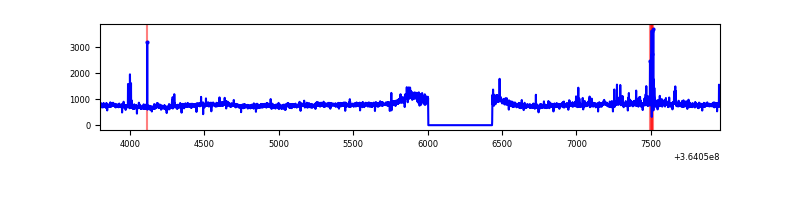 |
| C | 4168 | 3739 | 17 | 17 | 0.41% | 0.45% | 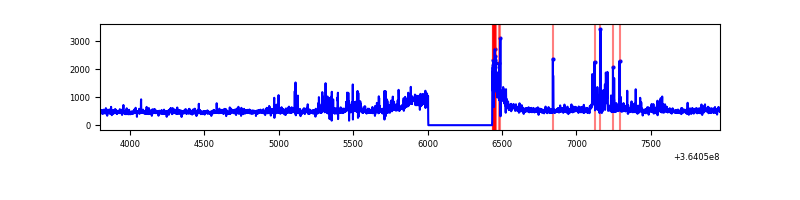 |
| D | 4168 | 3739 | 3 | 3 | 0.07% | 0.08% | 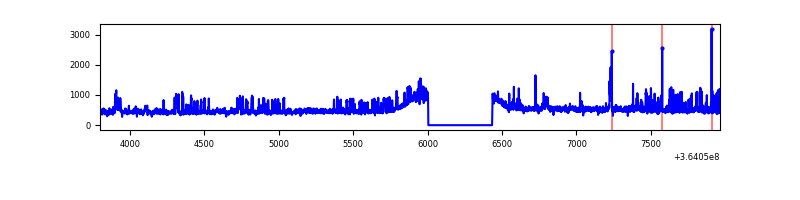 |
Top three noisy pixels from each quadrant. If the there are fewer than three noisy pixels in the level2.evt file, extra rows are filled as -1
| Pixel properties | Quadrant properties | ||||||
|---|---|---|---|---|---|---|---|
| Quadrant | DetID | PixID | Counts | Sigma | Mean | Median | Sigma |
| A | 13 | 254 | 6754 | 62.83 | 489 | 479 | 99.9 |
| A | 3 | 137 | 5011 | 45.38 | 489 | 479 | 99.9 |
| A | 0 | 226 | 4221 | 37.47 | 489 | 479 | 99.9 |
| B | 6 | 159 | 1028731 | 10792.99 | 475 | 463 | 95.3 |
| B | 0 | 190 | 41857 | 434.48 | 475 | 463 | 95.3 |
| B | 5 | 172 | 21475 | 220.55 | 475 | 463 | 95.3 |
| C | 3 | 233 | 119621 | 1095.4 | 454 | 455 | 108.8 |
| C | 14 | 238 | 109076 | 998.47 | 454 | 455 | 108.8 |
| C | 0 | 10 | 85272 | 779.66 | 454 | 455 | 108.8 |
| D | 8 | 195 | 234369 | 2056.71 | 471 | 458 | 113.7 |
| D | 12 | 79 | 39464 | 342.97 | 471 | 458 | 113.7 |
| D | 2 | 234 | 15261 | 130.16 | 471 | 458 | 113.7 |
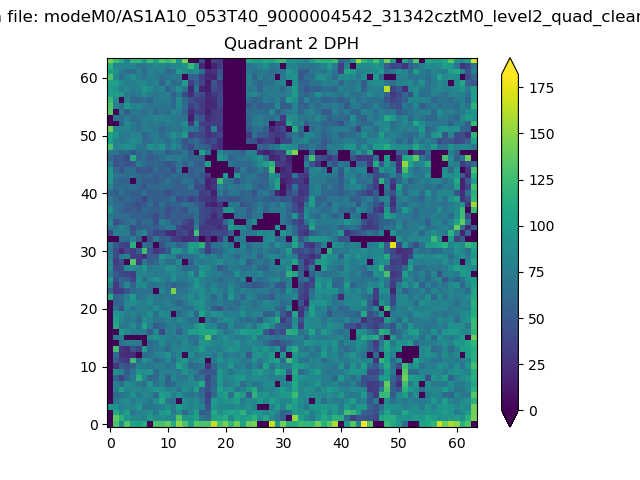
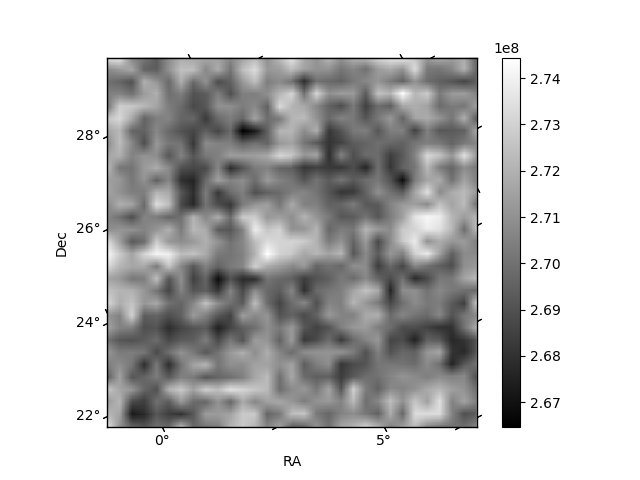
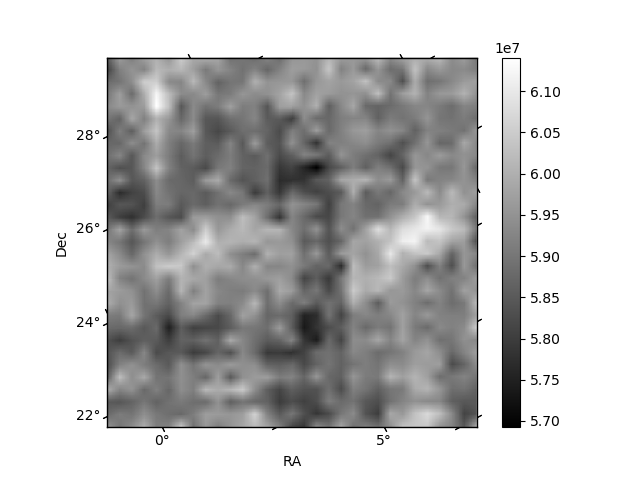
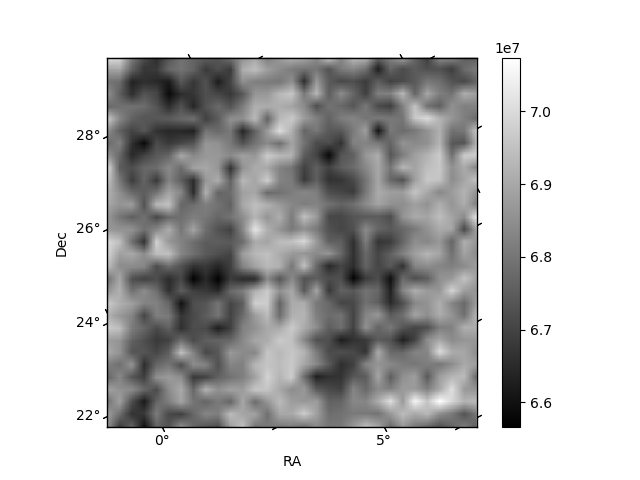
Histogram calculated using DETX and DETY for each event in the final _common_clean file
| Quadrant A | 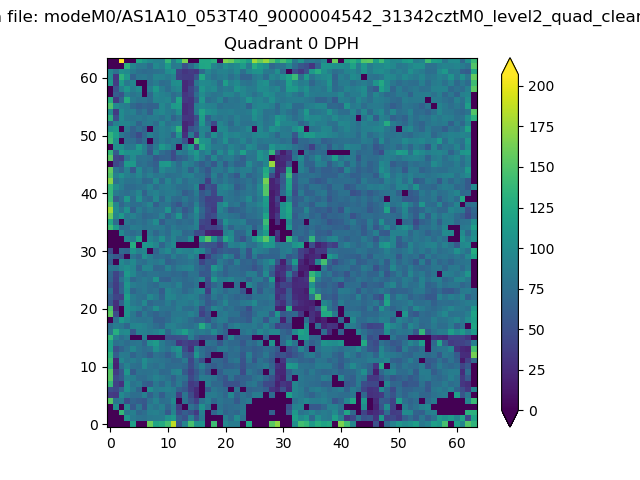 |
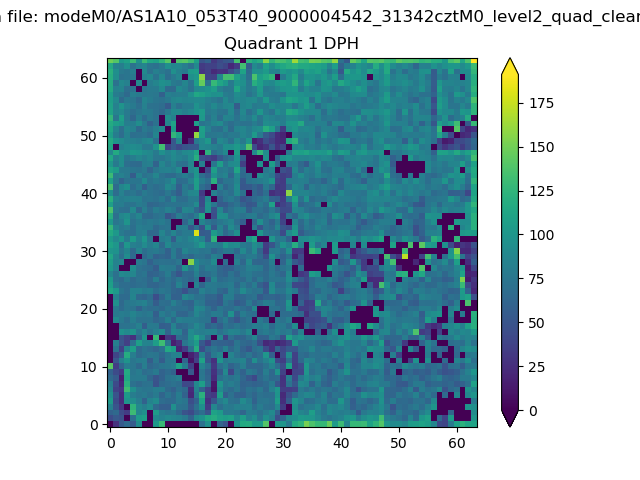 |
Quadrant B |
|---|---|---|---|
| Quadrant D | 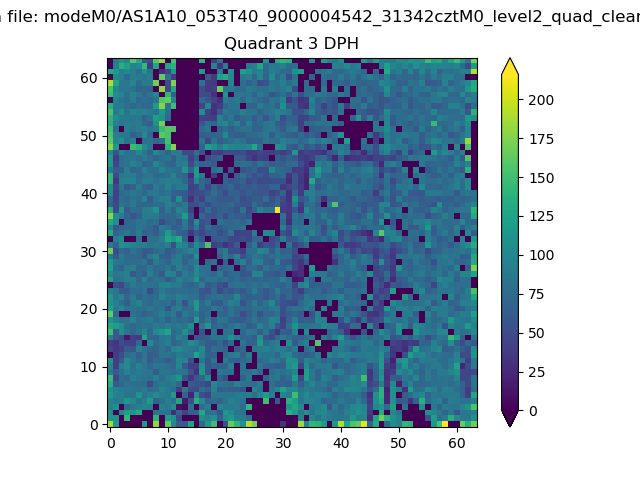 |
 |
Quadrant C |
| Plot type | Count rate plots | Images |
|---|---|---|
| Comparison with Poisson distribution Blue bars denote a histogram of data divided into 1 sec bins. Red curve is a Poisson curve with rate = median count rate of data. |
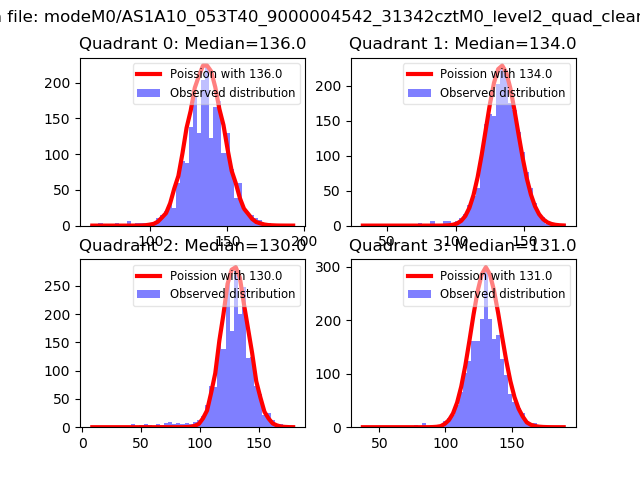 |
 |
| Quadrant-wise count rates Data is divided into 100 sec bins |
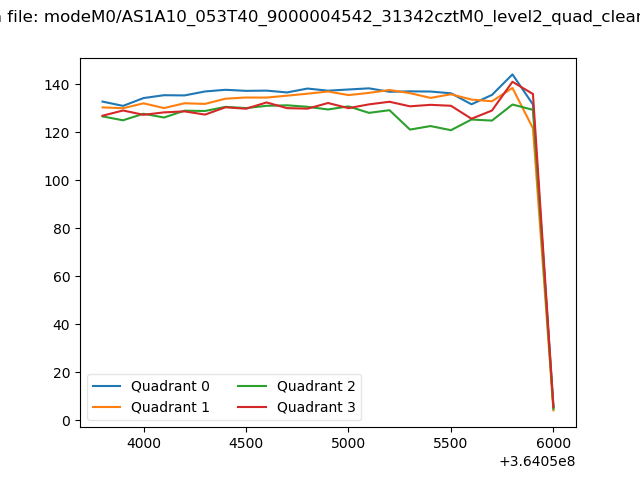 |
|
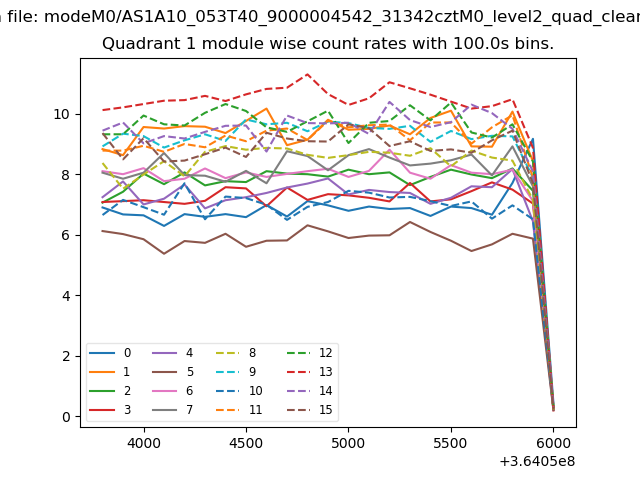
| Module-wise count rates for Quadrant A Data is divided into 100 sec bins |
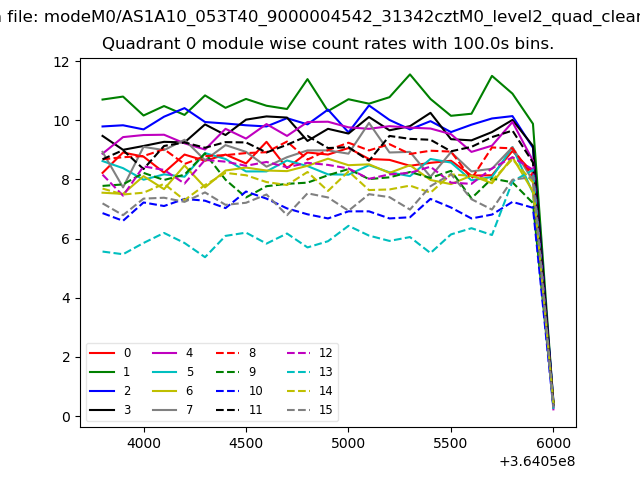 |
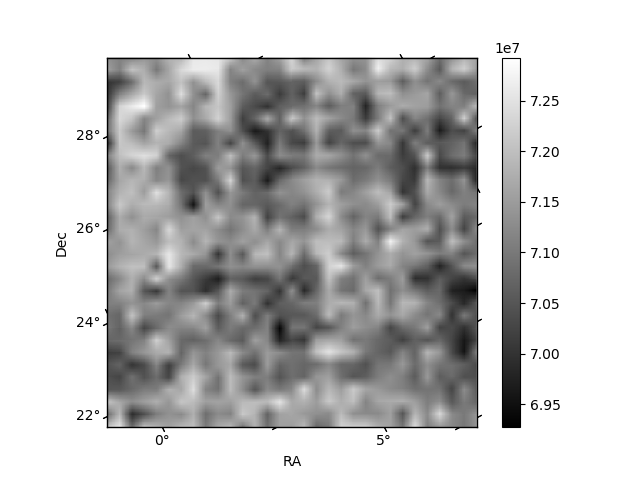 |
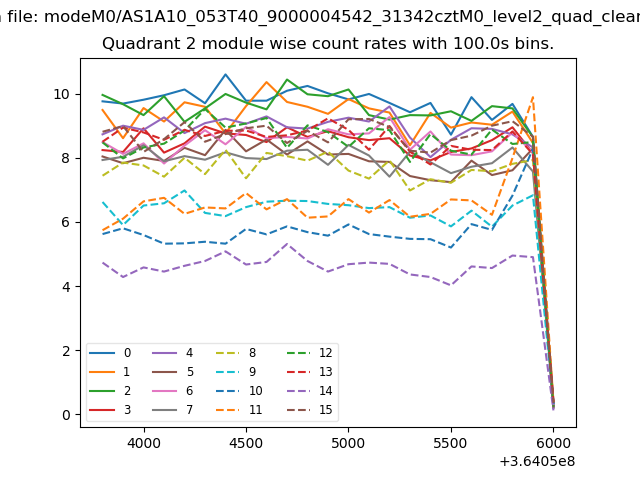
| Module-wise count rates for Quadrant B Data is divided into 100 sec bins |
 |
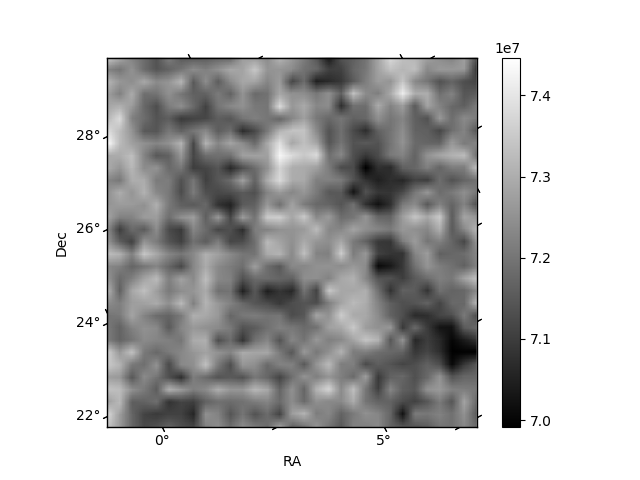 |
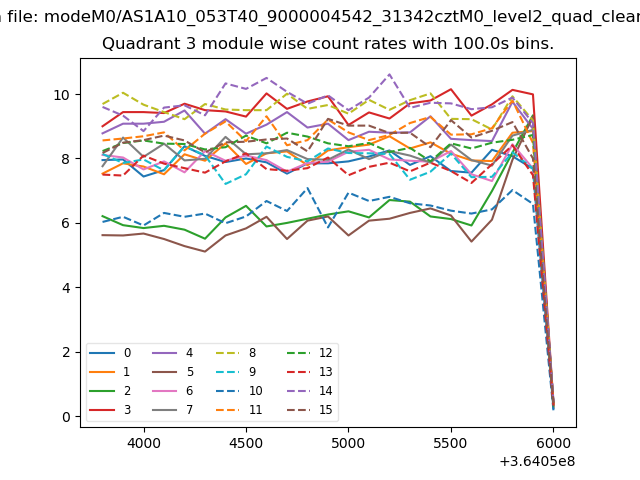
| Module-wise count rates for Quadrant C Data is divided into 100 sec bins |
 |
 |
| Module-wise count rates for Quadrant D Data is divided into 100 sec bins |
 |
 |
| Parameter | Plot |
|---|---|
| CZT HV Monitor | 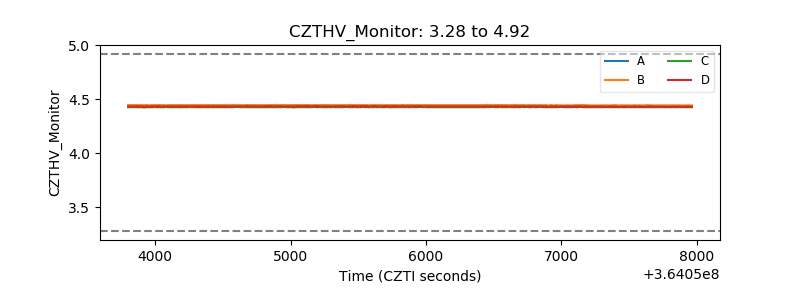 |
| D_VDD | 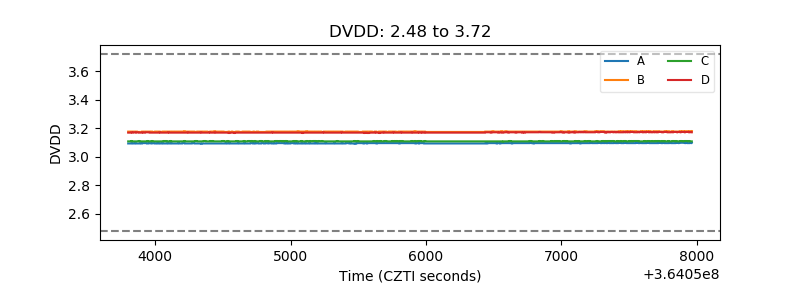 |
| Temperature 1 | 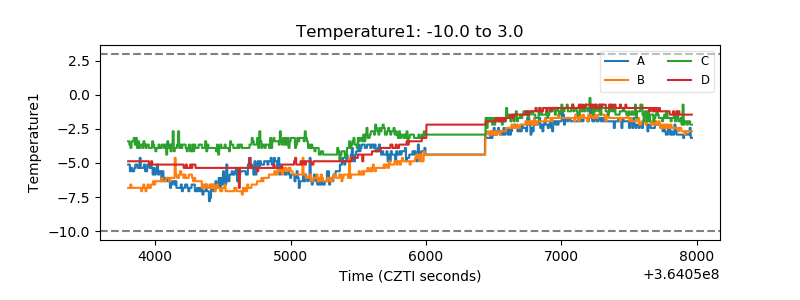 |
| Veto HV Monitor | 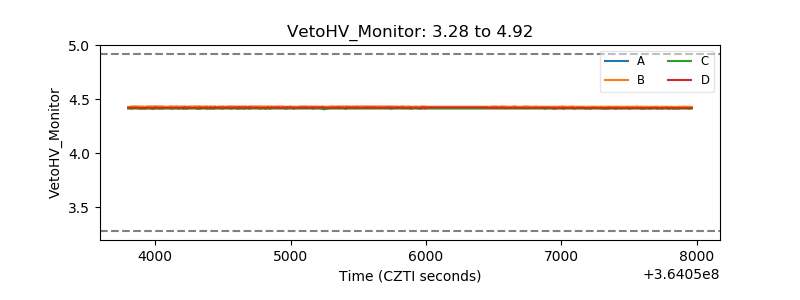 |
| Veto LLD | 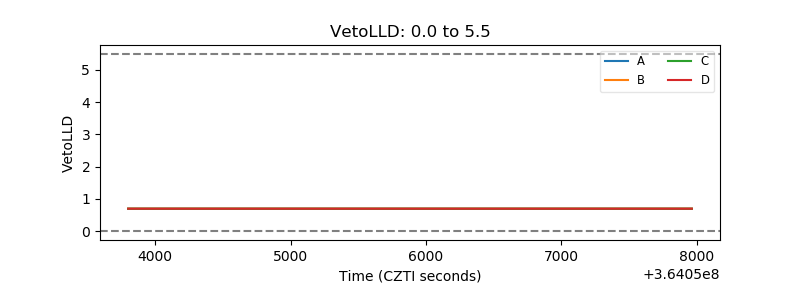 |
| Alpha Counter | 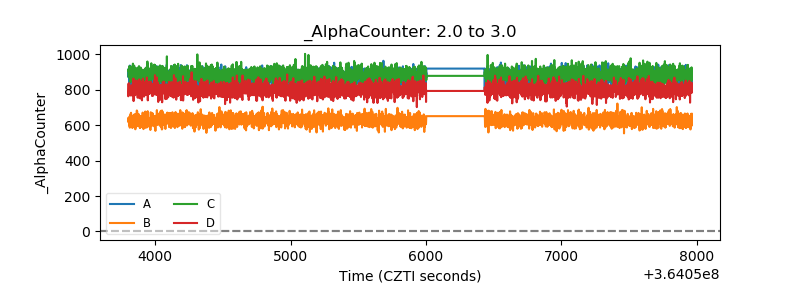 |
| _CPM_Rate | 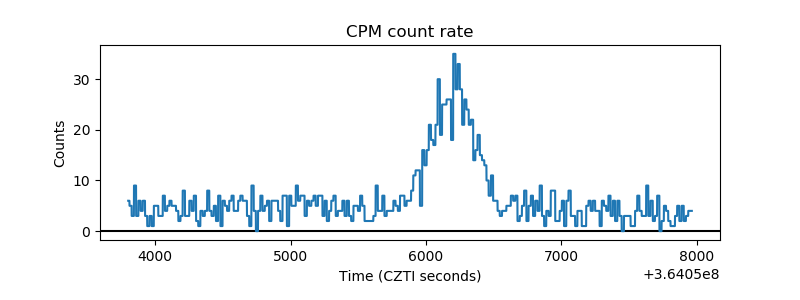 |
| CZT Counter | 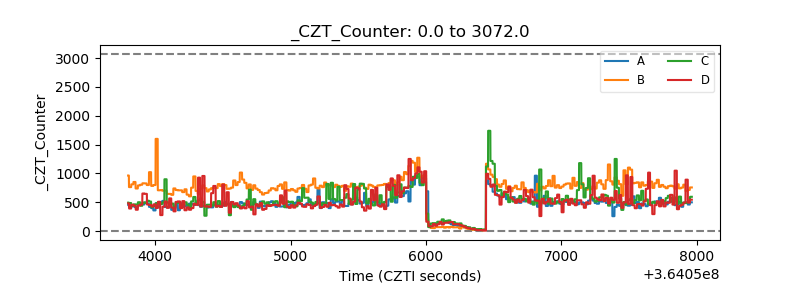 |
| +2.5 Volts monitor |  |
| +5 Volts monitor | 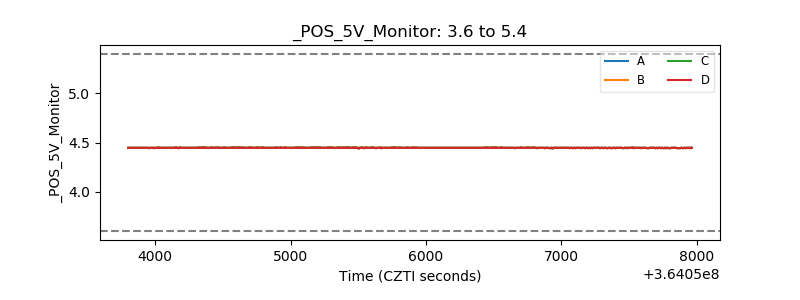 |
| _ROLL_ROT | 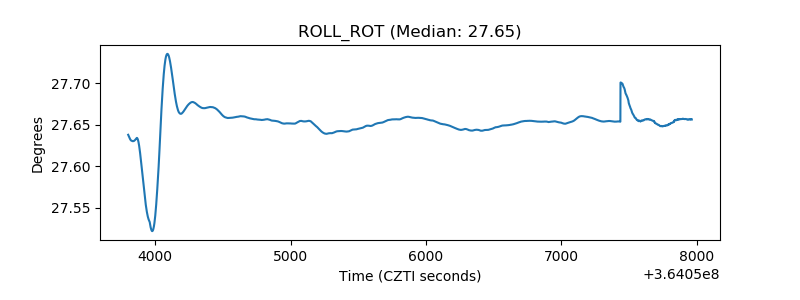 |
| _Roll_DEC | 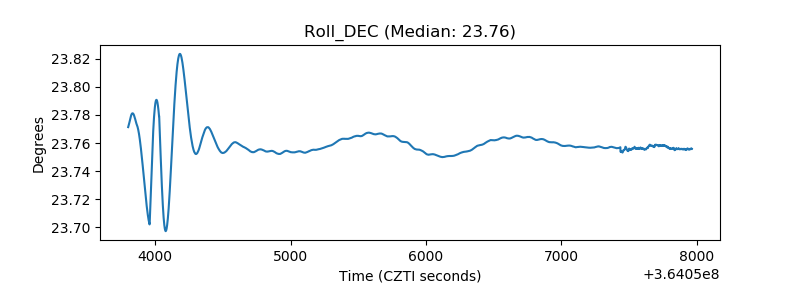 |
| _Roll_RA | 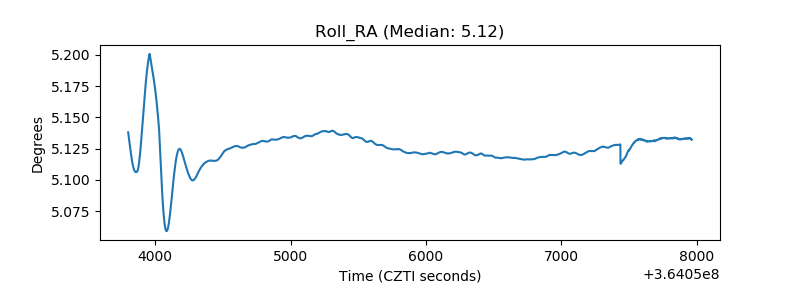 |
| Veto Counter | 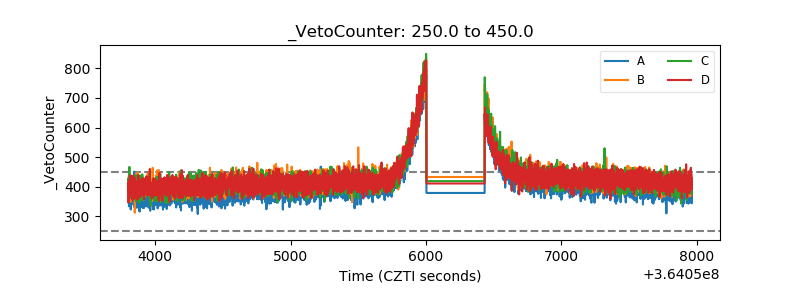 |