| Param | Original file | Final file |
|---|---|---|
| Filename | modeM0/AS1A10_053T40_9000004542_31343cztM0_level2.evt | modeM0/AS1A10_053T40_9000004542_31343cztM0_level2_quad_clean.evt |
| Size (bytes) | 637,361,280 | 79,165,440 |
| Size | 607.8 MB | 75.5 MB |
| Events in quadrant A | 3,825,177 | 476,898 |
| Events in quadrant B | 6,155,978 | 471,342 |
| Events in quadrant C | 4,310,325 | 452,888 |
| Events in quadrant D | 4,485,118 | 455,888 |
| Mode M0 | |||
|---|---|---|---|
| Quadrant | BADHDUFLAG | Total packets | Discarded packets |
| A | 0 | 16199 | 2 |
| B | 0 | 23887 | 2 |
| C | 0 | 17482 | 2 |
| D | 0 | 18435 | 3 |
| Mode SS | |||
|---|---|---|---|
| Quadrant | BADHDUFLAG | Total packets | Discarded packets |
| A | 0 | 160 | 0 |
| B | 0 | 160 | 0 |
| C | 0 | 160 | 0 |
| D | 0 | 160 | 0 |
| Mode M9 | |||
|---|---|---|---|
| Quadrant | BADHDUFLAG | Total packets | Discarded packets |
| A | 0 | 4 | 0 |
| B | 0 | 5 | 0 |
| C | 0 | 5 | 0 |
| D | 0 | 5 | 0 |
| Quadrant | Total seconds | Saturated seconds | Saturation percentage |
|---|---|---|---|
| A | 7764 | 213 | 2.743431% |
| B | 7764 | 335 | 4.314786% |
| C | 7764 | 424 | 5.461103% |
| D | 7763 | 178 | 2.292928% |
Noise dominated data is calculated using 1-second bins in cleaned event files. If a bin has >2000 counts, and if more than 50% of those come from <1% of pixels, then it is considered to be noise-dominated and hence unusable.
| Quadrant | # 1 sec bins | Bins with >0 counts | Bins with >2000 counts | High rate bins dominated by noise | Noise dominated (total time) | Noise dominated (detector-on time) | Marked lightcurve |
|---|---|---|---|---|---|---|---|
| A | 7844 | 7766 | 0 | 0 | 0.00% | 0.00% | 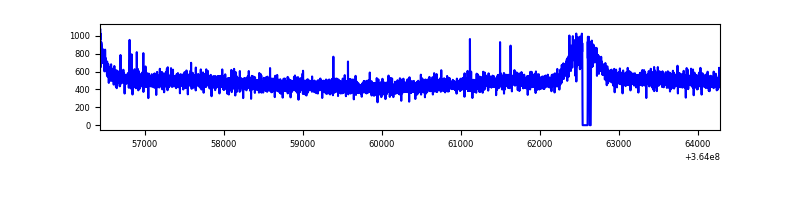 |
| B | 7844 | 7766 | 13 | 13 | 0.17% | 0.17% | 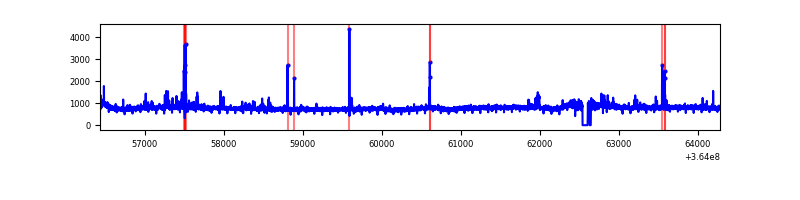 |
| C | 7844 | 7766 | 27 | 27 | 0.34% | 0.35% | 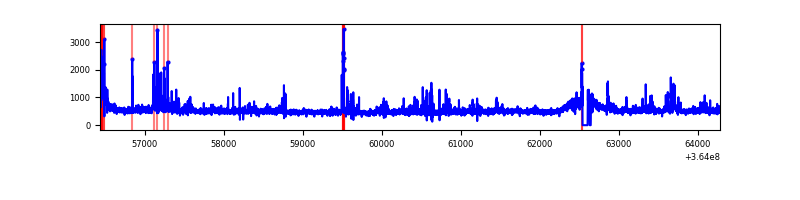 |
| D | 7843 | 7765 | 11 | 11 | 0.14% | 0.14% | 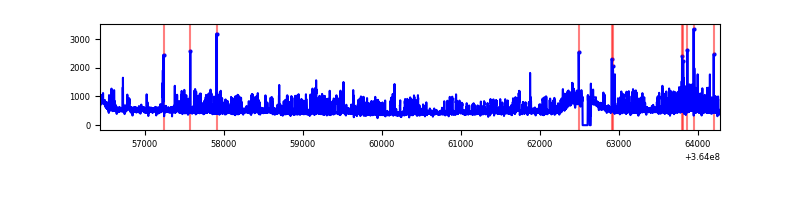 |
Top three noisy pixels from each quadrant. If the there are fewer than three noisy pixels in the level2.evt file, extra rows are filled as -1
| Pixel properties | Quadrant properties | ||||||
|---|---|---|---|---|---|---|---|
| Quadrant | DetID | PixID | Counts | Sigma | Mean | Median | Sigma |
| A | 13 | 254 | 14659 | 68.34 | 991 | 968 | 200.3 |
| A | 3 | 137 | 10271 | 46.44 | 991 | 968 | 200.3 |
| A | 0 | 226 | 8402 | 37.11 | 991 | 968 | 200.3 |
| B | 6 | 159 | 2161698 | 11533.81 | 966 | 940 | 187.3 |
| B | 0 | 190 | 76568 | 403.69 | 966 | 940 | 187.3 |
| B | 5 | 172 | 40127 | 209.17 | 966 | 940 | 187.3 |
| C | 3 | 233 | 235420 | 1079.86 | 926 | 931 | 217.1 |
| C | 14 | 238 | 185835 | 851.51 | 926 | 931 | 217.1 |
| C | 0 | 10 | 161808 | 740.86 | 926 | 931 | 217.1 |
| D | 8 | 195 | 653655 | 2862.28 | 957 | 930 | 228.0 |
| D | 13 | 249 | 62143 | 268.43 | 957 | 930 | 228.0 |
| D | 12 | 233 | 42008 | 180.13 | 957 | 930 | 228.0 |
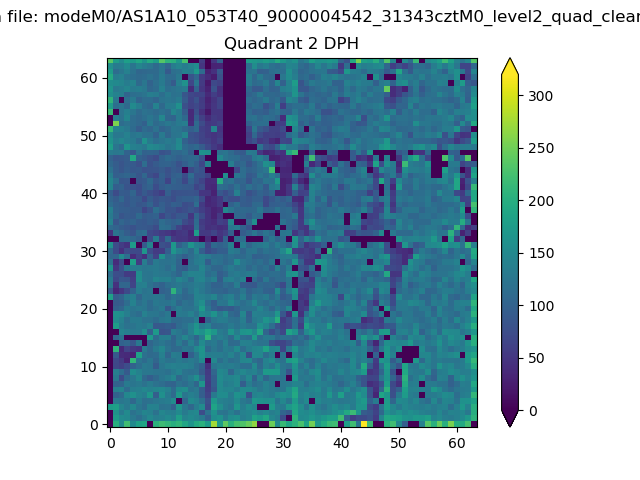
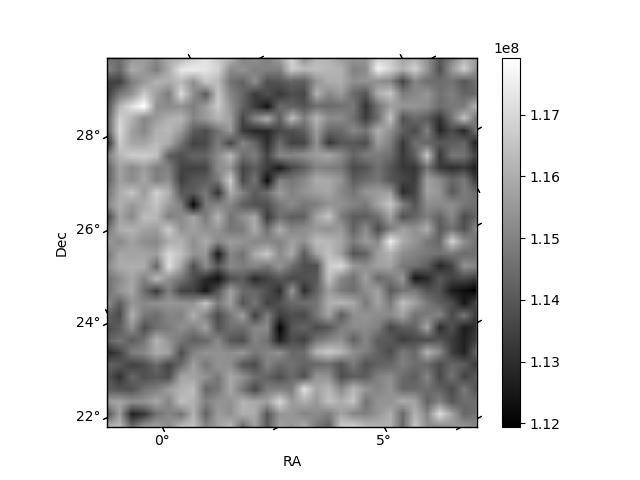
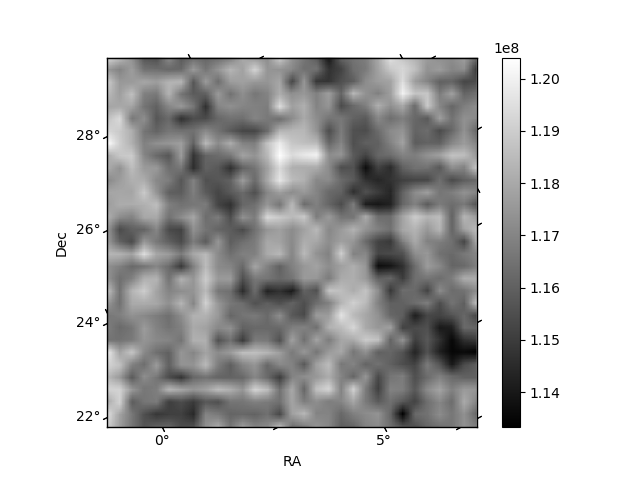
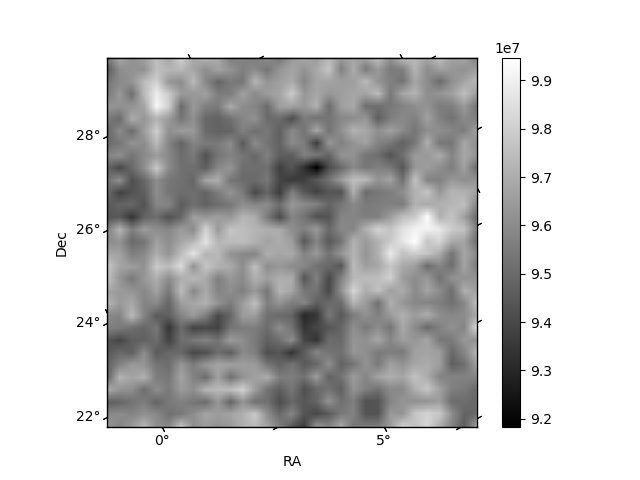
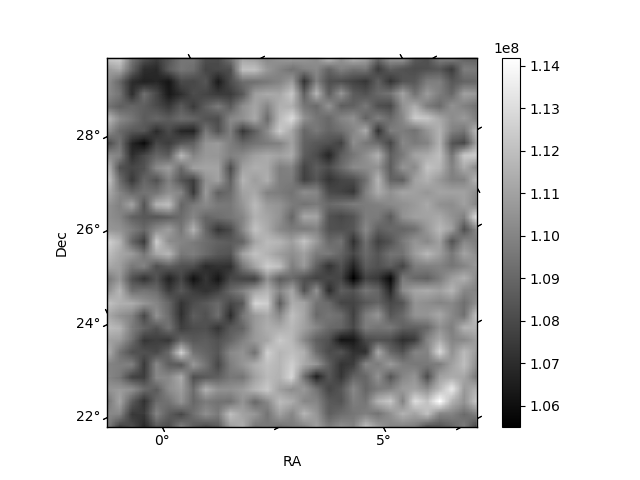
Histogram calculated using DETX and DETY for each event in the final _common_clean file
| Quadrant A |  |
 |
Quadrant B |
|---|---|---|---|
| Quadrant D | 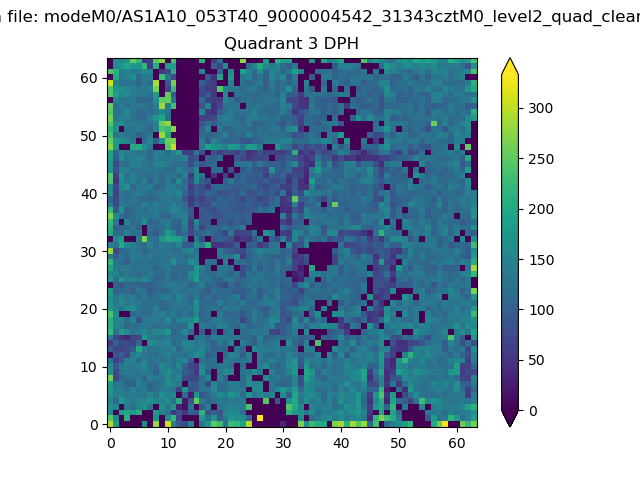 |
 |
Quadrant C |
| Plot type | Count rate plots | Images |
|---|---|---|
| Comparison with Poisson distribution Blue bars denote a histogram of data divided into 1 sec bins. Red curve is a Poisson curve with rate = median count rate of data. |
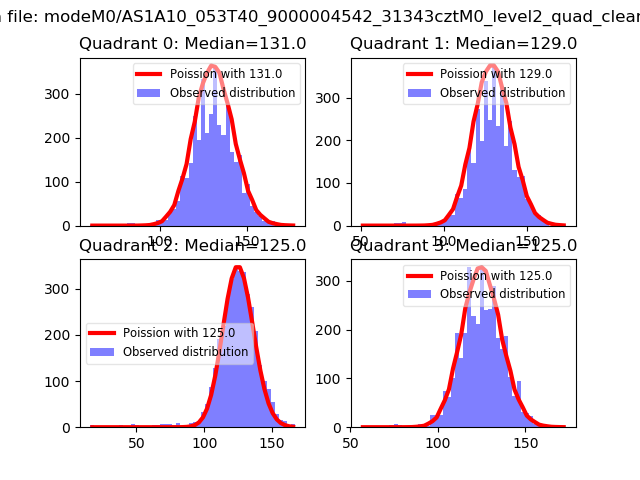 |
 |
| Quadrant-wise count rates Data is divided into 100 sec bins |
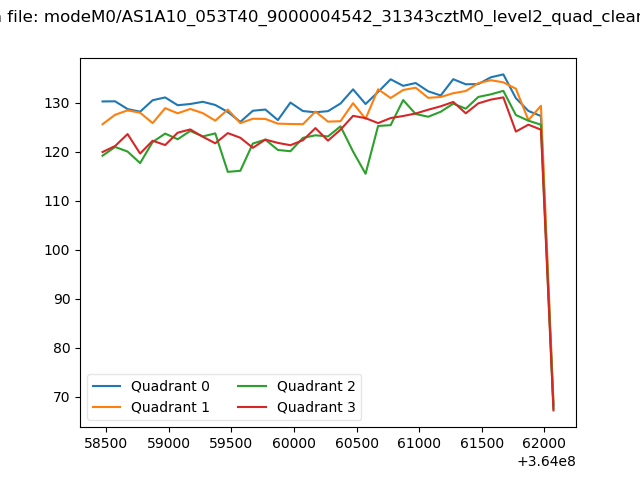 |
|
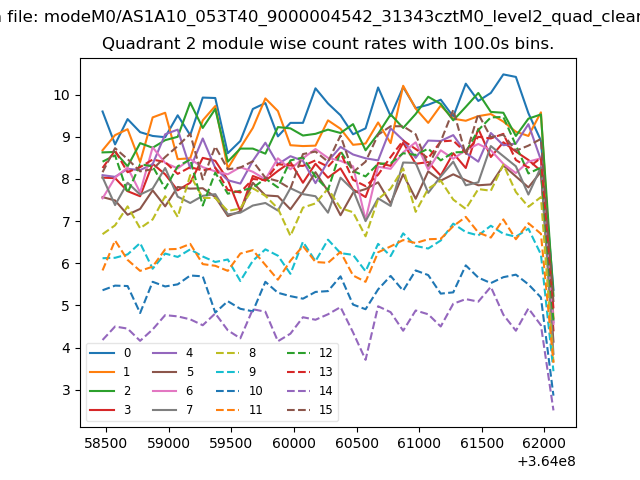
| Module-wise count rates for Quadrant A Data is divided into 100 sec bins |
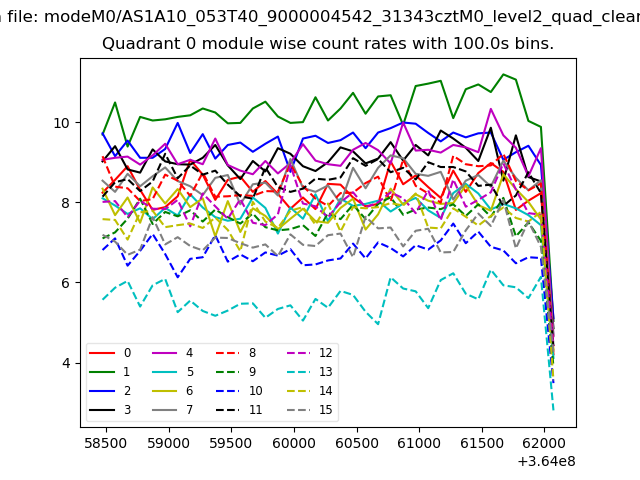 |
 |
| Module-wise count rates for Quadrant B Data is divided into 100 sec bins |
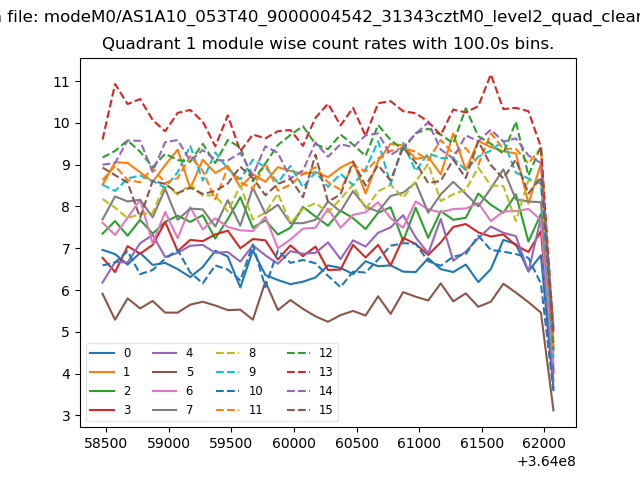 |
 |
| Module-wise count rates for Quadrant C Data is divided into 100 sec bins |
 |
 |
| Module-wise count rates for Quadrant D Data is divided into 100 sec bins |
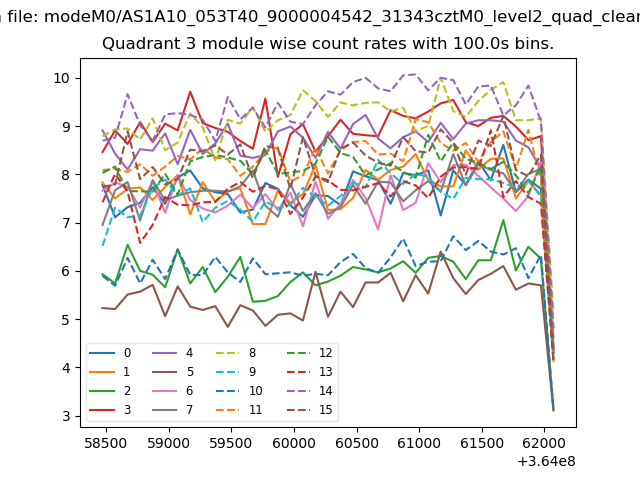 |
 |
| Parameter | Plot |
|---|---|
| CZT HV Monitor | 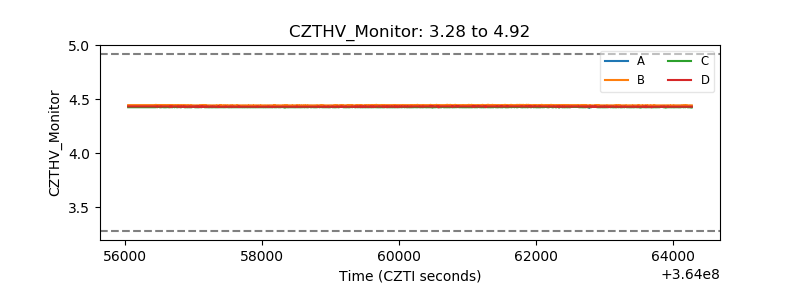 |
| D_VDD | 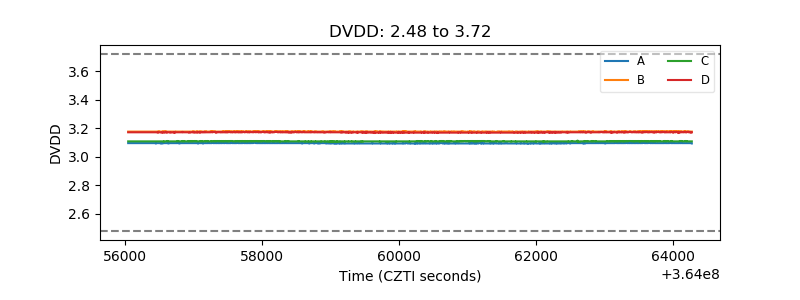 |
| Temperature 1 | 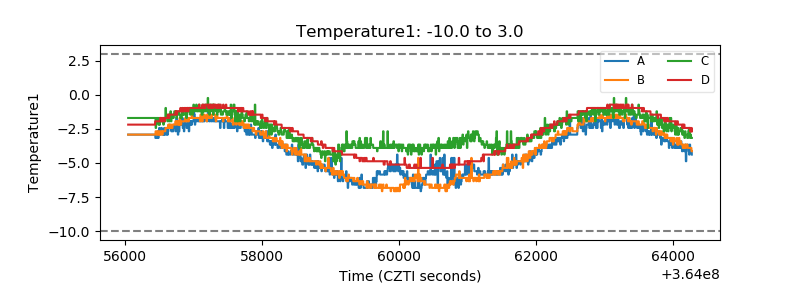 |
| Veto HV Monitor | 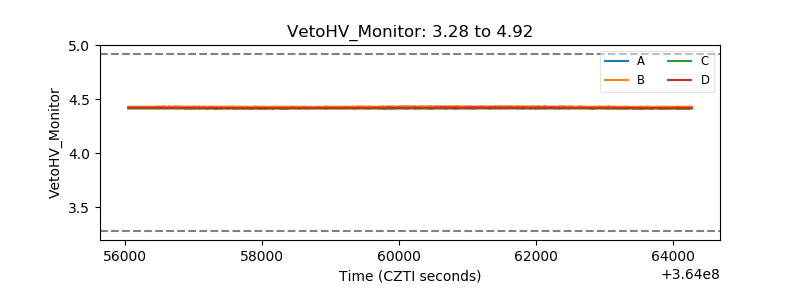 |
| Veto LLD | 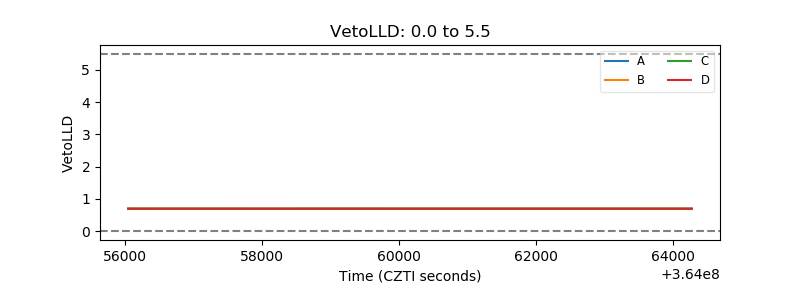 |
| Alpha Counter | 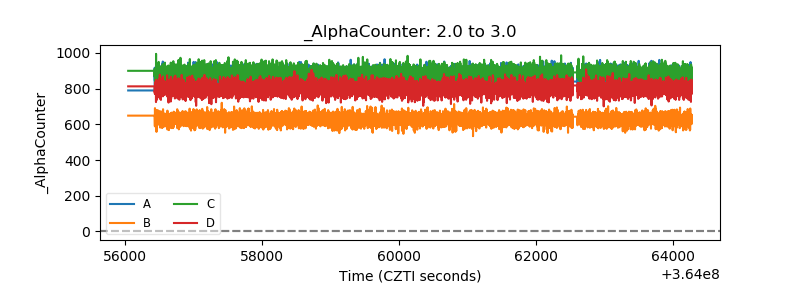 |
| _CPM_Rate | 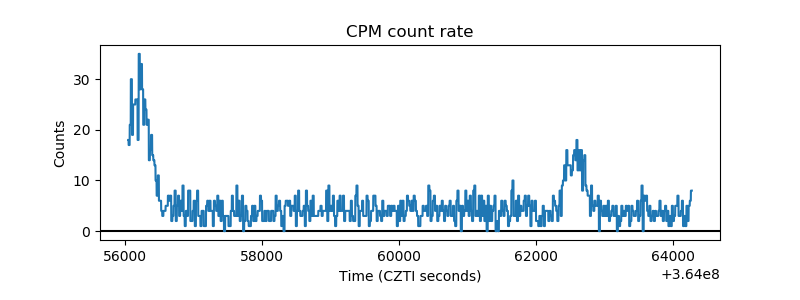 |
| CZT Counter | 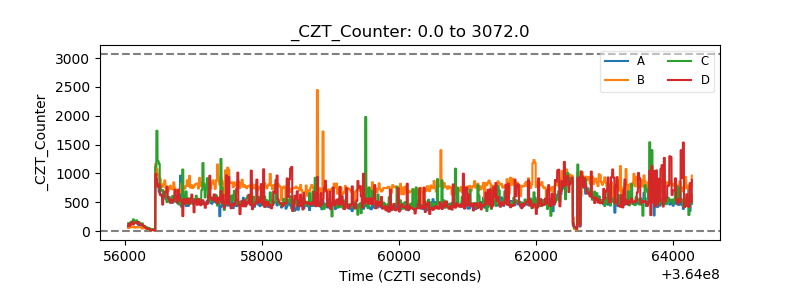 |
| +2.5 Volts monitor |  |
| +5 Volts monitor | 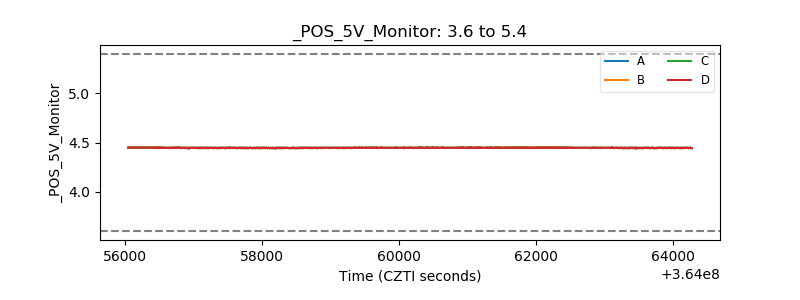 |
| _ROLL_ROT | 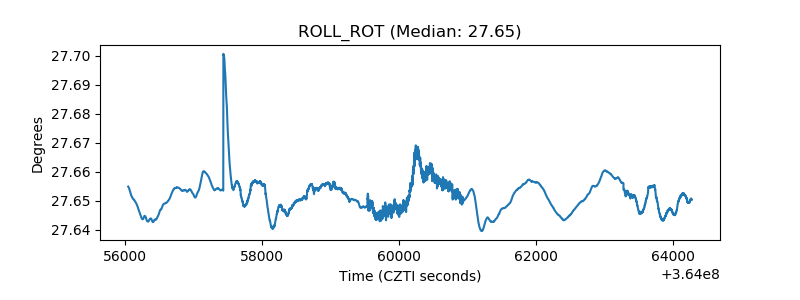 |
| _Roll_DEC | 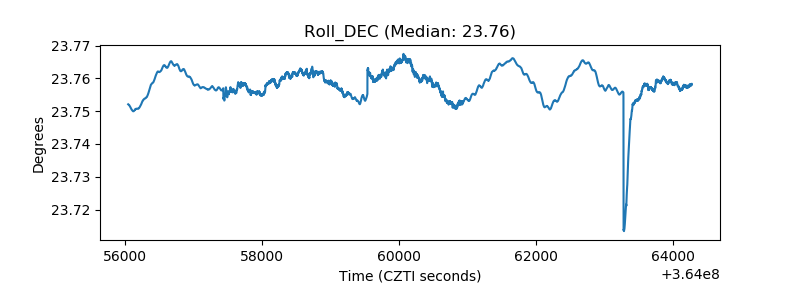 |
| _Roll_RA | 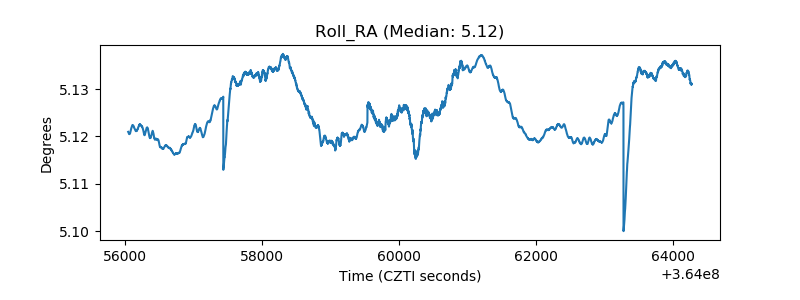 |
| Veto Counter | 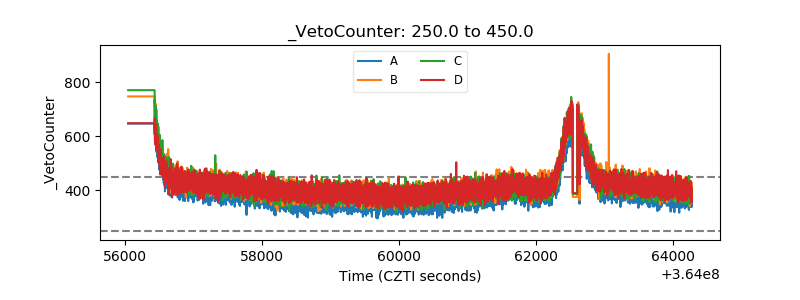 |