| Param | Original file | Final file |
|---|---|---|
| Filename | modeM0/AS1A10_053T40_9000004542_31344cztM0_level2.evt | modeM0/AS1A10_053T40_9000004542_31344cztM0_level2_quad_clean.evt |
| Size (bytes) | 203,869,440 | 31,178,880 |
| Size | 194.4 MB | 29.7 MB |
| Events in quadrant A | 1,193,424 | 195,682 |
| Events in quadrant B | 1,986,973 | 192,121 |
| Events in quadrant C | 1,343,741 | 183,748 |
| Events in quadrant D | 1,470,479 | 184,609 |
| Mode M0 | |||
|---|---|---|---|
| Quadrant | BADHDUFLAG | Total packets | Discarded packets |
| A | 0 | 5247 | 0 |
| B | 0 | 7895 | 0 |
| C | 0 | 5556 | 0 |
| D | 0 | 6097 | 0 |
| Mode SS | |||
|---|---|---|---|
| Quadrant | BADHDUFLAG | Total packets | Discarded packets |
| A | 0 | 54 | 0 |
| B | 0 | 54 | 0 |
| C | 0 | 54 | 0 |
| D | 0 | 54 | 0 |
| Quadrant | Total seconds | Saturated seconds | Saturation percentage |
|---|---|---|---|
| A | 2607 | 3 | 0.115075% |
| B | 2607 | 12 | 0.460299% |
| C | 2607 | 23 | 0.882240% |
| D | 2608 | 9 | 0.345092% |
Noise dominated data is calculated using 1-second bins in cleaned event files. If a bin has >2000 counts, and if more than 50% of those come from <1% of pixels, then it is considered to be noise-dominated and hence unusable.
| Quadrant | # 1 sec bins | Bins with >0 counts | Bins with >2000 counts | High rate bins dominated by noise | Noise dominated (total time) | Noise dominated (detector-on time) | Marked lightcurve |
|---|---|---|---|---|---|---|---|
| A | 2607 | 2607 | 0 | 0 | 0.00% | 0.00% | 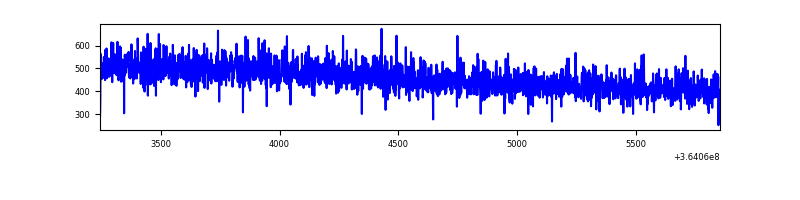 |
| B | 2607 | 2607 | 3 | 3 | 0.12% | 0.12% | 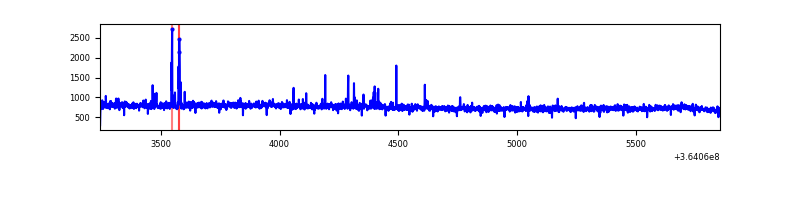 |
| C | 2607 | 2607 | 2 | 2 | 0.08% | 0.08% | 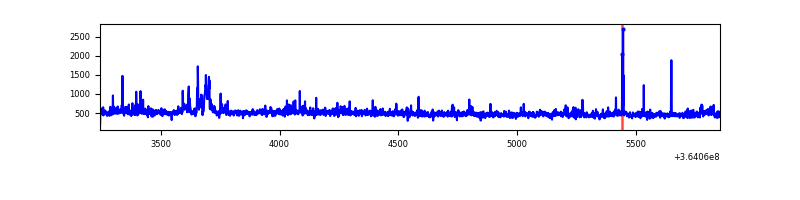 |
| D | 2608 | 2608 | 7 | 7 | 0.27% | 0.27% | 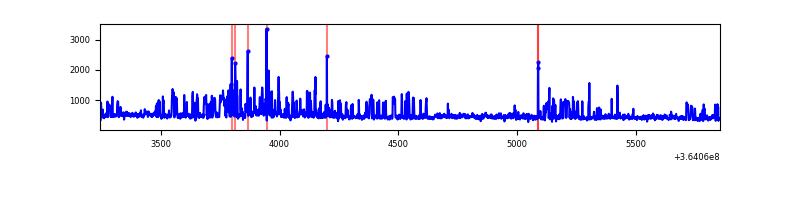 |
Top three noisy pixels from each quadrant. If the there are fewer than three noisy pixels in the level2.evt file, extra rows are filled as -1
| Pixel properties | Quadrant properties | ||||||
|---|---|---|---|---|---|---|---|
| Quadrant | DetID | PixID | Counts | Sigma | Mean | Median | Sigma |
| A | 13 | 254 | 5256 | 77.32 | 308 | 302 | 64.1 |
| A | 3 | 137 | 3132 | 44.17 | 308 | 302 | 64.1 |
| A | 0 | 226 | 2713 | 37.63 | 308 | 302 | 64.1 |
| B | 6 | 159 | 733534 | 12170.3 | 304 | 296 | 60.2 |
| B | 5 | 172 | 18407 | 300.61 | 304 | 296 | 60.2 |
| B | 0 | 190 | 12270 | 198.74 | 304 | 296 | 60.2 |
| C | 3 | 233 | 110636 | 1558.72 | 295 | 296 | 70.8 |
| C | 14 | 238 | 49580 | 696.21 | 295 | 296 | 70.8 |
| C | 0 | 10 | 20197 | 281.13 | 295 | 296 | 70.8 |
| D | 8 | 195 | 252560 | 3390.19 | 299 | 290 | 74.4 |
| D | 13 | 249 | 52373 | 699.93 | 299 | 290 | 74.4 |
| D | 12 | 233 | 21138 | 280.17 | 299 | 290 | 74.4 |
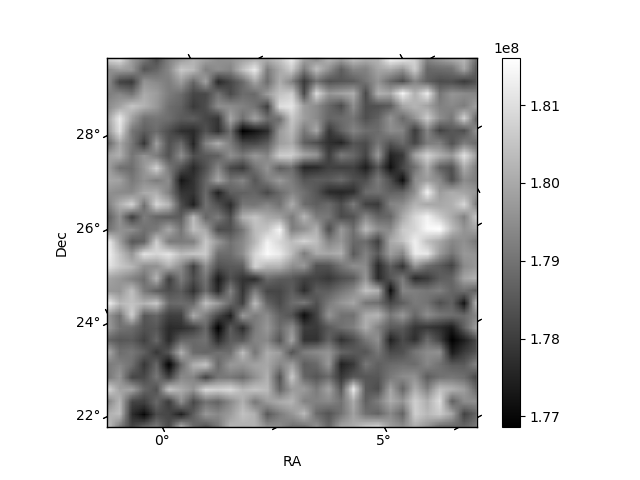
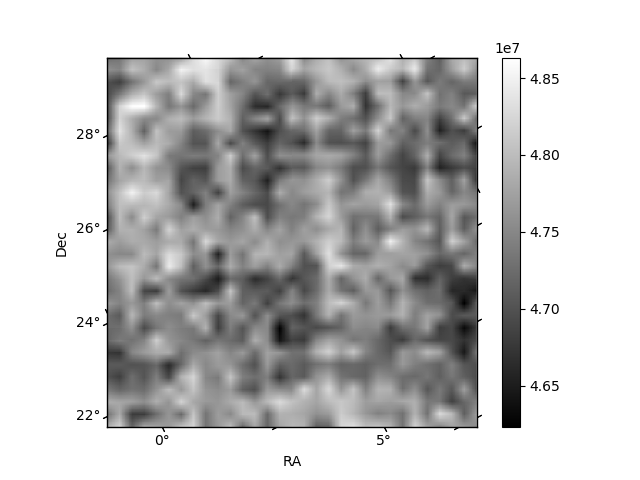
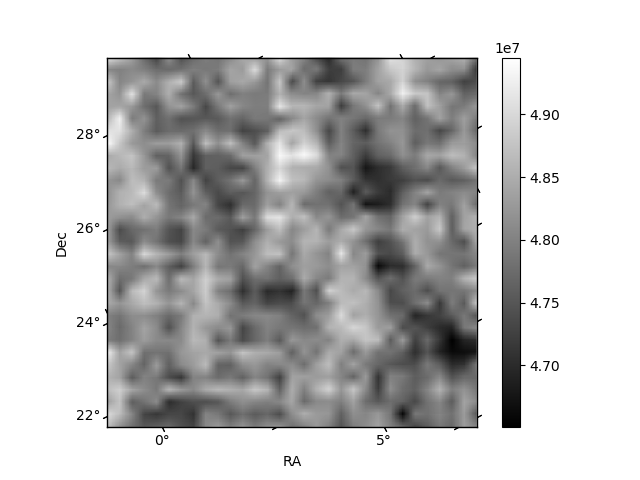
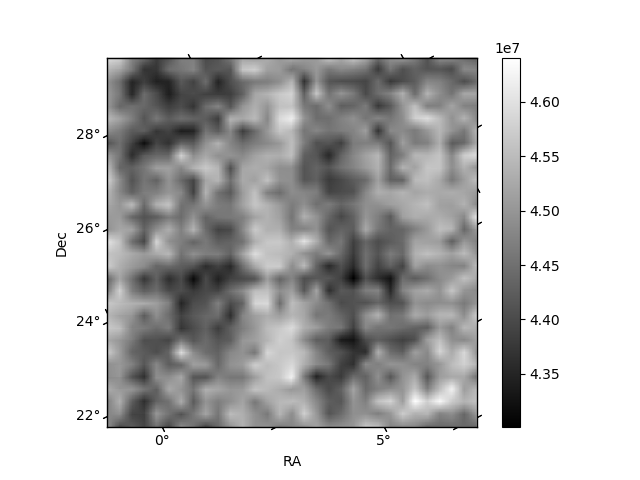
Histogram calculated using DETX and DETY for each event in the final _common_clean file
| Quadrant A | 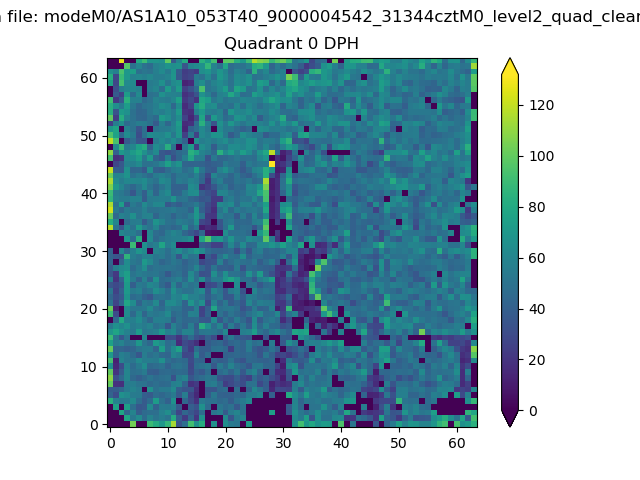 |
 |
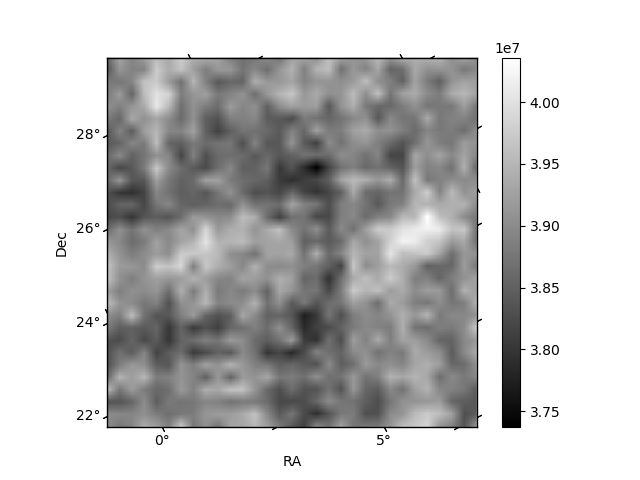
Quadrant B |
|---|---|---|---|
| Quadrant D | 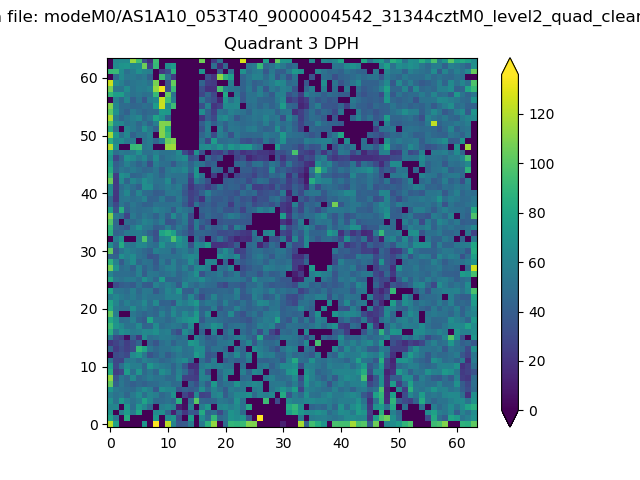 |
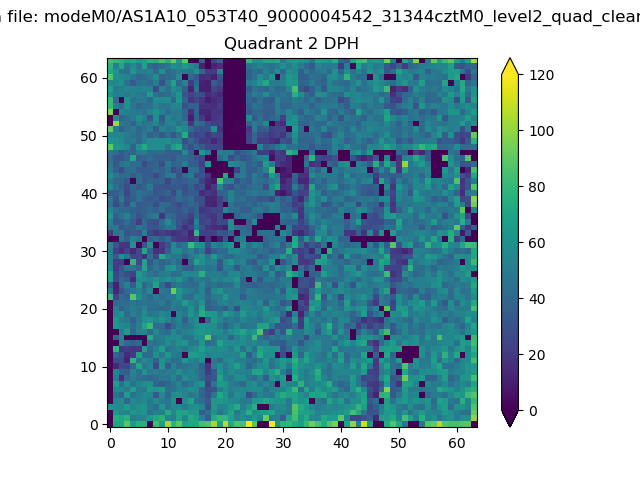 |
Quadrant C |
| Plot type | Count rate plots | Images |
|---|---|---|
| Comparison with Poisson distribution Blue bars denote a histogram of data divided into 1 sec bins. Red curve is a Poisson curve with rate = median count rate of data. |
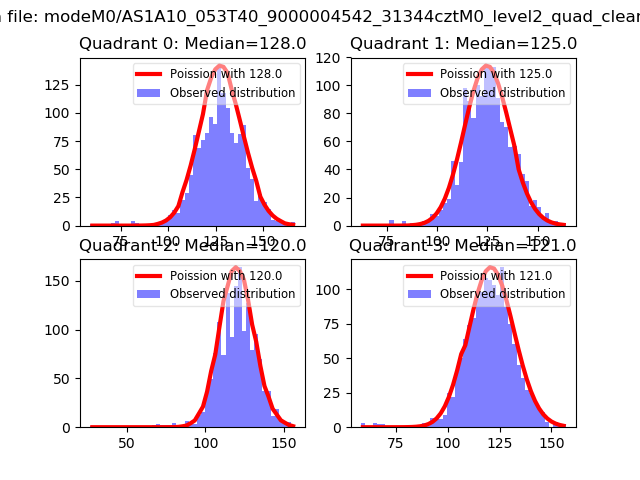 |
 |
| Quadrant-wise count rates Data is divided into 100 sec bins |
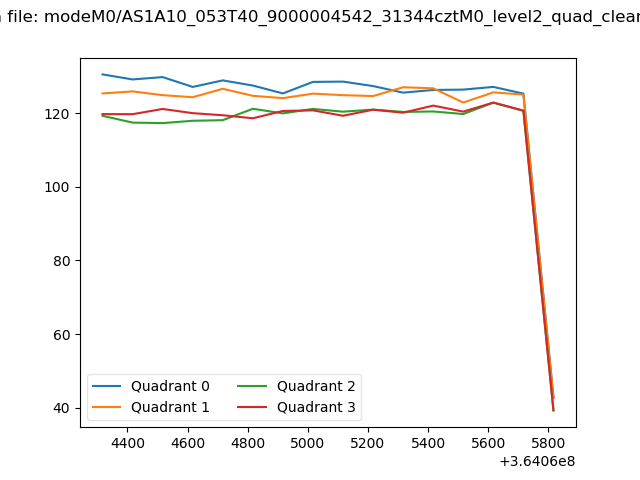 |
|
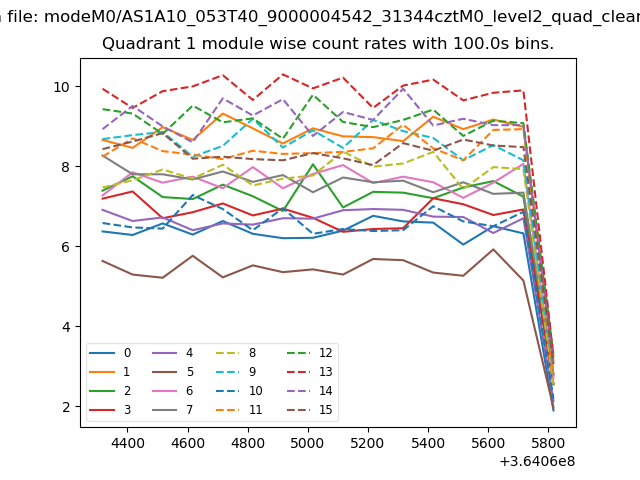
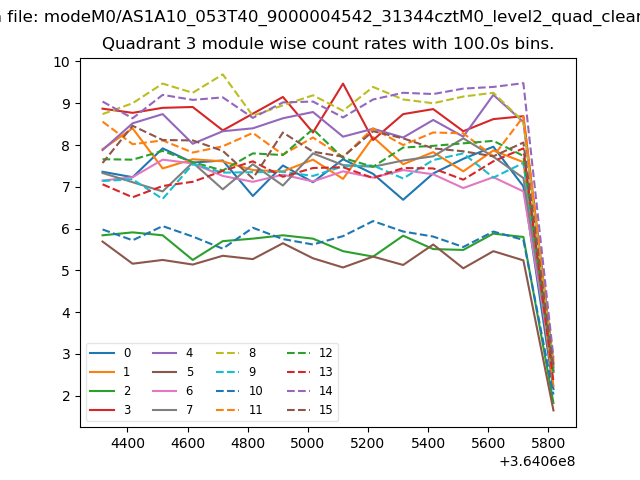
| Module-wise count rates for Quadrant A Data is divided into 100 sec bins |
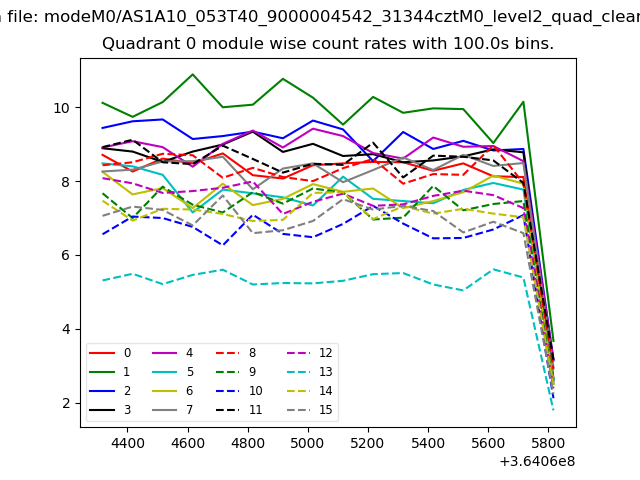 |
 |
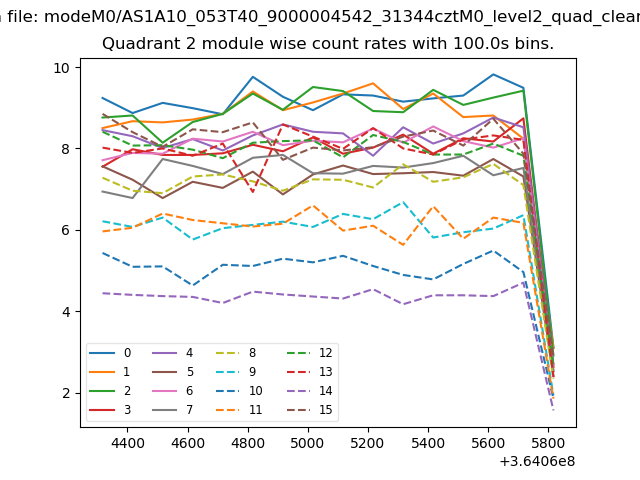
| Module-wise count rates for Quadrant B Data is divided into 100 sec bins |
 |
 |
| Module-wise count rates for Quadrant C Data is divided into 100 sec bins |
 |
 |
| Module-wise count rates for Quadrant D Data is divided into 100 sec bins |
 |
 |
| Parameter | Plot |
|---|---|
| CZT HV Monitor | 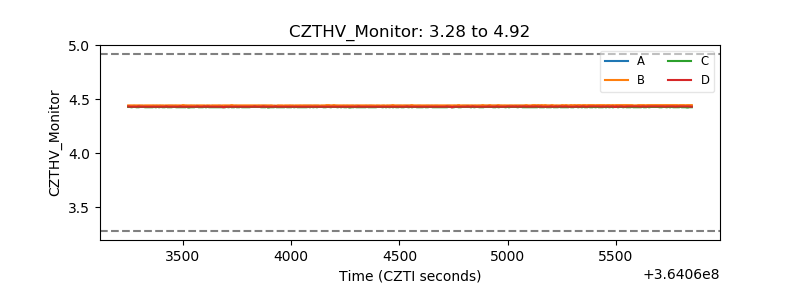 |
| D_VDD |  |
| Temperature 1 | 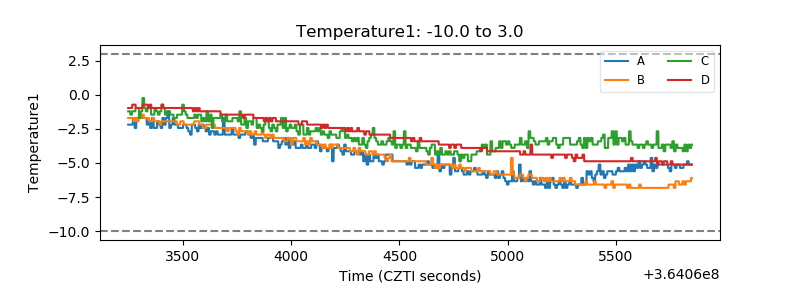 |
| Veto HV Monitor | 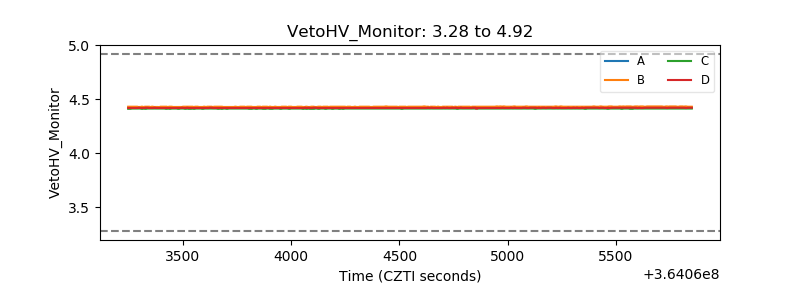 |
| Veto LLD | 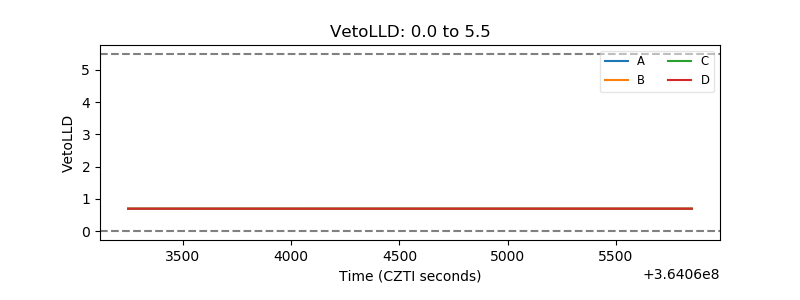 |
| Alpha Counter | 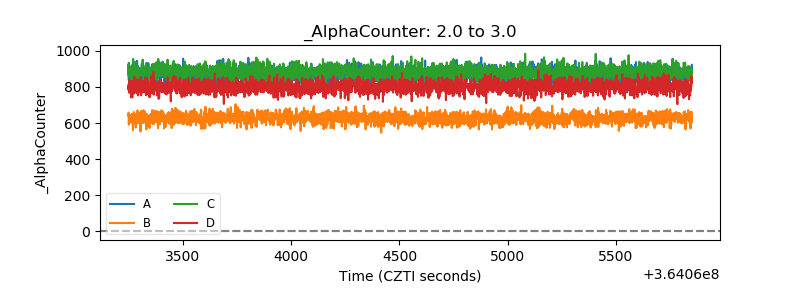 |
| _CPM_Rate | 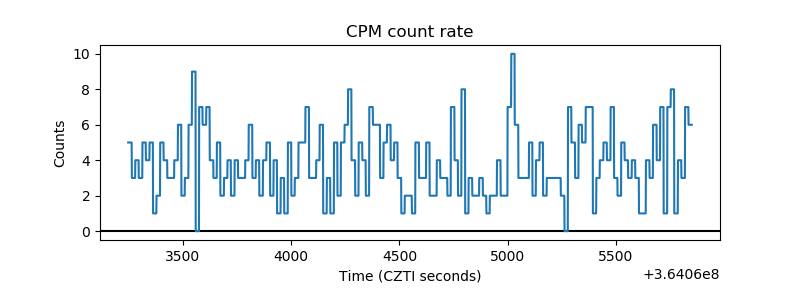 |
| CZT Counter | 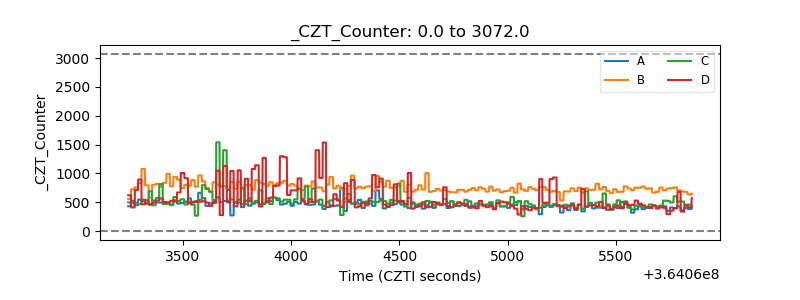 |
| +2.5 Volts monitor |  |
| +5 Volts monitor | 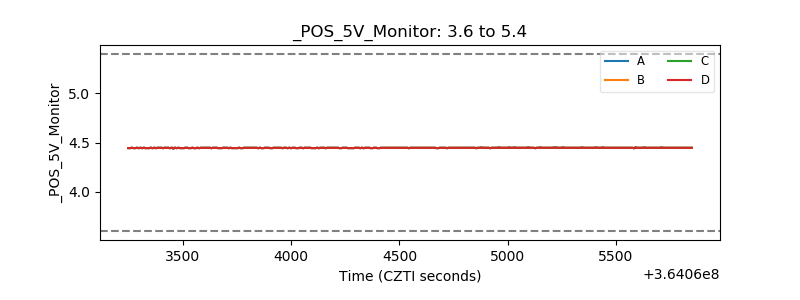 |
| _ROLL_ROT | 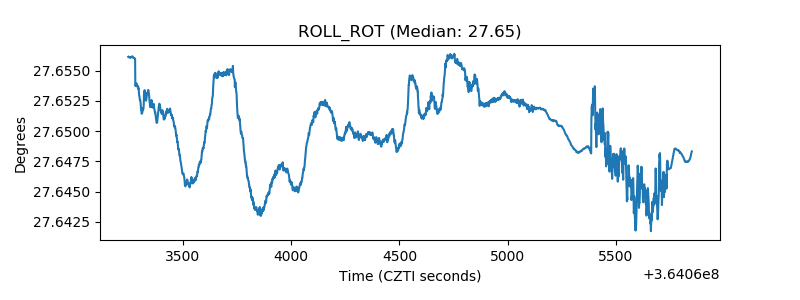 |
| _Roll_DEC | 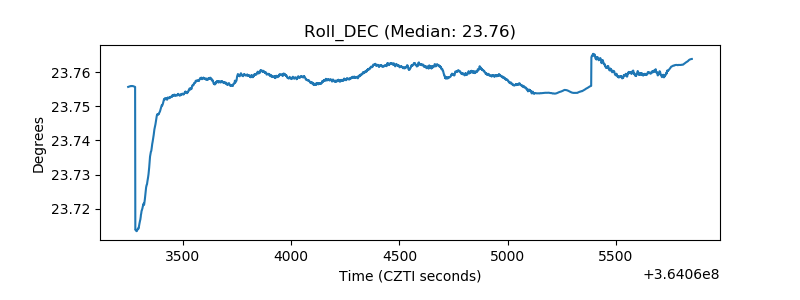 |
| _Roll_RA | 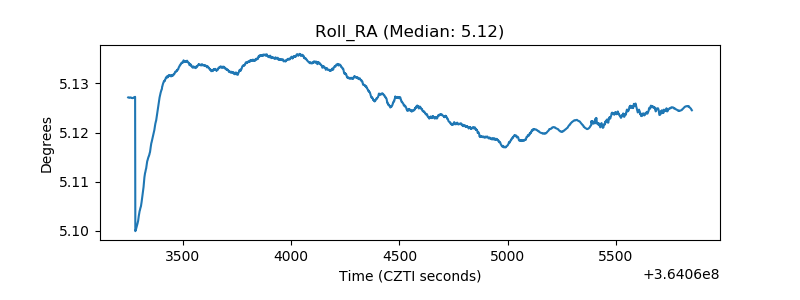 |
| Veto Counter | 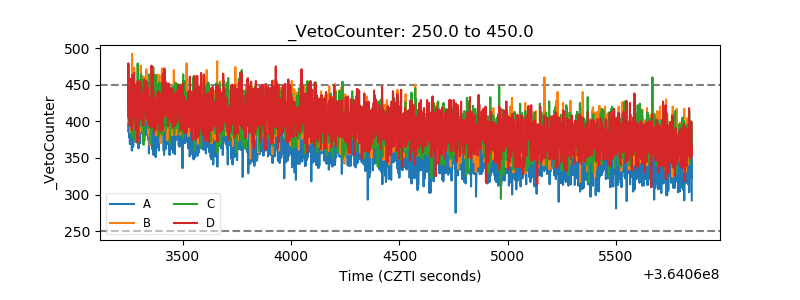 |