| Param | Original file | Final file |
|---|---|---|
| Filename | modeM0/AS1A10_053T42_9000004544cztM0_level2.fits | modeM0/AS1A10_053T42_9000004544cztM0_level2_quad_clean.evt |
| Size (bytes) | 140,365,440 | 142,597,440 |
| Size | 133.9 MB | 136.0 MB |
| Events in quadrant A | 868,532 | 871,273 |
| Events in quadrant B | 805,078 | 852,267 |
| Events in quadrant C | 822,536 | 810,742 |
| Events in quadrant D | 735,078 | 764,117 |
| Mode M0 | |||
|---|---|---|---|
| Quadrant | BADHDUFLAG | Total packets | Discarded packets |
| A | 0 | 30330 | 0 |
| B | 0 | 45533 | 0 |
| C | 0 | 32689 | 0 |
| D | 0 | 37934 | 0 |
| Mode SS | |||
|---|---|---|---|
| Quadrant | BADHDUFLAG | Total packets | Discarded packets |
| A | 0 | 300 | 0 |
| B | 0 | 300 | 0 |
| C | 0 | 300 | 0 |
| D | 0 | 300 | 0 |
| Mode M9 | |||
|---|---|---|---|
| Quadrant | BADHDUFLAG | Total packets | Discarded packets |
| A | 0 | 15 | 0 |
| B | 0 | 15 | 0 |
| C | 0 | 15 | 0 |
| D | 0 | 15 | 0 |
| Quadrant | Total seconds | Saturated seconds | Saturation percentage |
|---|---|---|---|
| A | 14779 | 132 | 0.893159% |
| B | 14779 | 390 | 2.638879% |
| C | 14779 | 543 | 3.674132% |
| D | 14779 | 512 | 3.464375% |
Noise dominated data is calculated using 1-second bins in cleaned event files. If a bin has >2000 counts, and if more than 50% of those come from <1% of pixels, then it is considered to be noise-dominated and hence unusable.
| Quadrant | # 1 sec bins | Bins with >0 counts | Bins with >2000 counts | High rate bins dominated by noise | Noise dominated (total time) | Noise dominated (detector-on time) | Marked lightcurve |
|---|---|---|---|---|---|---|---|
| A | 16194 | 14779 | 0 | 0 | 0.00% | 0.00% | 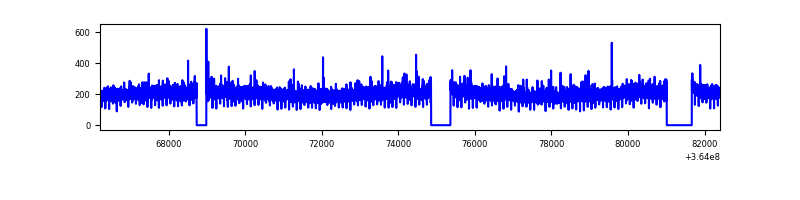 |
| B | 16194 | 14778 | 0 | 0 | 0.00% | 0.00% | 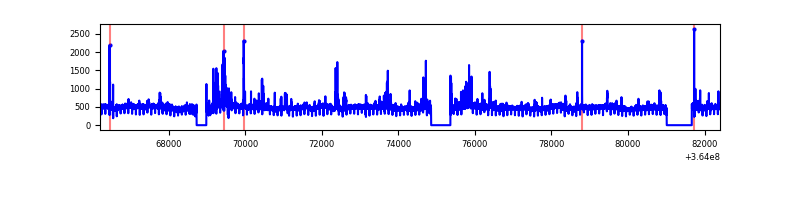 |
| C | 16194 | 14774 | 0 | 0 | 0.00% | 0.00% | 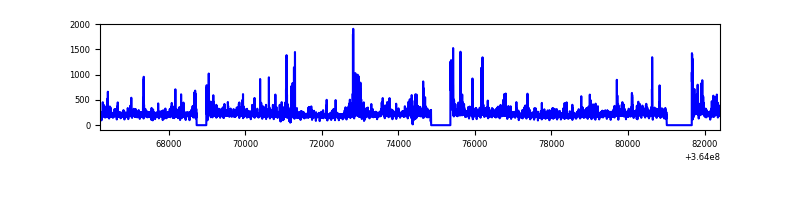 |
| D | 16194 | 14762 | 0 | 0 | 0.00% | 0.00% | 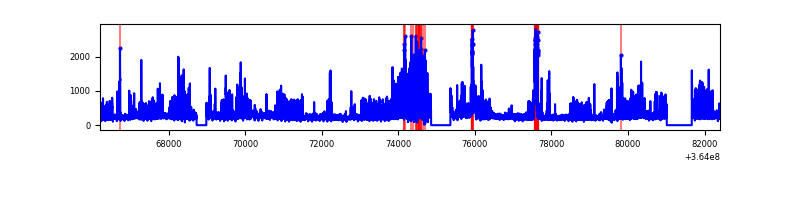 |
Top three noisy pixels from each quadrant. If the there are fewer than three noisy pixels in the level2.evt file, extra rows are filled as -1
| Pixel properties | Quadrant properties | ||||||
|---|---|---|---|---|---|---|---|
| Quadrant | DetID | PixID | Counts | Sigma | Mean | Median | Sigma |
| A | 0 | 29 | 882 | 11.52 | 226 | 212 | 58.2 |
| A | 7 | 110 | 704 | 8.46 | 226 | 212 | 58.2 |
| A | 0 | 30 | 684 | 8.11 | 226 | 212 | 58.2 |
| B | 2 | 9 | 658 | 10.22 | 212 | 202 | 44.6 |
| B | 5 | 232 | 582 | 8.51 | 212 | 202 | 44.6 |
| B | 5 | 255 | 527 | 7.28 | 212 | 202 | 44.6 |
| C | 12 | 241 | 609 | 7.18 | 217 | 203 | 56.6 |
| C | 9 | 233 | 581 | 6.68 | 217 | 203 | 56.6 |
| C | 3 | 126 | 574 | 6.56 | 217 | 203 | 56.6 |
| D | 6 | 231 | 554 | 6.27 | 209 | 190 | 58.0 |
| D | 4 | 160 | 531 | 5.88 | 209 | 190 | 58.0 |
| D | 7 | 3 | 524 | 5.76 | 209 | 190 | 58.0 |
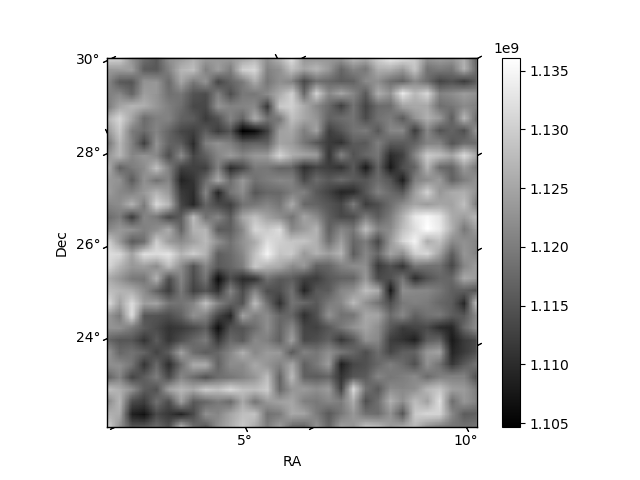
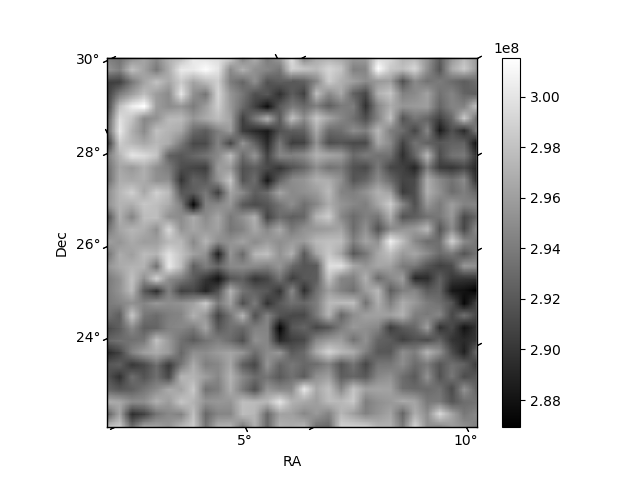
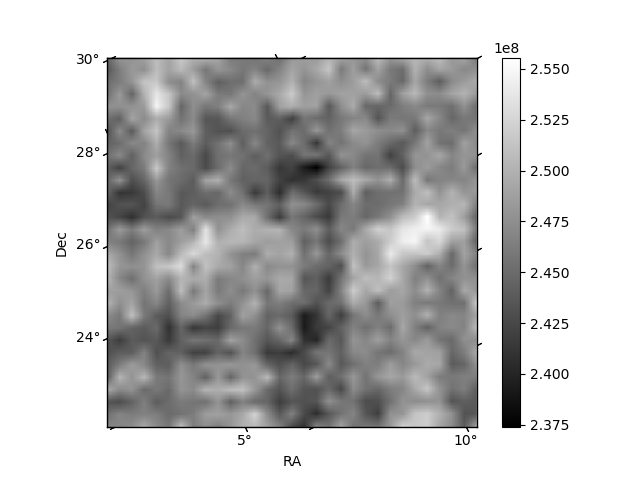
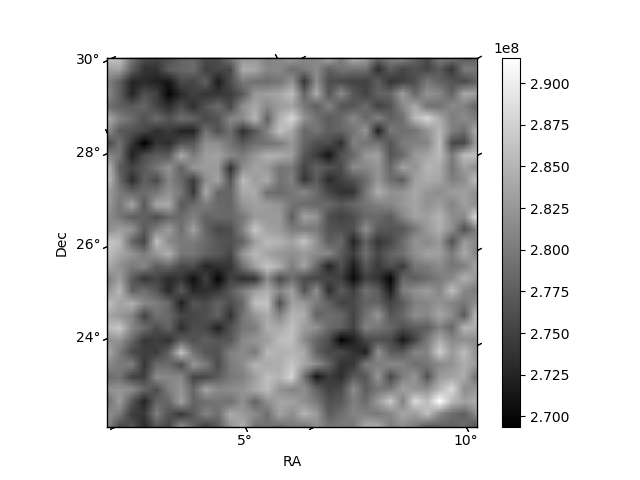
Histogram calculated using DETX and DETY for each event in the final _common_clean file
| Quadrant A | 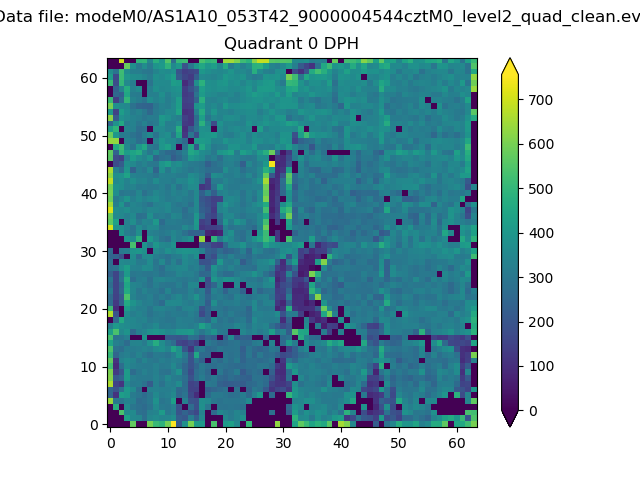 |
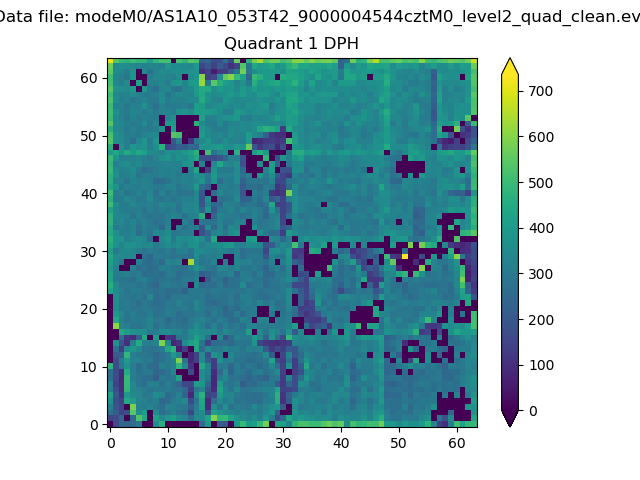 |
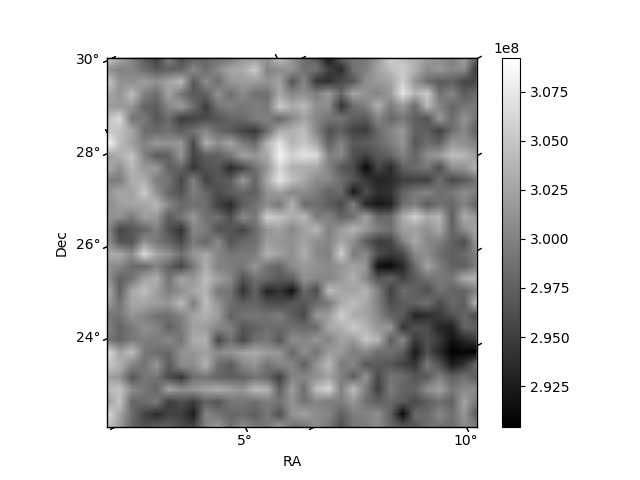
Quadrant B |
|---|---|---|---|
| Quadrant D | 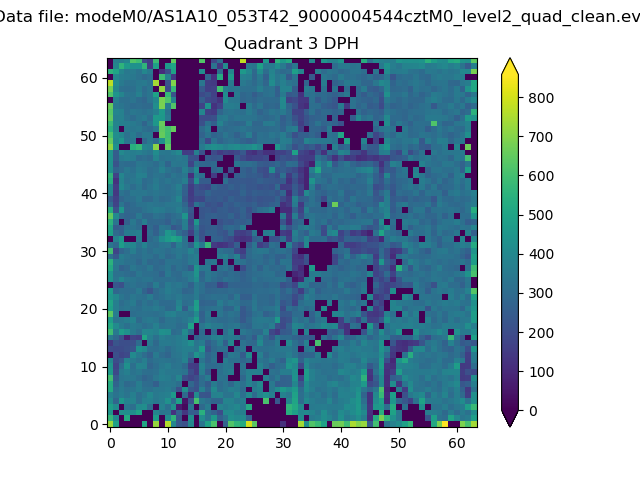 |
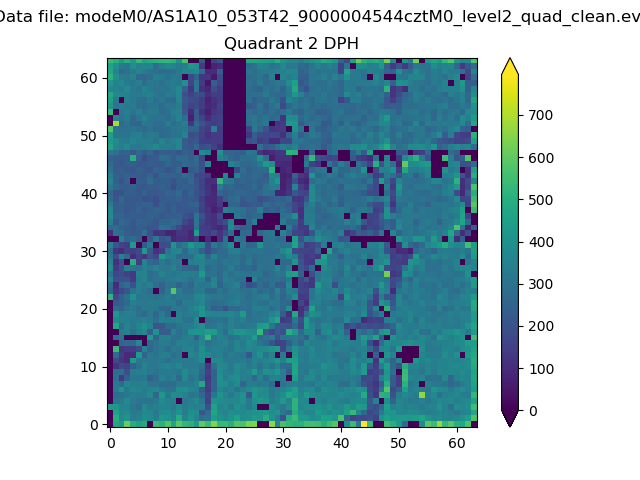 |
Quadrant C |
| Plot type | Count rate plots | Images |
|---|---|---|
| Comparison with Poisson distribution Blue bars denote a histogram of data divided into 1 sec bins. Red curve is a Poisson curve with rate = median count rate of data. |
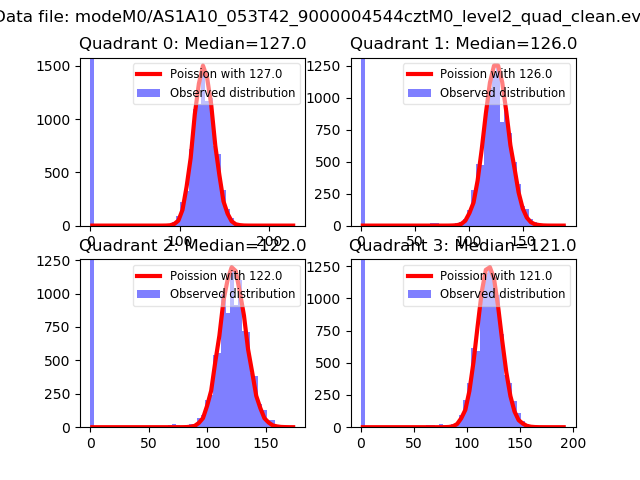 |
 |
| Quadrant-wise count rates Data is divided into 100 sec bins |
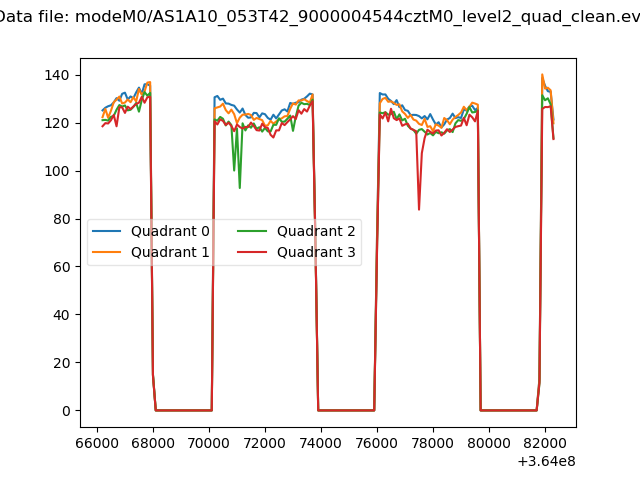 |
|
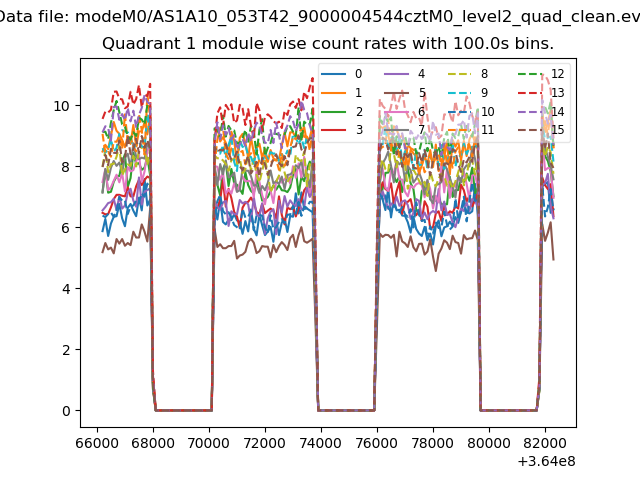
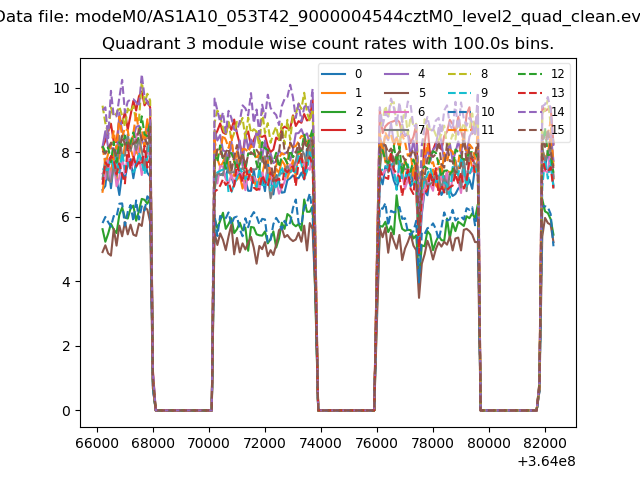
| Module-wise count rates for Quadrant A Data is divided into 100 sec bins |
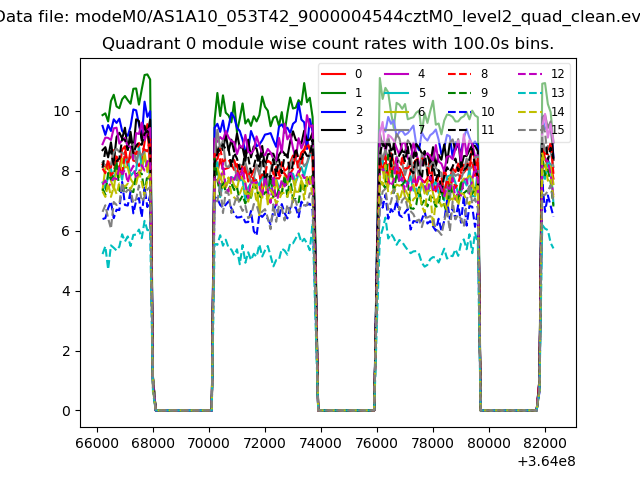 |
 |
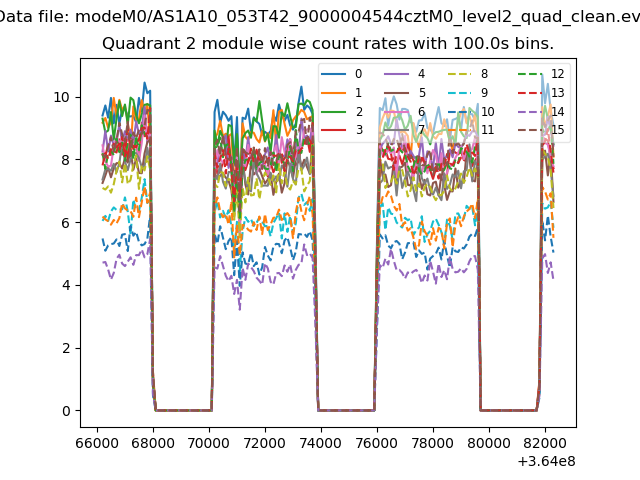
| Module-wise count rates for Quadrant B Data is divided into 100 sec bins |
 |
 |
| Module-wise count rates for Quadrant C Data is divided into 100 sec bins |
 |
 |
| Module-wise count rates for Quadrant D Data is divided into 100 sec bins |
 |
 |
| Parameter | Plot |
|---|---|
| CZT HV Monitor | 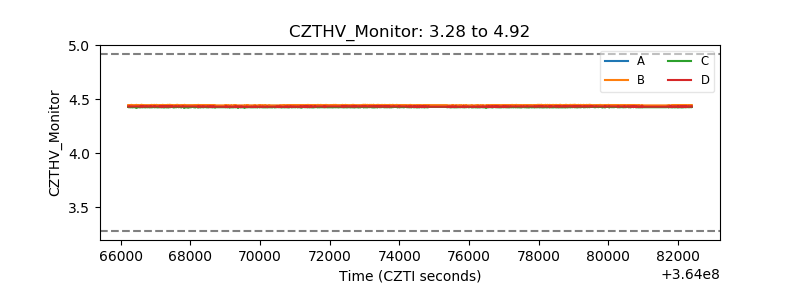 |
| D_VDD | 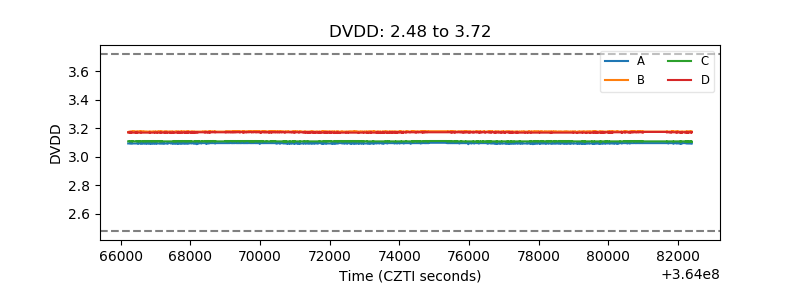 |
| Temperature 1 | 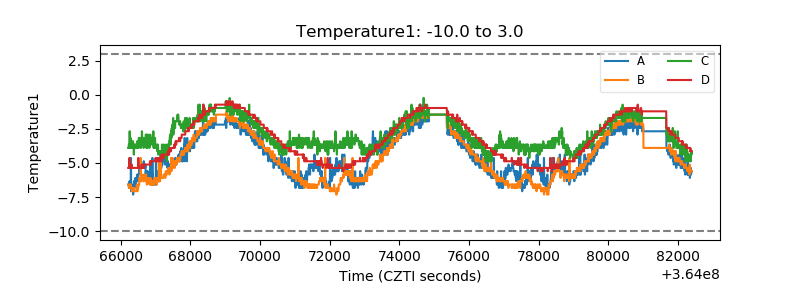 |
| Veto HV Monitor | 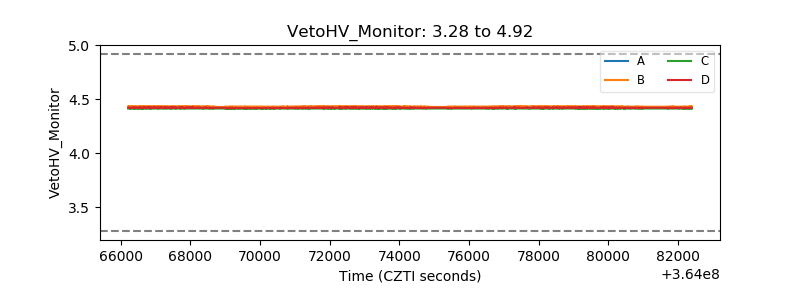 |
| Veto LLD | 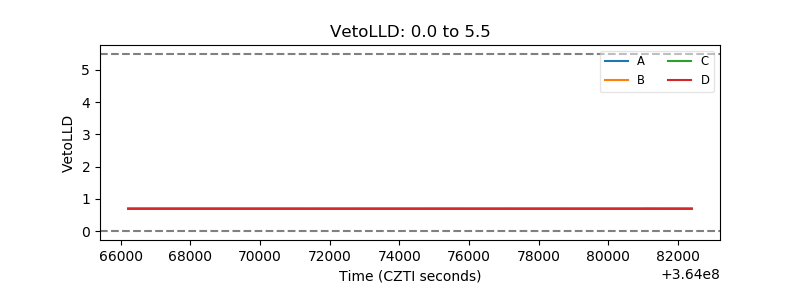 |
| Alpha Counter | 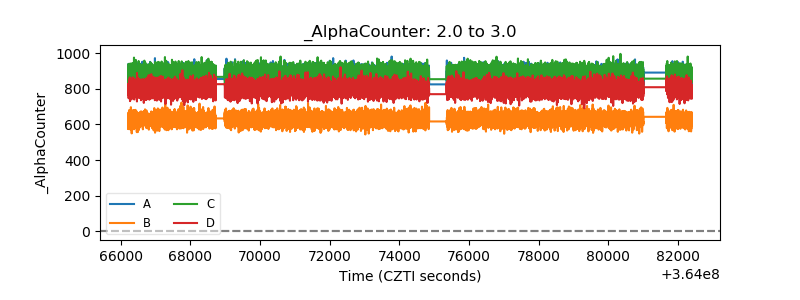 |
| _CPM_Rate | 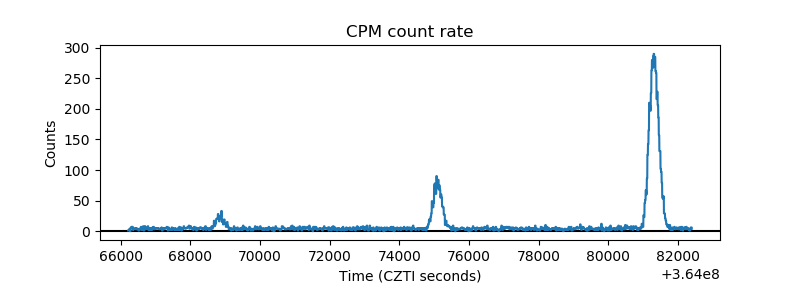 |
| CZT Counter | 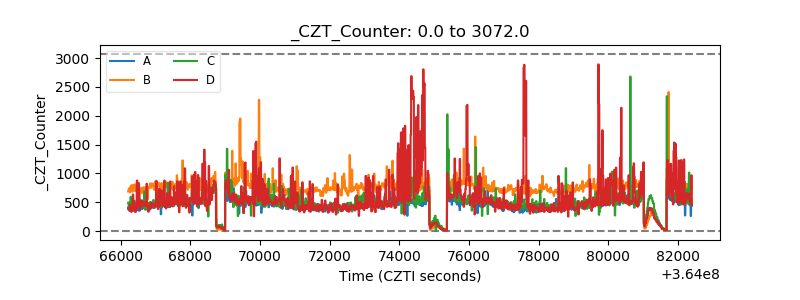 |
| +2.5 Volts monitor | 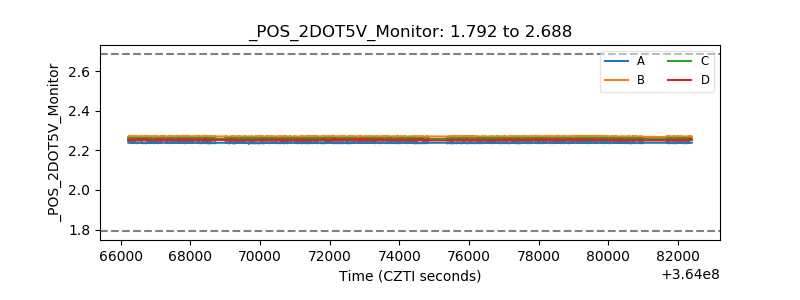 |
| +5 Volts monitor | 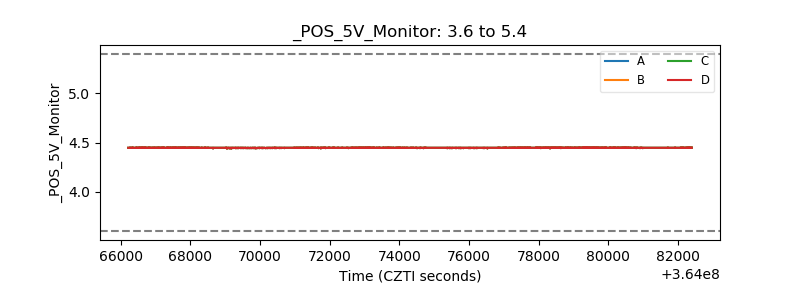 |
| _ROLL_ROT | 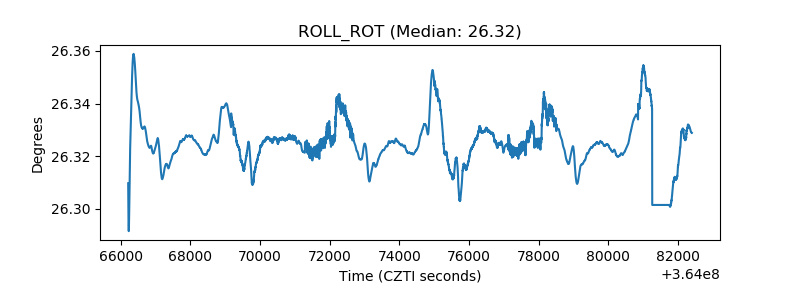 |
| _Roll_DEC | 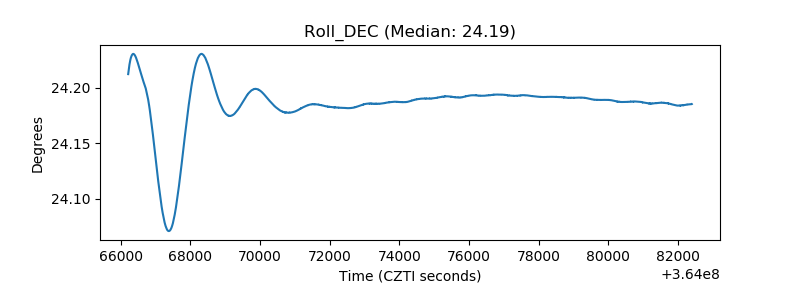 |
| _Roll_RA | 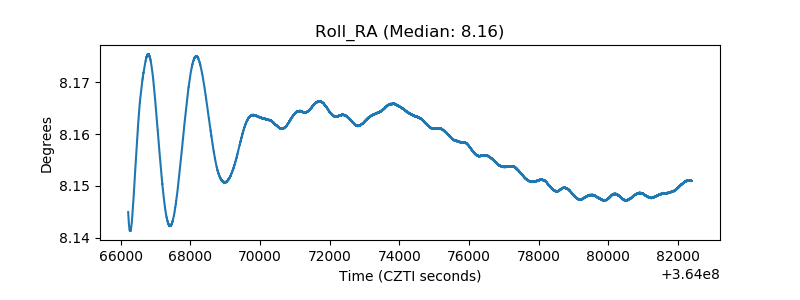 |
| Veto Counter | 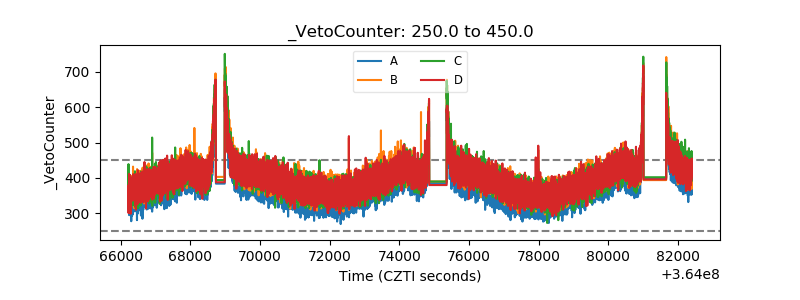 |