| Param | Original file | Final file |
|---|---|---|
| Filename | modeM0/AS1A10_053T42_9000004544_31344cztM0_level2.evt | modeM0/AS1A10_053T42_9000004544_31344cztM0_level2_quad_clean.evt |
| Size (bytes) | 346,060,800 | 46,779,840 |
| Size | 330.0 MB | 44.6 MB |
| Events in quadrant A | 2,048,166 | 288,874 |
| Events in quadrant B | 3,414,657 | 284,710 |
| Events in quadrant C | 2,233,237 | 276,176 |
| Events in quadrant D | 2,502,398 | 274,517 |
| Mode M0 | |||
|---|---|---|---|
| Quadrant | BADHDUFLAG | Total packets | Discarded packets |
| A | 0 | 8623 | 1 |
| B | 0 | 13008 | 1 |
| C | 0 | 9161 | 1 |
| D | 0 | 10093 | 1 |
| Mode SS | |||
|---|---|---|---|
| Quadrant | BADHDUFLAG | Total packets | Discarded packets |
| A | 0 | 84 | 0 |
| B | 0 | 84 | 0 |
| C | 0 | 84 | 0 |
| D | 0 | 84 | 0 |
| Mode M9 | |||
|---|---|---|---|
| Quadrant | BADHDUFLAG | Total packets | Discarded packets |
| A | 0 | 3 | 0 |
| B | 0 | 3 | 0 |
| C | 0 | 3 | 0 |
| D | 0 | 3 | 0 |
| Quadrant | Total seconds | Saturated seconds | Saturation percentage |
|---|---|---|---|
| A | 4143 | 87 | 2.099928% |
| B | 4143 | 220 | 5.310162% |
| C | 4143 | 189 | 4.561912% |
| D | 4143 | 104 | 2.510258% |
Noise dominated data is calculated using 1-second bins in cleaned event files. If a bin has >2000 counts, and if more than 50% of those come from <1% of pixels, then it is considered to be noise-dominated and hence unusable.
| Quadrant | # 1 sec bins | Bins with >0 counts | Bins with >2000 counts | High rate bins dominated by noise | Noise dominated (total time) | Noise dominated (detector-on time) | Marked lightcurve |
|---|---|---|---|---|---|---|---|
| A | 4398 | 4144 | 0 | 0 | 0.00% | 0.00% | 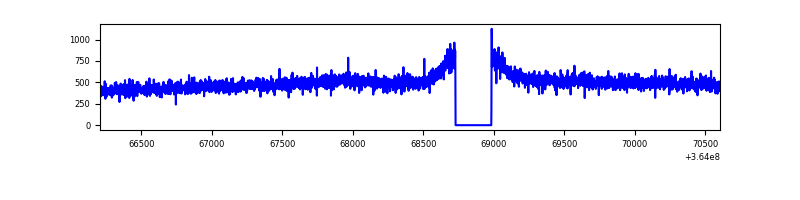 |
| B | 4398 | 4144 | 30 | 30 | 0.68% | 0.72% | 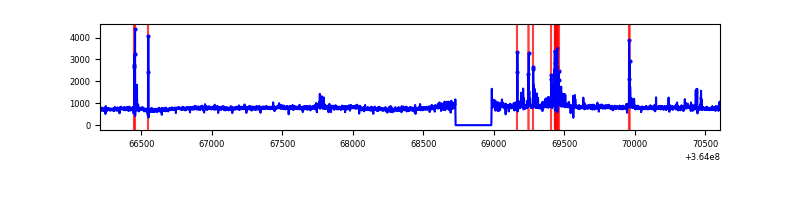 |
| C | 4398 | 4144 | 0 | 0 | 0.00% | 0.00% | 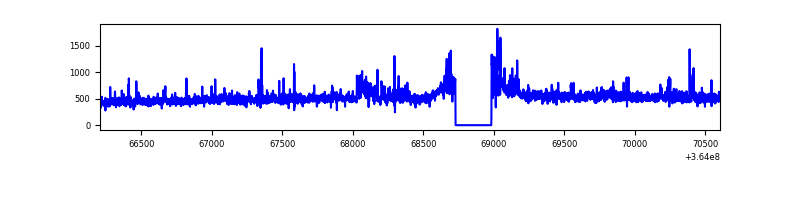 |
| D | 4398 | 4144 | 19 | 19 | 0.43% | 0.46% | 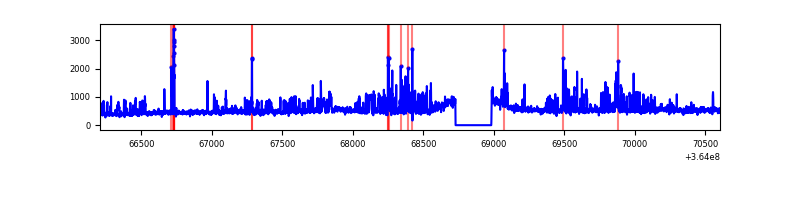 |
Top three noisy pixels from each quadrant. If the there are fewer than three noisy pixels in the level2.evt file, extra rows are filled as -1
| Pixel properties | Quadrant properties | ||||||
|---|---|---|---|---|---|---|---|
| Quadrant | DetID | PixID | Counts | Sigma | Mean | Median | Sigma |
| A | 13 | 254 | 7306 | 62.28 | 530 | 518 | 109.0 |
| A | 3 | 137 | 5461 | 45.35 | 530 | 518 | 109.0 |
| A | 0 | 226 | 4619 | 37.63 | 530 | 518 | 109.0 |
| B | 6 | 159 | 1184737 | 11712.49 | 515 | 500 | 101.1 |
| B | 0 | 190 | 130363 | 1284.39 | 515 | 500 | 101.1 |
| B | 0 | 230 | 24716 | 239.5 | 515 | 500 | 101.1 |
| C | 14 | 238 | 105665 | 895.41 | 495 | 497 | 117.5 |
| C | 3 | 233 | 97277 | 823.99 | 495 | 497 | 117.5 |
| C | 0 | 10 | 43300 | 364.43 | 495 | 497 | 117.5 |
| D | 8 | 195 | 365809 | 2980.15 | 510 | 496 | 122.6 |
| D | 12 | 79 | 57348 | 463.79 | 510 | 496 | 122.6 |
| D | 11 | 176 | 43423 | 350.19 | 510 | 496 | 122.6 |
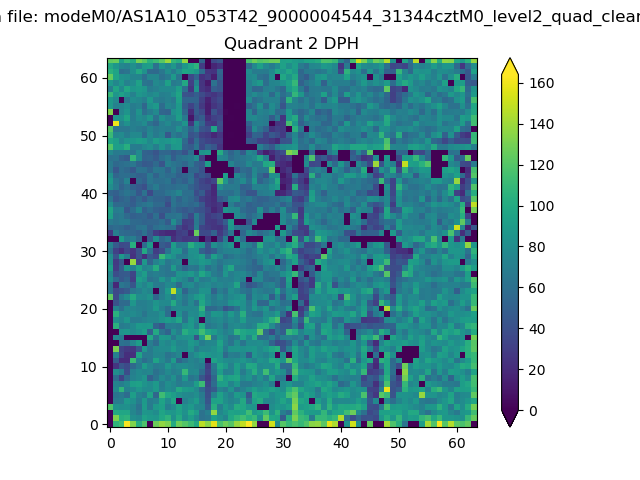
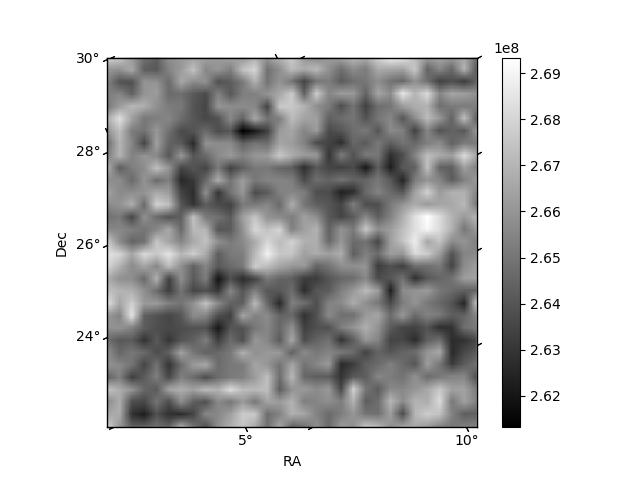
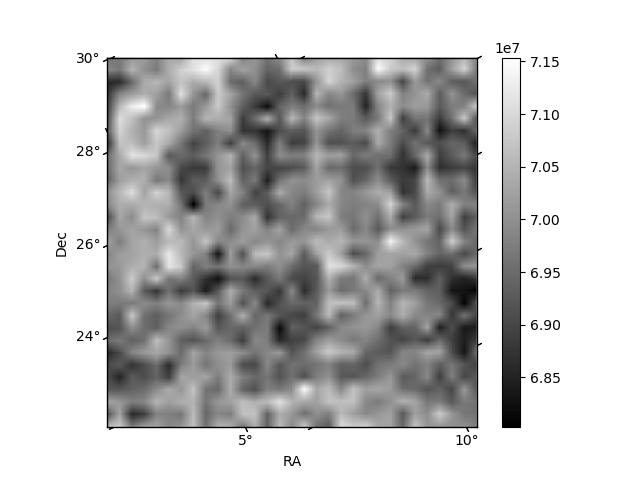
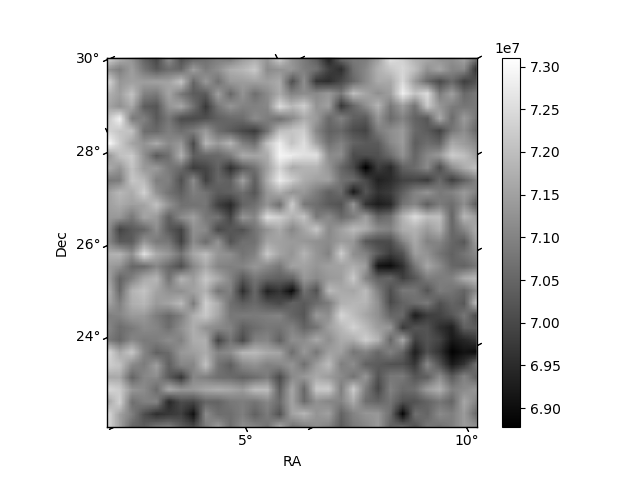
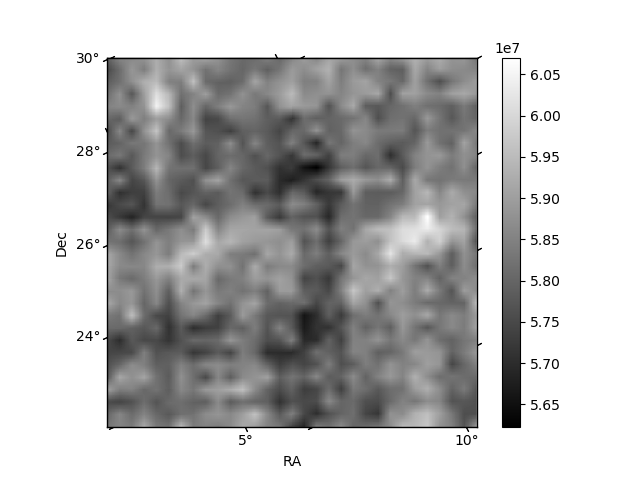
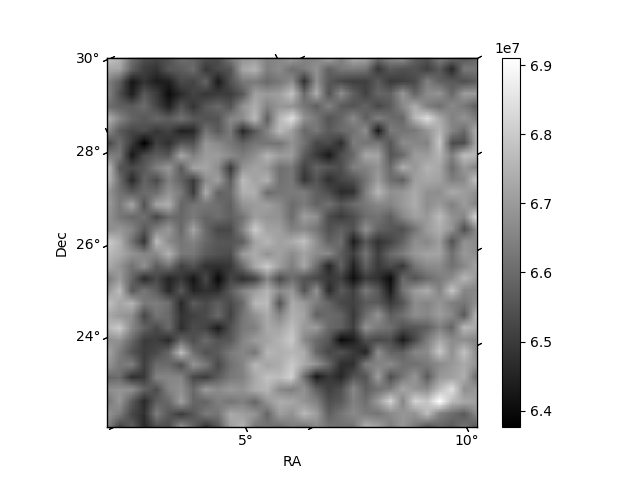
Histogram calculated using DETX and DETY for each event in the final _common_clean file
| Quadrant A | 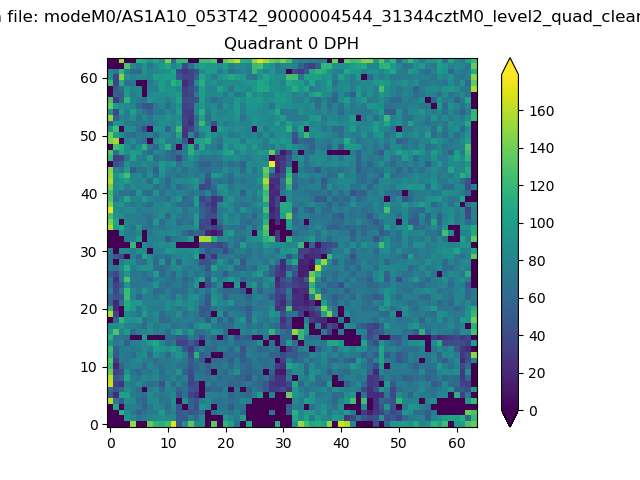 |
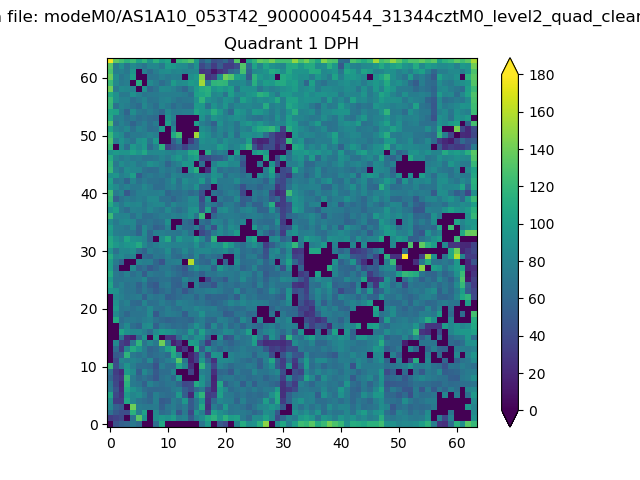 |
Quadrant B |
|---|---|---|---|
| Quadrant D | 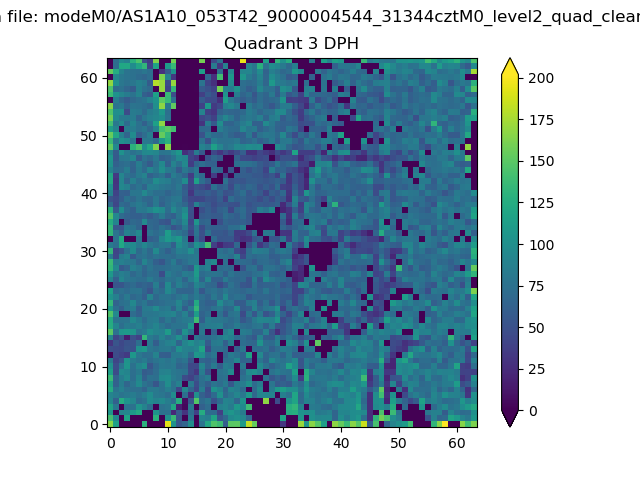 |
 |
Quadrant C |
| Plot type | Count rate plots | Images |
|---|---|---|
| Comparison with Poisson distribution Blue bars denote a histogram of data divided into 1 sec bins. Red curve is a Poisson curve with rate = median count rate of data. |
 |
 |
| Quadrant-wise count rates Data is divided into 100 sec bins |
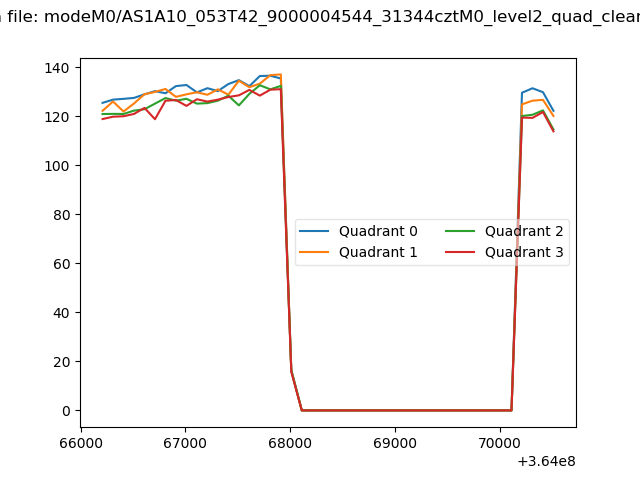 |
|
| Module-wise count rates for Quadrant A Data is divided into 100 sec bins |
 |
 |
| Module-wise count rates for Quadrant B Data is divided into 100 sec bins |
 |
 |
| Module-wise count rates for Quadrant C Data is divided into 100 sec bins |
 |
 |
| Module-wise count rates for Quadrant D Data is divided into 100 sec bins |
 |
 |
| Parameter | Plot |
|---|---|
| CZT HV Monitor |  |
| D_VDD | 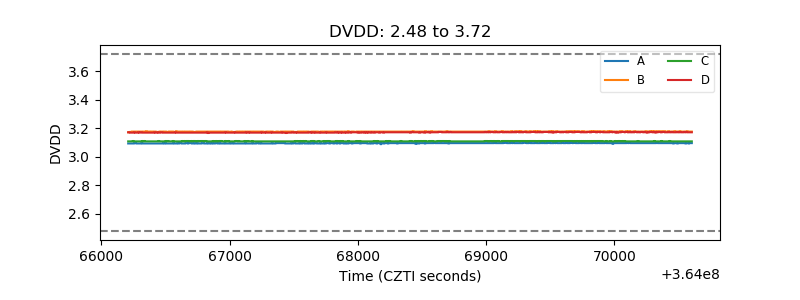 |
| Temperature 1 | 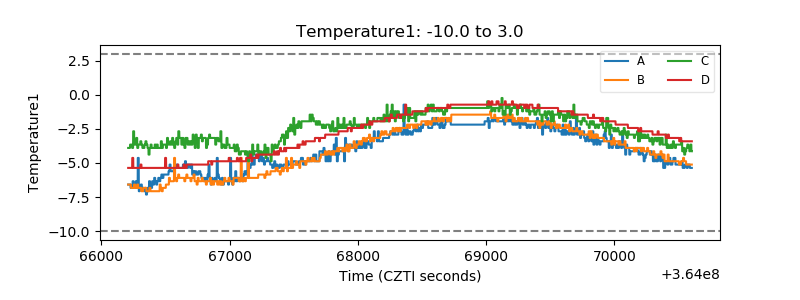 |
| Veto HV Monitor | 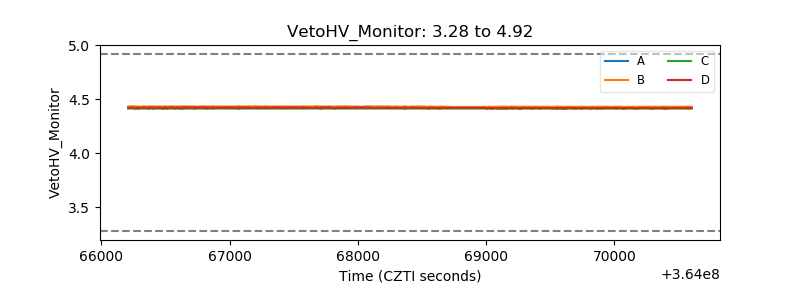 |
| Veto LLD | 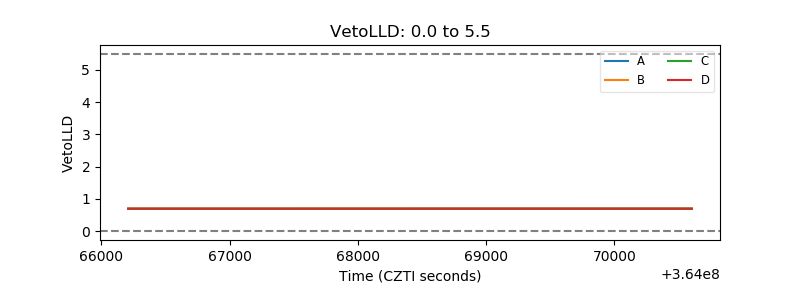 |
| Alpha Counter | 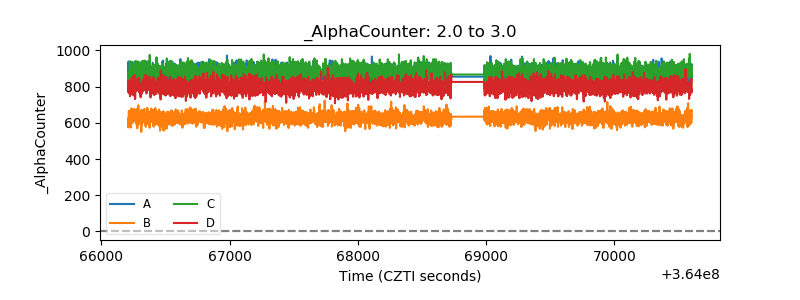 |
| _CPM_Rate | 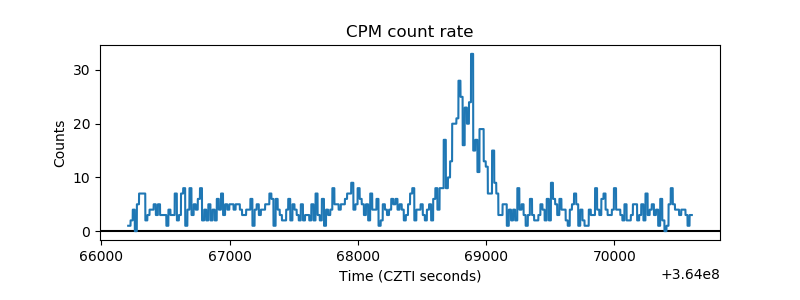 |
| CZT Counter | 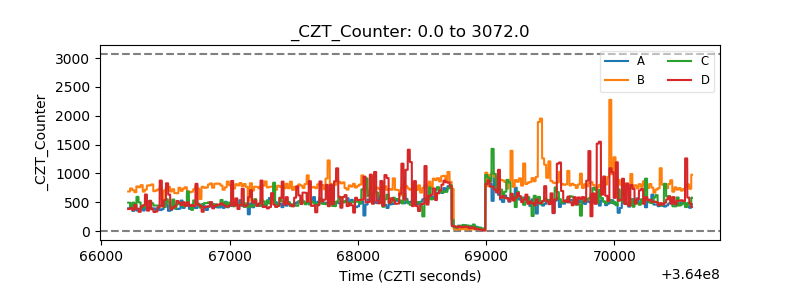 |
| +2.5 Volts monitor |  |
| +5 Volts monitor |  |
| _ROLL_ROT | 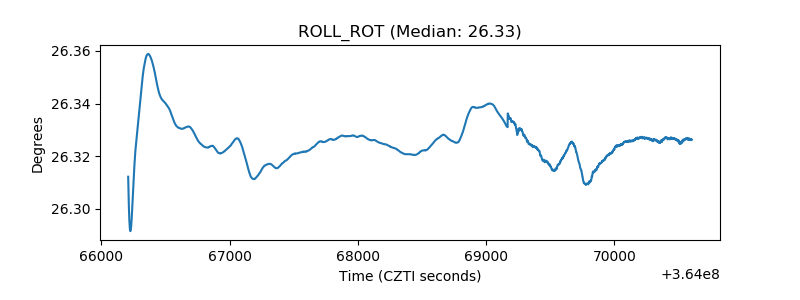 |
| _Roll_DEC | 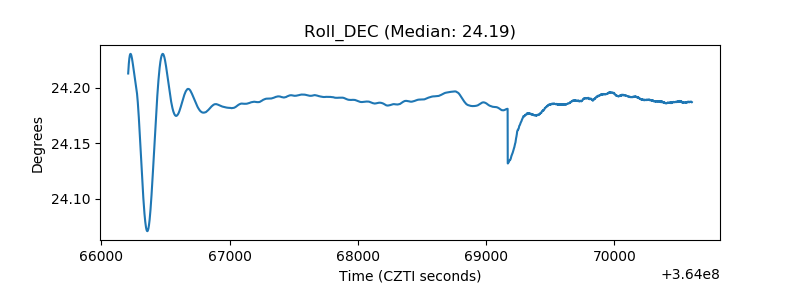 |
| _Roll_RA | 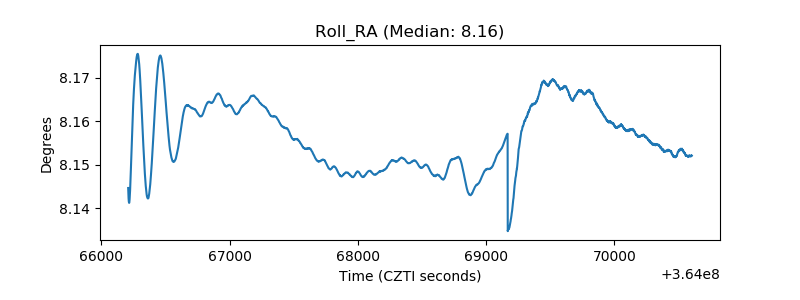 |
| Veto Counter |  |