| Param | Original file | Final file |
|---|---|---|
| Filename | modeM0/AS1A10_101T01_9000004546cztM0_level2.fits | modeM0/AS1A10_101T01_9000004546cztM0_level2_quad_clean.evt |
| Size (bytes) | 335,563,200 | 267,762,240 |
| Size | 320.0 MB | 255.4 MB |
| Events in quadrant A | 2,144,518 | 1,560,939 |
| Events in quadrant B | 1,989,092 | 1,536,920 |
| Events in quadrant C | 1,992,956 | 1,422,693 |
| Events in quadrant D | 1,814,093 | 1,365,527 |
| Mode M0 | |||
|---|---|---|---|
| Quadrant | BADHDUFLAG | Total packets | Discarded packets |
| A | 0 | 68198 | 0 |
| B | 0 | 98876 | 0 |
| C | 0 | 75570 | 0 |
| D | 0 | 76117 | 0 |
| Mode SS | |||
|---|---|---|---|
| Quadrant | BADHDUFLAG | Total packets | Discarded packets |
| A | 0 | 658 | 0 |
| B | 0 | 658 | 0 |
| C | 0 | 658 | 0 |
| D | 0 | 658 | 0 |
| Mode M9 | |||
|---|---|---|---|
| Quadrant | BADHDUFLAG | Total packets | Discarded packets |
| A | 0 | 213 | 0 |
| B | 0 | 213 | 0 |
| C | 0 | 213 | 0 |
| D | 0 | 213 | 0 |
| Quadrant | Total seconds | Saturated seconds | Saturation percentage |
|---|---|---|---|
| A | 32344 | 343 | 1.060475% |
| B | 32343 | 637 | 1.969514% |
| C | 32338 | 1149 | 3.553095% |
| D | 32346 | 230 | 0.711062% |
Noise dominated data is calculated using 1-second bins in cleaned event files. If a bin has >2000 counts, and if more than 50% of those come from <1% of pixels, then it is considered to be noise-dominated and hence unusable.
| Quadrant | # 1 sec bins | Bins with >0 counts | Bins with >2000 counts | High rate bins dominated by noise | Noise dominated (total time) | Noise dominated (detector-on time) | Marked lightcurve |
|---|---|---|---|---|---|---|---|
| A | 38123 | 32321 | 0 | 0 | 0.00% | 0.00% |  |
| B | 38123 | 32324 | 0 | 0 | 0.00% | 0.00% |  |
| C | 38123 | 32321 | 0 | 0 | 0.00% | 0.00% |  |
| D | 38123 | 32324 | 0 | 0 | 0.00% | 0.00% |  |
Top three noisy pixels from each quadrant. If the there are fewer than three noisy pixels in the level2.evt file, extra rows are filled as -1
| Pixel properties | Quadrant properties | ||||||
|---|---|---|---|---|---|---|---|
| Quadrant | DetID | PixID | Counts | Sigma | Mean | Median | Sigma |
| A | 0 | 29 | 1725 | 8.79 | 558 | 526 | 136.4 |
| A | 7 | 110 | 1698 | 8.59 | 558 | 526 | 136.4 |
| A | 9 | 19 | 1631 | 8.1 | 558 | 526 | 136.4 |
| B | 2 | 9 | 1604 | 10.5 | 525 | 504 | 104.7 |
| B | 5 | 128 | 1356 | 8.13 | 525 | 504 | 104.7 |
| B | 2 | 8 | 1319 | 7.78 | 525 | 504 | 104.7 |
| C | 12 | 241 | 1395 | 6.64 | 528 | 495 | 135.6 |
| C | 9 | 209 | 1388 | 6.58 | 528 | 495 | 135.6 |
| C | 3 | 187 | 1350 | 6.3 | 528 | 495 | 135.6 |
| D | 10 | 189 | 1286 | 5.97 | 517 | 474 | 136.0 |
| D | 7 | 3 | 1284 | 5.96 | 517 | 474 | 136.0 |
| D | 6 | 67 | 1283 | 5.95 | 517 | 474 | 136.0 |
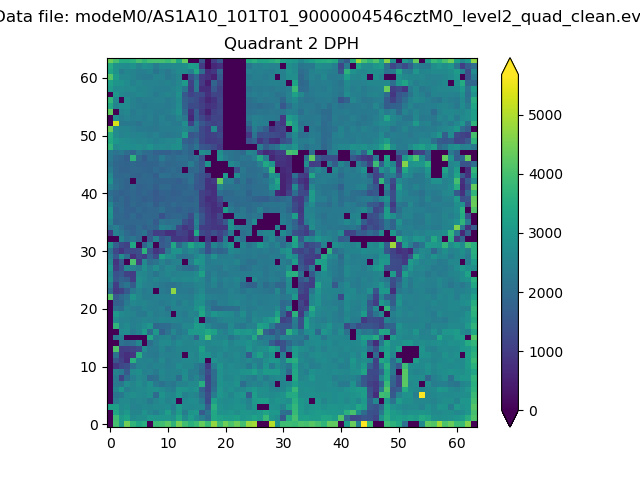
Histogram calculated using DETX and DETY for each event in the final _common_clean file
| Quadrant A | 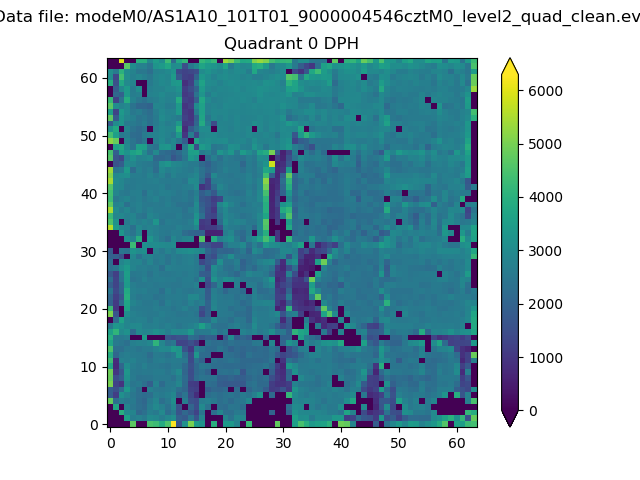 |
 |
Quadrant B |
|---|---|---|---|
| Quadrant D |  |
 |
Quadrant C |
| Plot type | Count rate plots | Images |
|---|---|---|
| Comparison with Poisson distribution Blue bars denote a histogram of data divided into 1 sec bins. Red curve is a Poisson curve with rate = median count rate of data. |
 |
 |
| Quadrant-wise count rates Data is divided into 100 sec bins |
 |
|
| Module-wise count rates for Quadrant A Data is divided into 100 sec bins |
 |
 |
| Module-wise count rates for Quadrant B Data is divided into 100 sec bins |
 |
 |
| Module-wise count rates for Quadrant C Data is divided into 100 sec bins |
 |
 |
| Module-wise count rates for Quadrant D Data is divided into 100 sec bins |
 |
 |
| Parameter | Plot |
|---|---|
| CZT HV Monitor |  |
| D_VDD |  |
| Temperature 1 |  |
| Veto HV Monitor |  |
| Veto LLD |  |
| Alpha Counter |  |
| _CPM_Rate |  |
| CZT Counter |  |
| +2.5 Volts monitor |  |
| +5 Volts monitor |  |
| _ROLL_ROT |  |
| _Roll_DEC |  |
| _Roll_RA |  |
| Veto Counter |  |