| Param | Original file | Final file |
|---|---|---|
| Filename | modeM0/AS1A10_101T01_9000004546_31347cztM0_level2.evt | modeM0/AS1A10_101T01_9000004546_31347cztM0_level2_quad_clean.evt |
| Size (bytes) | 471,438,720 | 80,340,480 |
| Size | 449.6 MB | 76.6 MB |
| Events in quadrant A | 2,680,818 | 518,470 |
| Events in quadrant B | 4,415,558 | 518,116 |
| Events in quadrant C | 3,082,301 | 498,224 |
| Events in quadrant D | 3,705,727 | 492,954 |
| Mode M0 | |||
|---|---|---|---|
| Quadrant | BADHDUFLAG | Total packets | Discarded packets |
| A | 0 | 11890 | 1 |
| B | 0 | 17555 | 1 |
| C | 0 | 12993 | 1 |
| D | 0 | 15148 | 1 |
| Mode SS | |||
|---|---|---|---|
| Quadrant | BADHDUFLAG | Total packets | Discarded packets |
| A | 0 | 116 | 0 |
| B | 0 | 116 | 0 |
| C | 0 | 116 | 0 |
| D | 0 | 116 | 0 |
| Mode M9 | |||
|---|---|---|---|
| Quadrant | BADHDUFLAG | Total packets | Discarded packets |
| A | 0 | 9 | 0 |
| B | 0 | 9 | 0 |
| C | 0 | 9 | 0 |
| D | 0 | 9 | 0 |
| Quadrant | Total seconds | Saturated seconds | Saturation percentage |
|---|---|---|---|
| A | 5803 | 33 | 0.568671% |
| B | 5803 | 85 | 1.464760% |
| C | 5803 | 184 | 3.170774% |
| D | 5803 | 37 | 0.637601% |
Noise dominated data is calculated using 1-second bins in cleaned event files. If a bin has >2000 counts, and if more than 50% of those come from <1% of pixels, then it is considered to be noise-dominated and hence unusable.
| Quadrant | # 1 sec bins | Bins with >0 counts | Bins with >2000 counts | High rate bins dominated by noise | Noise dominated (total time) | Noise dominated (detector-on time) | Marked lightcurve |
|---|---|---|---|---|---|---|---|
| A | 6623 | 5804 | 0 | 0 | 0.00% | 0.00% | 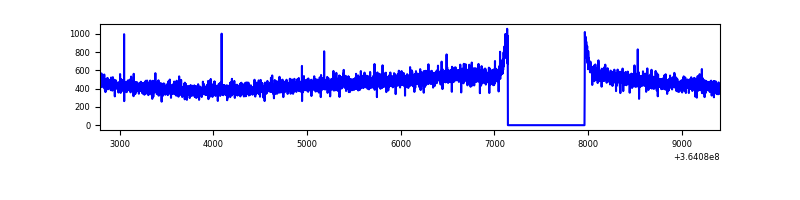 |
| B | 6623 | 5804 | 4 | 4 | 0.06% | 0.07% | 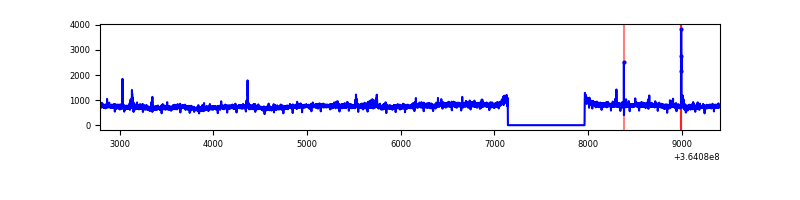 |
| C | 6623 | 5804 | 7 | 7 | 0.11% | 0.12% | 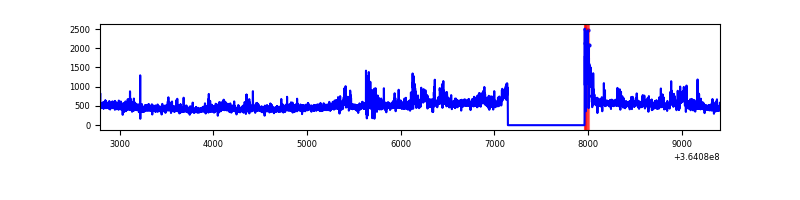 |
| D | 6623 | 5804 | 1 | 1 | 0.02% | 0.02% | 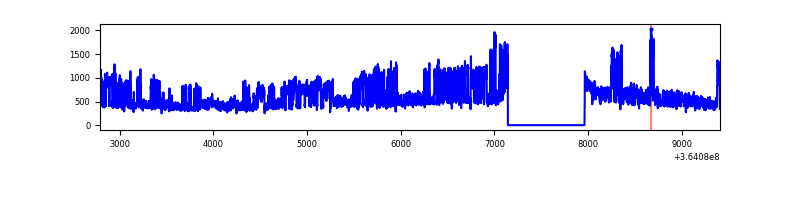 |
Top three noisy pixels from each quadrant. If the there are fewer than three noisy pixels in the level2.evt file, extra rows are filled as -1
| Pixel properties | Quadrant properties | ||||||
|---|---|---|---|---|---|---|---|
| Quadrant | DetID | PixID | Counts | Sigma | Mean | Median | Sigma |
| A | 13 | 254 | 10897 | 73.03 | 694 | 682 | 139.9 |
| A | 3 | 137 | 7119 | 46.02 | 694 | 682 | 139.9 |
| A | 0 | 226 | 5718 | 36.01 | 694 | 682 | 139.9 |
| B | 6 | 159 | 1627995 | 12201.07 | 686 | 667 | 133.4 |
| B | 0 | 190 | 45457 | 335.82 | 686 | 667 | 133.4 |
| B | 10 | 247 | 21752 | 158.09 | 686 | 667 | 133.4 |
| C | 3 | 233 | 250773 | 1593.93 | 663 | 668 | 156.9 |
| C | 14 | 238 | 131242 | 832.15 | 663 | 668 | 156.9 |
| C | 0 | 10 | 63588 | 400.99 | 663 | 668 | 156.9 |
| D | 8 | 195 | 1164346 | 7221.57 | 669 | 650 | 161.1 |
| D | 2 | 234 | 22936 | 138.3 | 669 | 650 | 161.1 |
| D | 11 | 176 | 7939 | 45.23 | 669 | 650 | 161.1 |
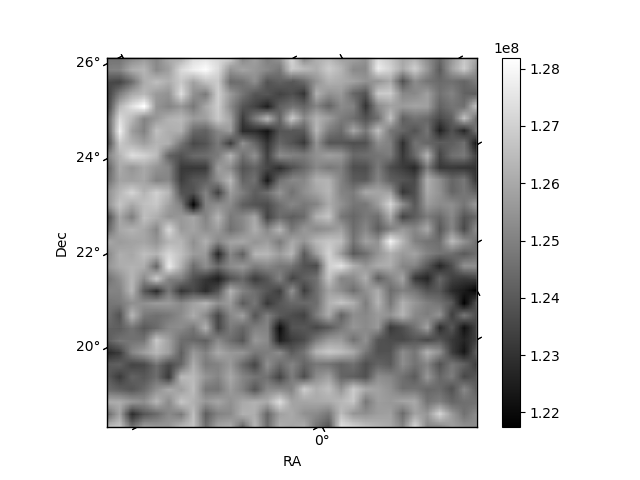
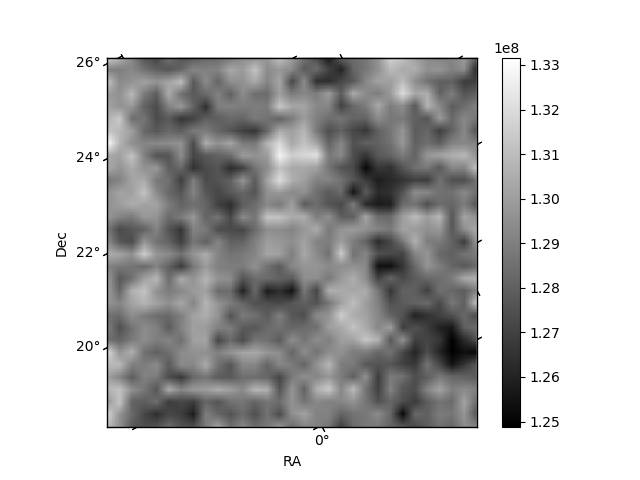
Histogram calculated using DETX and DETY for each event in the final _common_clean file
| Quadrant A | 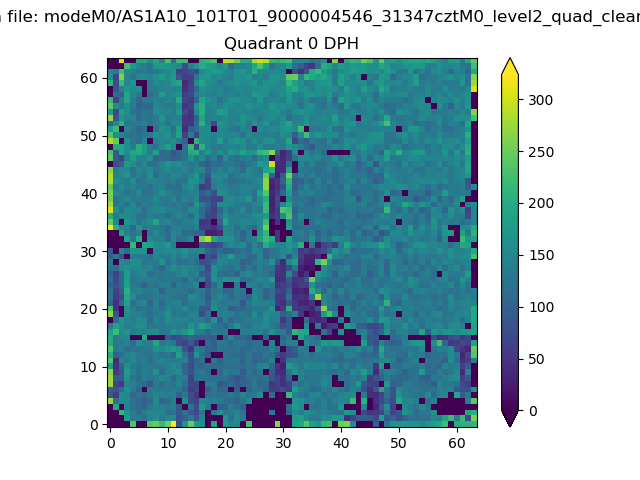 |
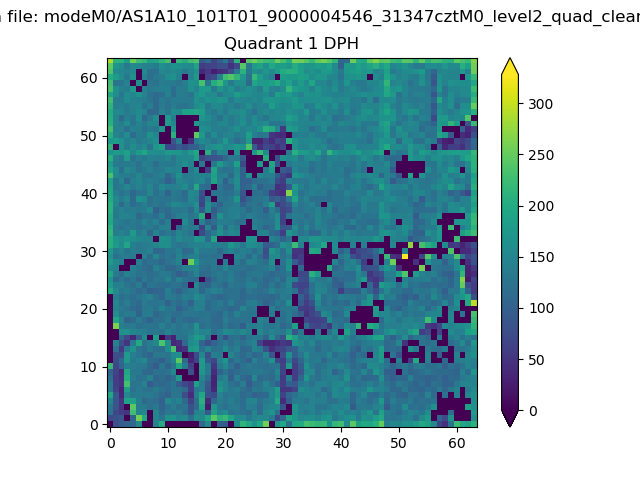 |
Quadrant B |
|---|---|---|---|
| Quadrant D | 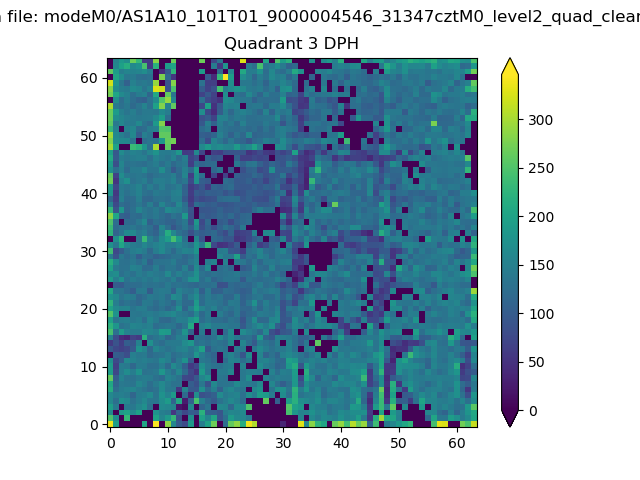 |
 |
Quadrant C |
| Plot type | Count rate plots | Images |
|---|---|---|
| Comparison with Poisson distribution Blue bars denote a histogram of data divided into 1 sec bins. Red curve is a Poisson curve with rate = median count rate of data. |
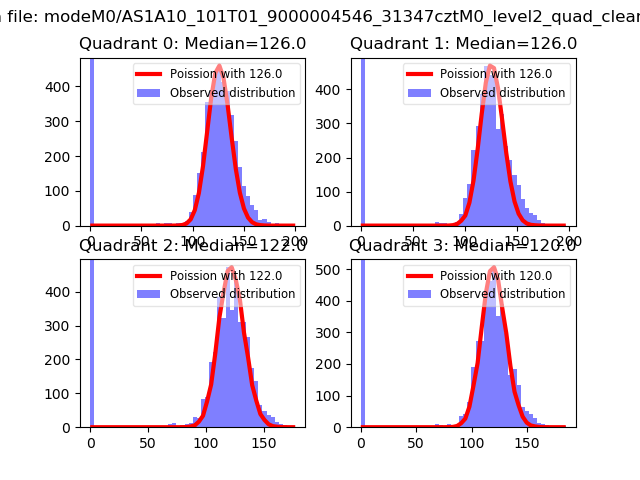 |
 |
| Quadrant-wise count rates Data is divided into 100 sec bins |
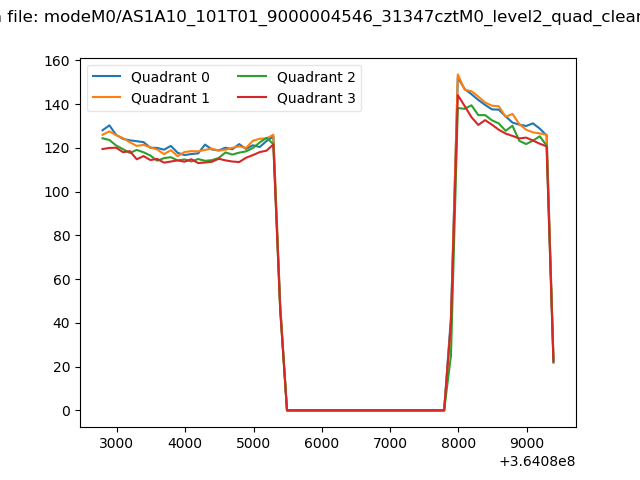 |
|
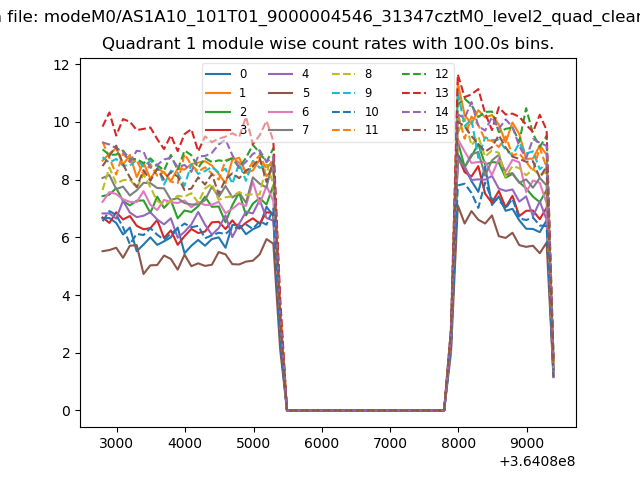
| Module-wise count rates for Quadrant A Data is divided into 100 sec bins |
 |
 |
| Module-wise count rates for Quadrant B Data is divided into 100 sec bins |
 |
 |
| Module-wise count rates for Quadrant C Data is divided into 100 sec bins |
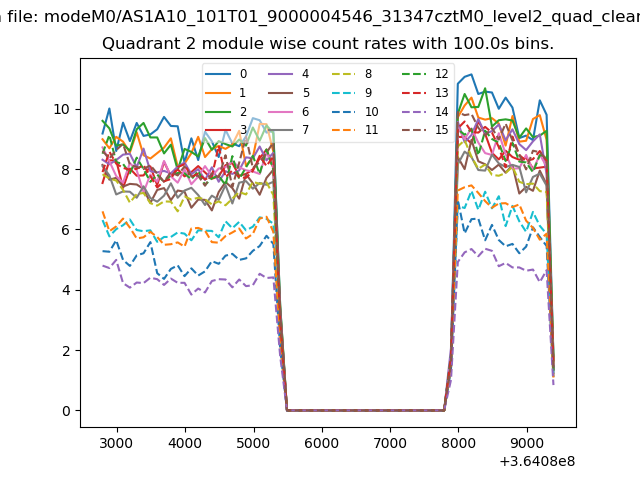 |
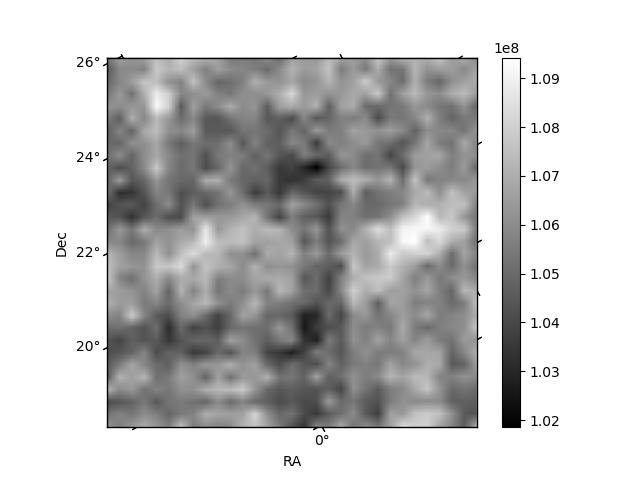 |
| Module-wise count rates for Quadrant D Data is divided into 100 sec bins |
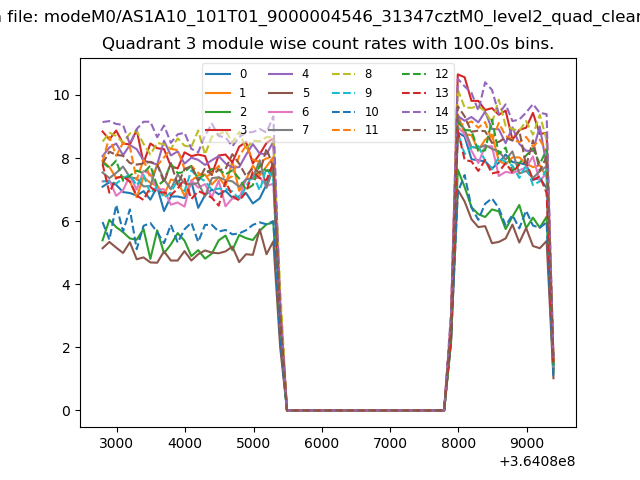 |
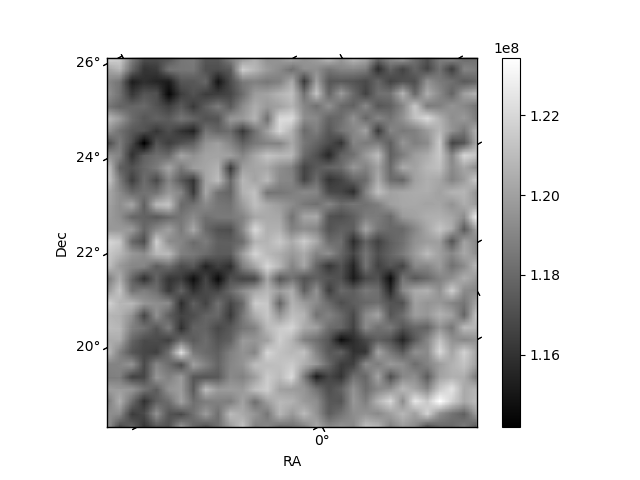 |
| Parameter | Plot |
|---|---|
| CZT HV Monitor | 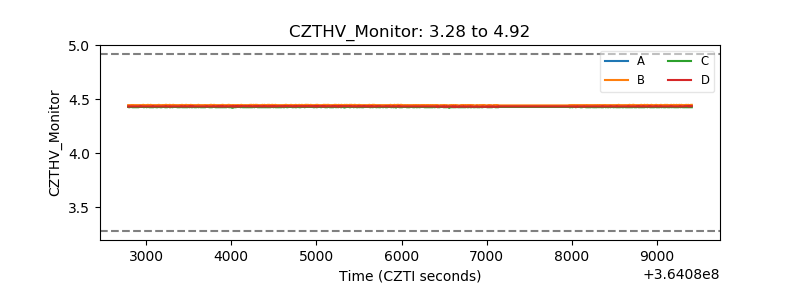 |
| D_VDD | 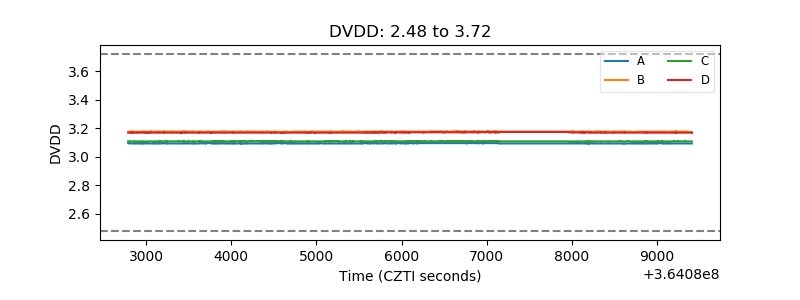 |
| Temperature 1 | 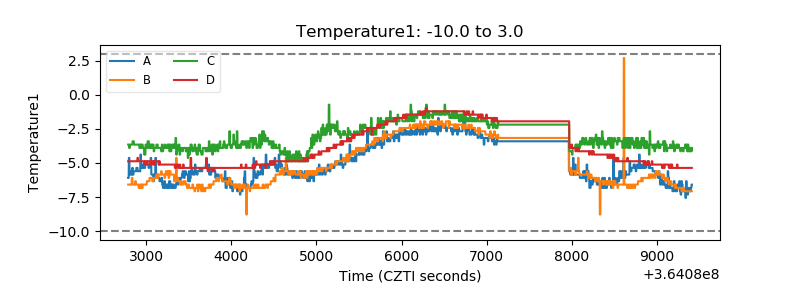 |
| Veto HV Monitor | 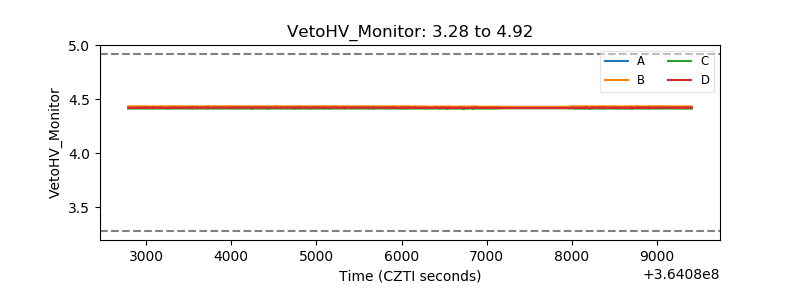 |
| Veto LLD | 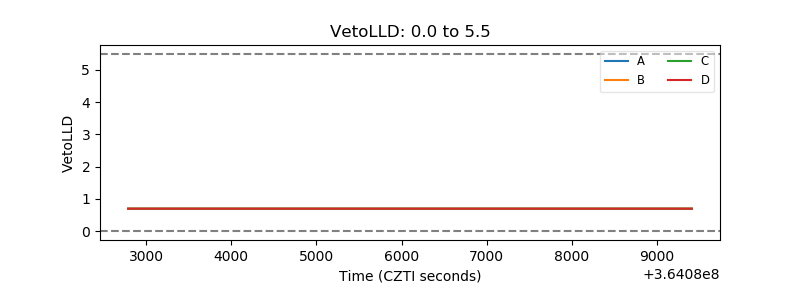 |
| Alpha Counter | 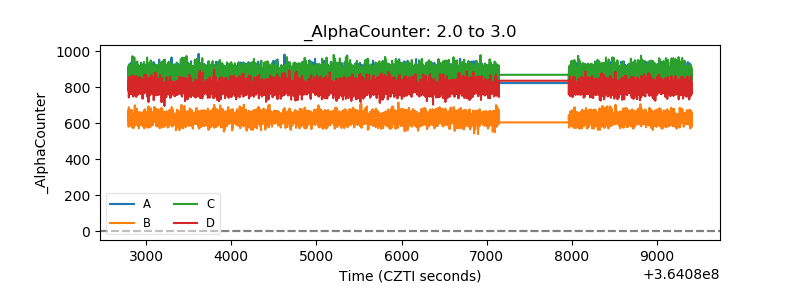 |
| _CPM_Rate | 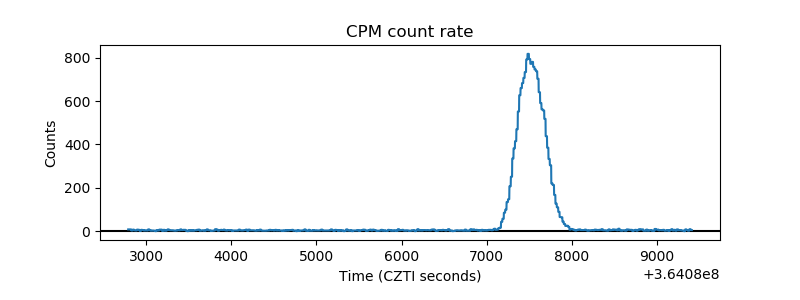 |
| CZT Counter |  |
| +2.5 Volts monitor |  |
| +5 Volts monitor | 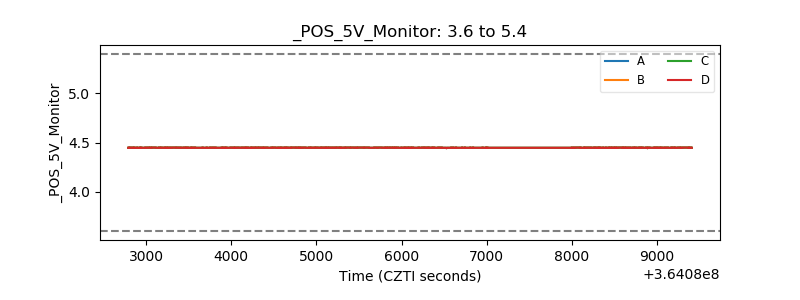 |
| _ROLL_ROT | 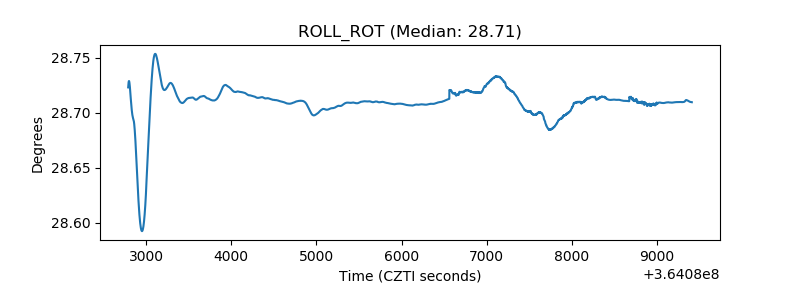 |
| _Roll_DEC | 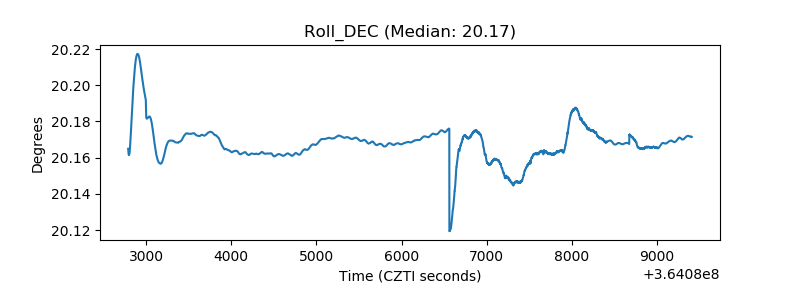 |
| _Roll_RA |  |
| Veto Counter | 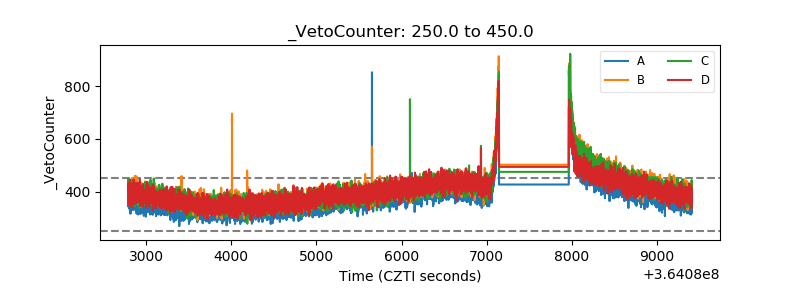 |