| Param | Original file | Final file |
|---|---|---|
| Filename | modeM0/AS1A10_101T01_9000004546_31352cztM0_level2.evt | modeM0/AS1A10_101T01_9000004546_31352cztM0_level2_quad_clean.evt |
| Size (bytes) | 482,031,360 | 86,725,440 |
| Size | 459.7 MB | 82.7 MB |
| Events in quadrant A | 3,012,570 | 579,896 |
| Events in quadrant B | 4,517,893 | 575,622 |
| Events in quadrant C | 3,503,701 | 529,811 |
| Events in quadrant D | 3,178,266 | 543,074 |
| Mode M0 | |||
|---|---|---|---|
| Quadrant | BADHDUFLAG | Total packets | Discarded packets |
| A | 0 | 12213 | 76 |
| B | 0 | 17550 | 172 |
| C | 0 | 14179 | 85 |
| D | 0 | 12896 | 72 |
| Mode SS | |||
|---|---|---|---|
| Quadrant | BADHDUFLAG | Total packets | Discarded packets |
| A | 0 | 116 | 0 |
| B | 0 | 116 | 0 |
| C | 0 | 116 | 0 |
| D | 0 | 116 | 0 |
| Mode M9 | |||
|---|---|---|---|
| Quadrant | BADHDUFLAG | Total packets | Discarded packets |
| A | 0 | 13 | 0 |
| B | 0 | 13 | 0 |
| C | 0 | 13 | 0 |
| D | 0 | 13 | 0 |
| Quadrant | Total seconds | Saturated seconds | Saturation percentage |
|---|---|---|---|
| A | 5692 | 50 | 0.878426% |
| B | 5673 | 109 | 1.921382% |
| C | 5695 | 203 | 3.564530% |
| D | 5698 | 30 | 0.526501% |
Noise dominated data is calculated using 1-second bins in cleaned event files. If a bin has >2000 counts, and if more than 50% of those come from <1% of pixels, then it is considered to be noise-dominated and hence unusable.
| Quadrant | # 1 sec bins | Bins with >0 counts | Bins with >2000 counts | High rate bins dominated by noise | Noise dominated (total time) | Noise dominated (detector-on time) | Marked lightcurve |
|---|---|---|---|---|---|---|---|
| A | 7026 | 5727 | 0 | 0 | 0.00% | 0.00% | 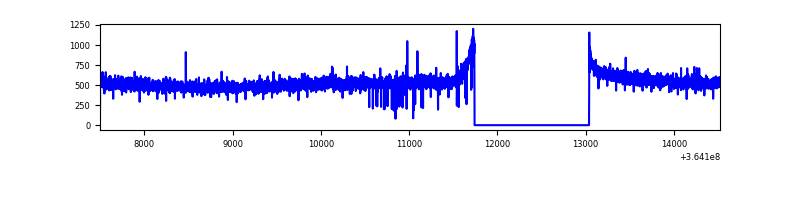 |
| B | 7027 | 5723 | 3 | 3 | 0.04% | 0.05% | 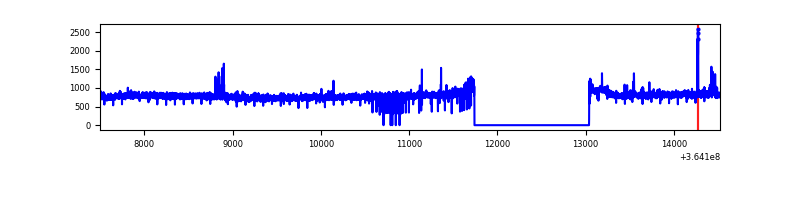 |
| C | 7027 | 5726 | 44 | 44 | 0.63% | 0.77% | 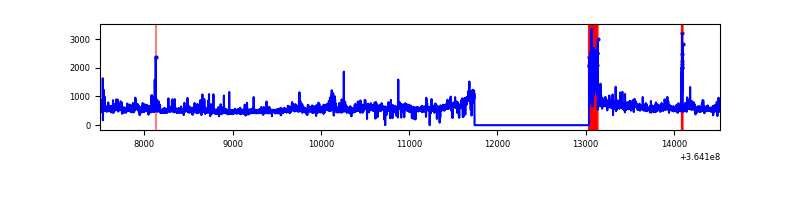 |
| D | 7027 | 5727 | 1 | 1 | 0.01% | 0.02% | 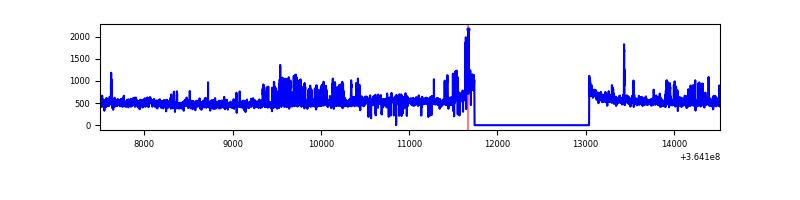 |
Top three noisy pixels from each quadrant. If the there are fewer than three noisy pixels in the level2.evt file, extra rows are filled as -1
| Pixel properties | Quadrant properties | ||||||
|---|---|---|---|---|---|---|---|
| Quadrant | DetID | PixID | Counts | Sigma | Mean | Median | Sigma |
| A | 13 | 254 | 13004 | 79.47 | 780 | 766 | 154.0 |
| A | 3 | 137 | 7246 | 42.08 | 780 | 766 | 154.0 |
| A | 0 | 226 | 6730 | 38.73 | 780 | 766 | 154.0 |
| B | 6 | 159 | 1489271 | 10496.66 | 754 | 737 | 141.8 |
| B | 0 | 190 | 44845 | 311.04 | 754 | 737 | 141.8 |
| B | 4 | 80 | 17580 | 118.77 | 754 | 737 | 141.8 |
| C | 3 | 233 | 300569 | 1808.18 | 717 | 722 | 165.8 |
| C | 0 | 10 | 181885 | 1092.47 | 717 | 722 | 165.8 |
| C | 14 | 238 | 144964 | 869.83 | 717 | 722 | 165.8 |
| D | 8 | 195 | 338328 | 1927.28 | 742 | 726 | 175.2 |
| D | 2 | 250 | 28003 | 155.72 | 742 | 726 | 175.2 |
| D | 2 | 234 | 20324 | 111.88 | 742 | 726 | 175.2 |
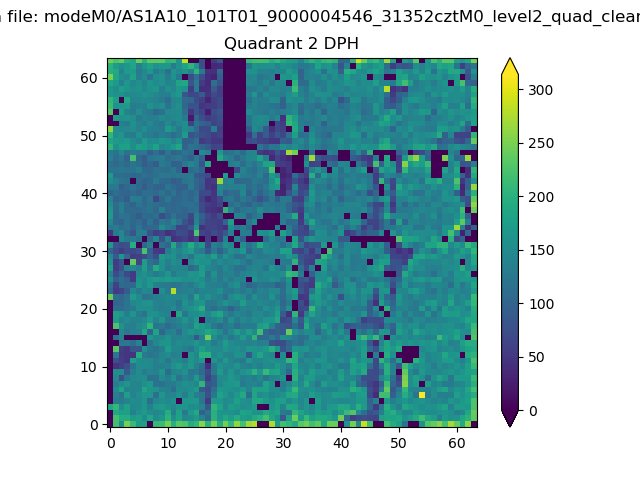
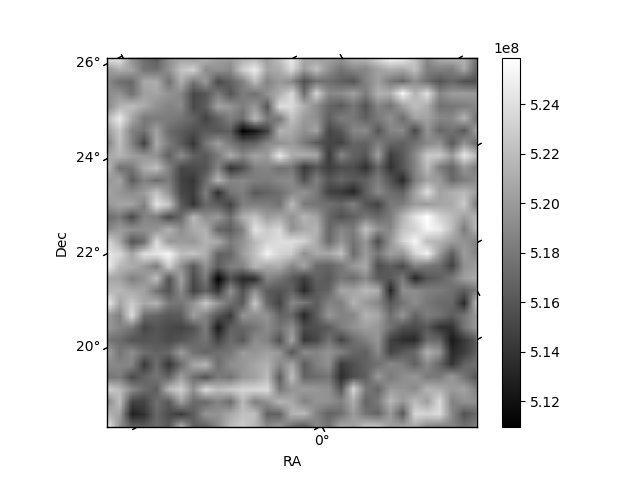
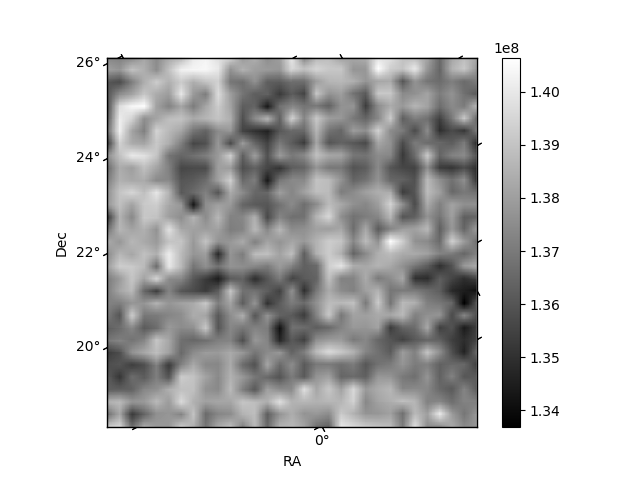
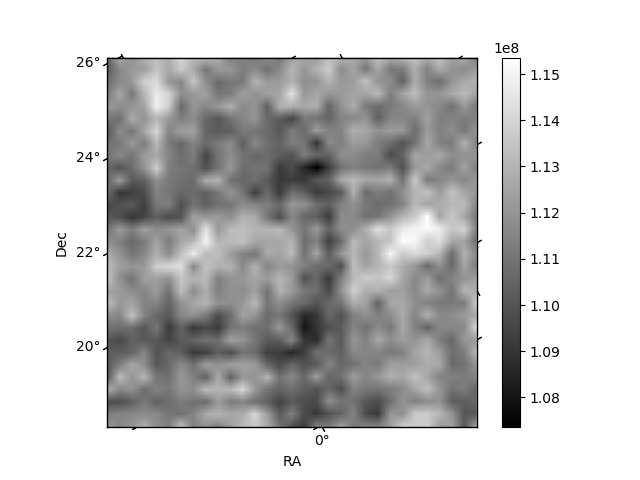
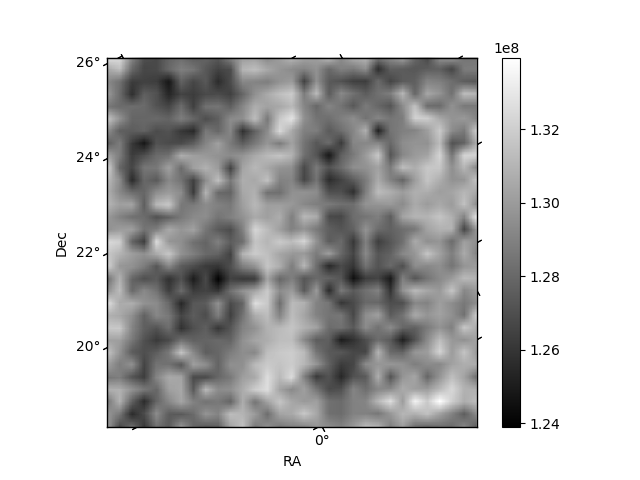
Histogram calculated using DETX and DETY for each event in the final _common_clean file
| Quadrant A | 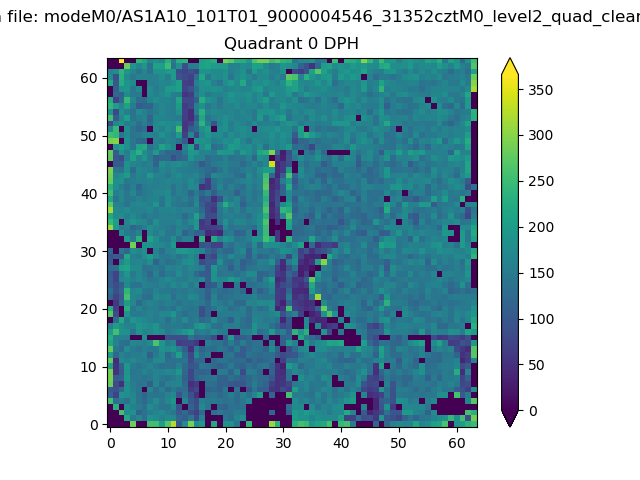 |
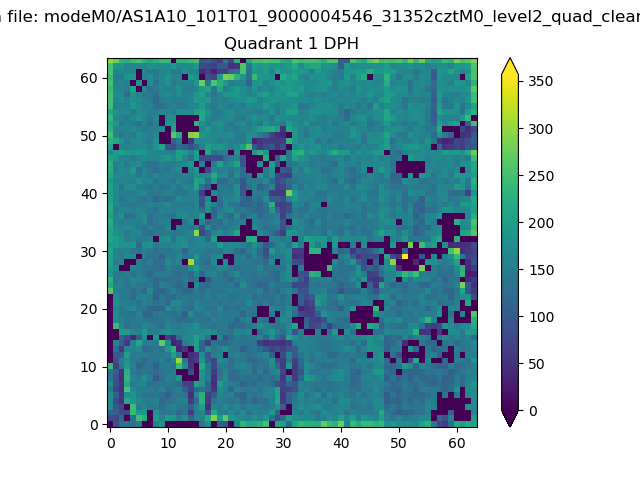 |
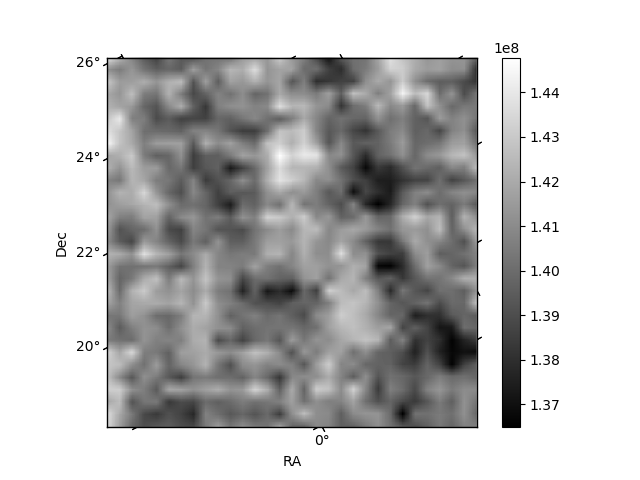
Quadrant B |
|---|---|---|---|
| Quadrant D | 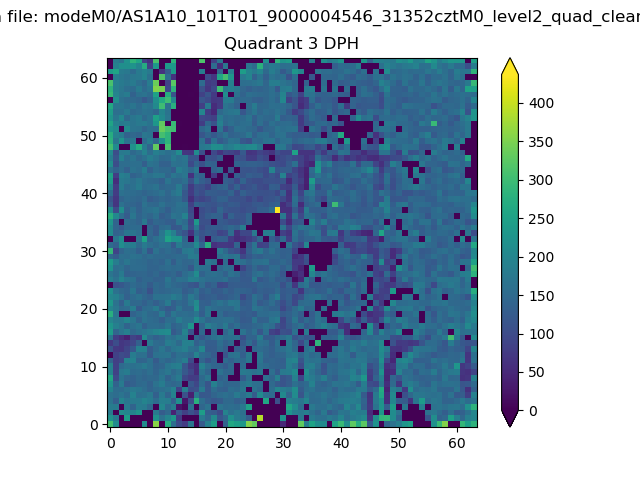 |
 |
Quadrant C |
| Plot type | Count rate plots | Images |
|---|---|---|
| Comparison with Poisson distribution Blue bars denote a histogram of data divided into 1 sec bins. Red curve is a Poisson curve with rate = median count rate of data. |
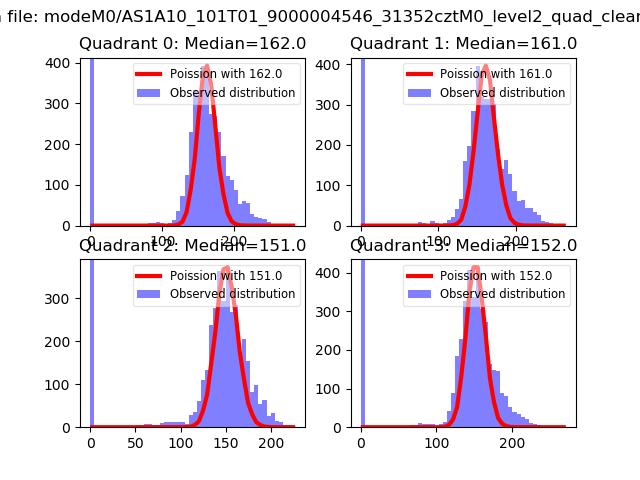 |
 |
| Quadrant-wise count rates Data is divided into 100 sec bins |
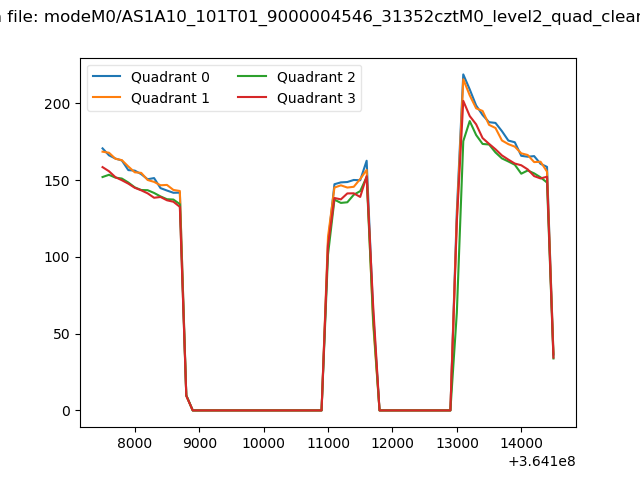 |
|
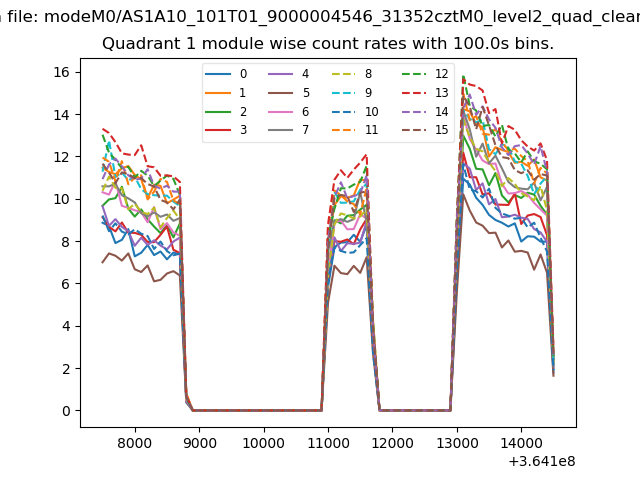
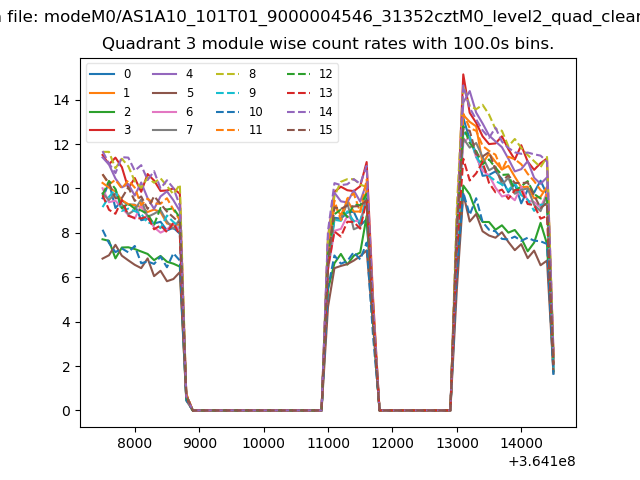
| Module-wise count rates for Quadrant A Data is divided into 100 sec bins |
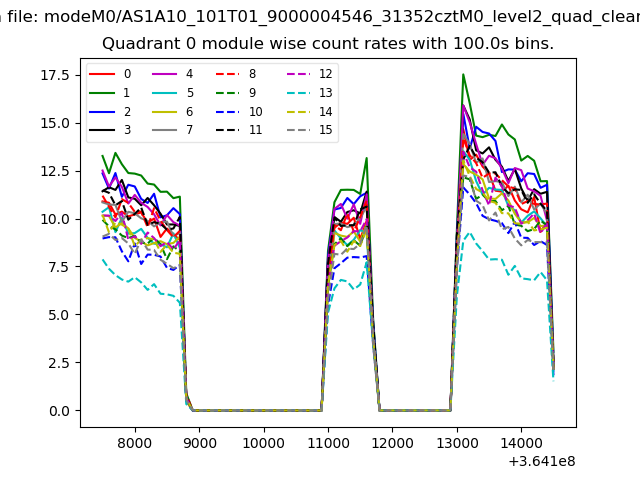 |
 |
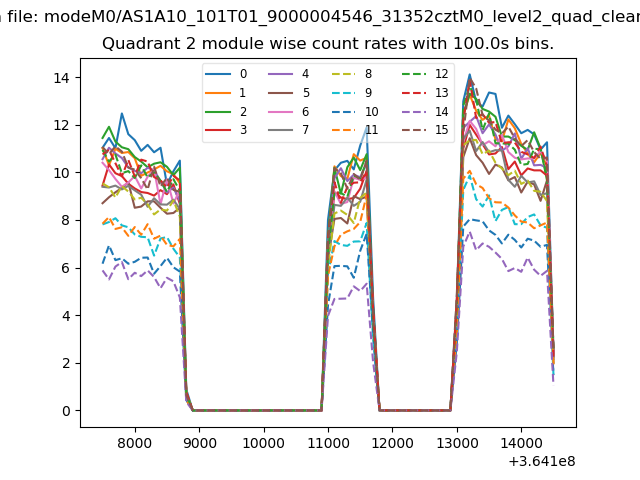
| Module-wise count rates for Quadrant B Data is divided into 100 sec bins |
 |
 |
| Module-wise count rates for Quadrant C Data is divided into 100 sec bins |
 |
 |
| Module-wise count rates for Quadrant D Data is divided into 100 sec bins |
 |
 |
| Parameter | Plot |
|---|---|
| CZT HV Monitor | 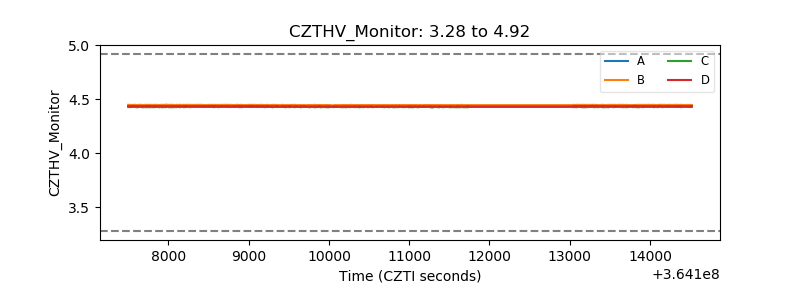 |
| D_VDD | 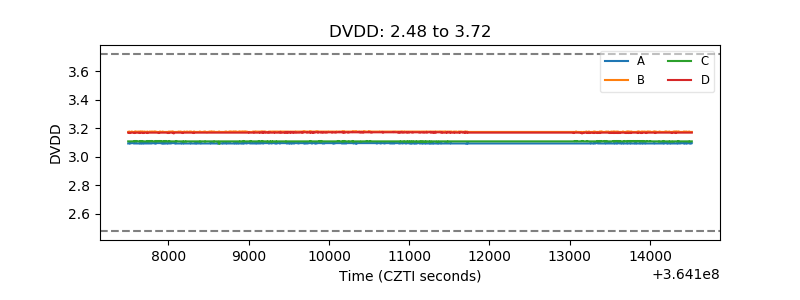 |
| Temperature 1 | 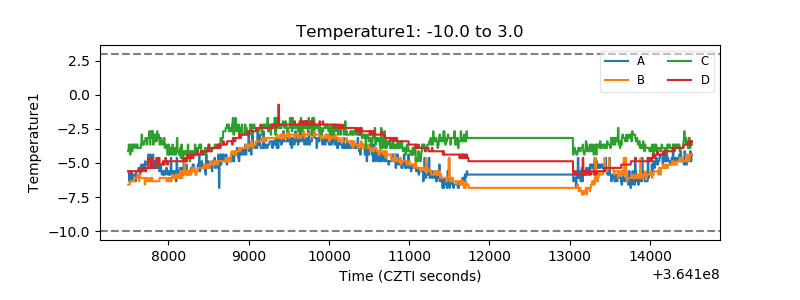 |
| Veto HV Monitor | 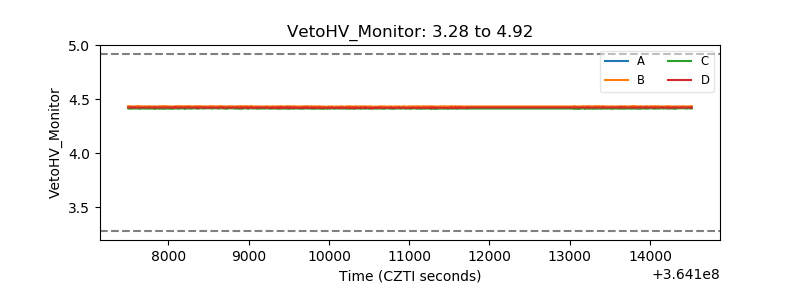 |
| Veto LLD | 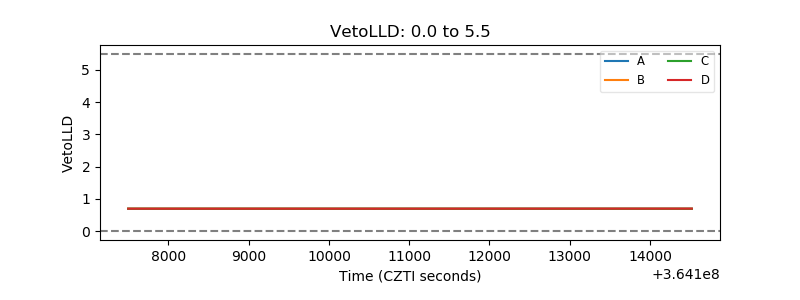 |
| Alpha Counter | 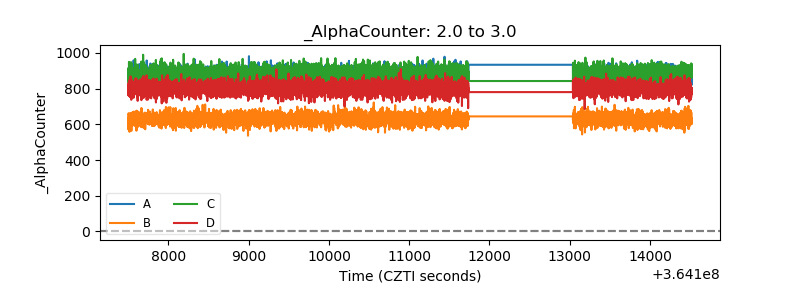 |
| _CPM_Rate | 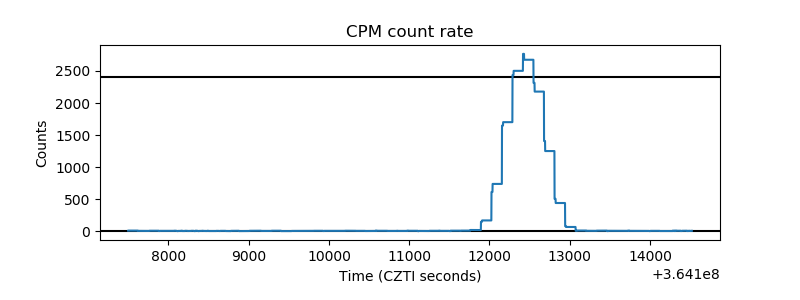 |
| CZT Counter | 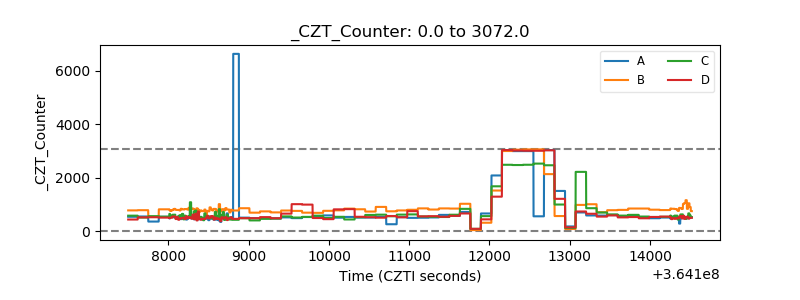 |
| +2.5 Volts monitor | 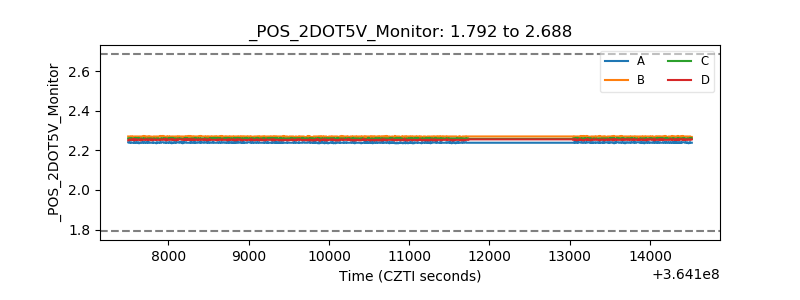 |
| +5 Volts monitor |  |
| _ROLL_ROT | 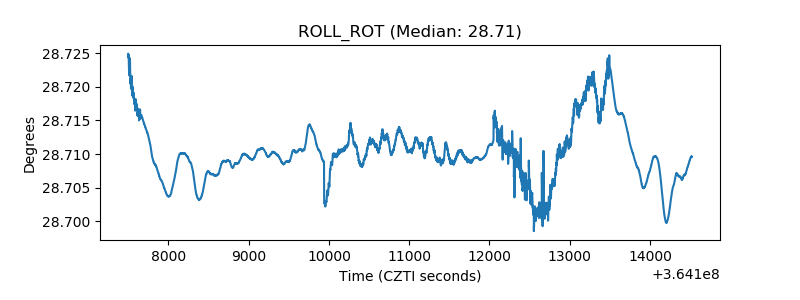 |
| _Roll_DEC | 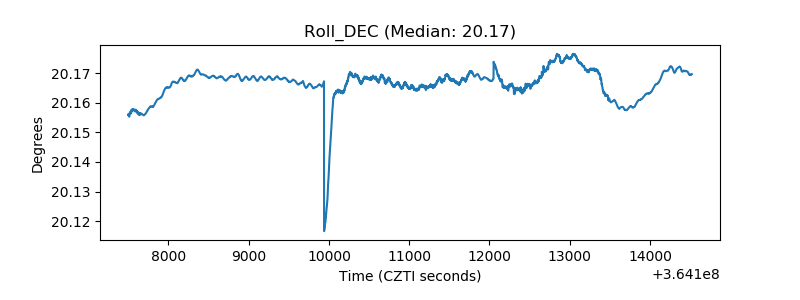 |
| _Roll_RA | 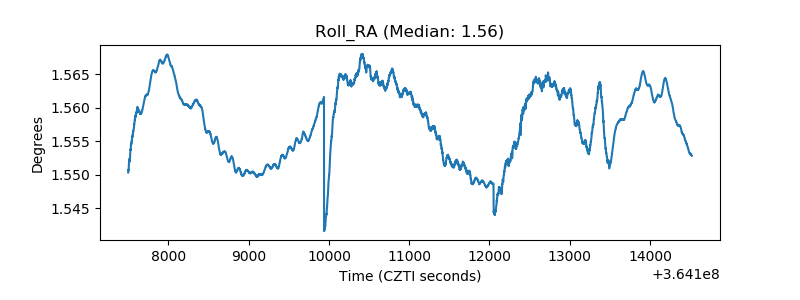 |
| Veto Counter | 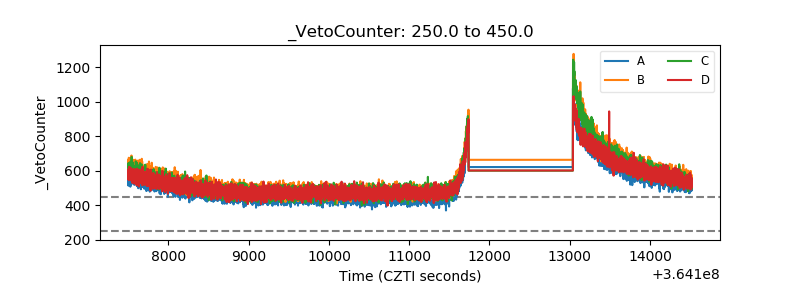 |