| Param | Original file | Final file |
|---|---|---|
| Filename | modeM0/AS1A10_101T01_9000004546_31353cztM0_level2.evt | modeM0/AS1A10_101T01_9000004546_31353cztM0_level2_quad_clean.evt |
| Size (bytes) | 2,140,718,400 | 341,795,520 |
| Size | 2.0 GB | 326.0 MB |
| Events in quadrant A | 13,073,408 | 2,212,961 |
| Events in quadrant B | 20,346,353 | 2,206,022 |
| Events in quadrant C | 15,099,609 | 2,066,369 |
| Events in quadrant D | 14,569,088 | 2,086,035 |
| Mode M0 | |||
|---|---|---|---|
| Quadrant | BADHDUFLAG | Total packets | Discarded packets |
| A | 0 | 54453 | 6 |
| B | 0 | 79394 | 5 |
| C | 0 | 61317 | 5 |
| D | 0 | 59756 | 5 |
| Mode SS | |||
|---|---|---|---|
| Quadrant | BADHDUFLAG | Total packets | Discarded packets |
| A | 0 | 528 | 0 |
| B | 0 | 528 | 0 |
| C | 0 | 528 | 0 |
| D | 0 | 528 | 0 |
| Mode M9 | |||
|---|---|---|---|
| Quadrant | BADHDUFLAG | Total packets | Discarded packets |
| A | 0 | 60 | 0 |
| B | 0 | 60 | 0 |
| C | 0 | 60 | 0 |
| D | 0 | 60 | 0 |
| Quadrant | Total seconds | Saturated seconds | Saturation percentage |
|---|---|---|---|
| A | 25893 | 234 | 0.903719% |
| B | 25894 | 548 | 2.116320% |
| C | 25894 | 966 | 3.730594% |
| D | 25894 | 193 | 0.745346% |
Noise dominated data is calculated using 1-second bins in cleaned event files. If a bin has >2000 counts, and if more than 50% of those come from <1% of pixels, then it is considered to be noise-dominated and hence unusable.
| Quadrant | # 1 sec bins | Bins with >0 counts | Bins with >2000 counts | High rate bins dominated by noise | Noise dominated (total time) | Noise dominated (detector-on time) | Marked lightcurve |
|---|---|---|---|---|---|---|---|
| A | 31873 | 25898 | 0 | 0 | 0.00% | 0.00% | 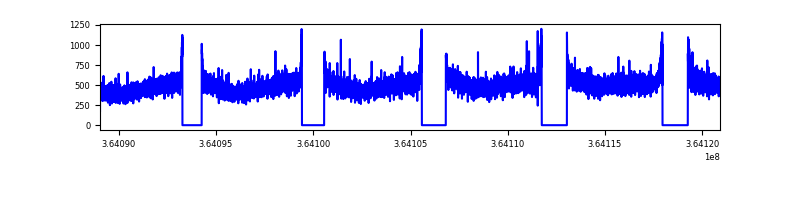 |
| B | 31874 | 25899 | 44 | 44 | 0.14% | 0.17% | 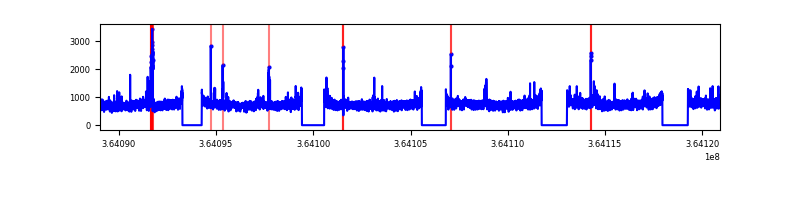 |
| C | 31874 | 25899 | 112 | 112 | 0.35% | 0.43% |  |
| D | 31874 | 25899 | 6 | 6 | 0.02% | 0.02% | 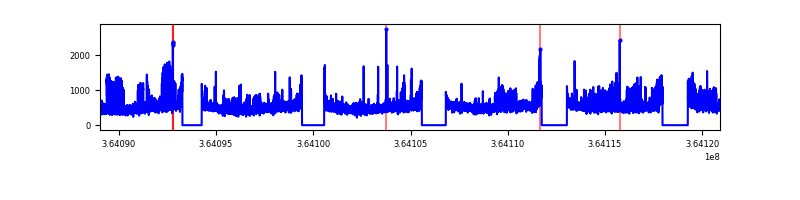 |
Top three noisy pixels from each quadrant. If the there are fewer than three noisy pixels in the level2.evt file, extra rows are filled as -1
| Pixel properties | Quadrant properties | ||||||
|---|---|---|---|---|---|---|---|
| Quadrant | DetID | PixID | Counts | Sigma | Mean | Median | Sigma |
| A | 13 | 254 | 54428 | 76.5 | 3388 | 3329 | 668.0 |
| A | 3 | 137 | 32789 | 44.1 | 3388 | 3329 | 668.0 |
| A | 0 | 226 | 28672 | 37.94 | 3388 | 3329 | 668.0 |
| B | 6 | 159 | 6897437 | 11048.98 | 3311 | 3234 | 624.0 |
| B | 0 | 190 | 187906 | 295.96 | 3311 | 3234 | 624.0 |
| B | 15 | 33 | 180431 | 283.98 | 3311 | 3234 | 624.0 |
| C | 3 | 233 | 1186818 | 1638.62 | 3148 | 3174 | 722.3 |
| C | 0 | 10 | 658529 | 907.26 | 3148 | 3174 | 722.3 |
| C | 14 | 238 | 641205 | 883.28 | 3148 | 3174 | 722.3 |
| D | 8 | 195 | 2158365 | 2863.54 | 3234 | 3162 | 752.6 |
| D | 2 | 250 | 107165 | 138.19 | 3234 | 3162 | 752.6 |
| D | 2 | 234 | 97066 | 124.77 | 3234 | 3162 | 752.6 |
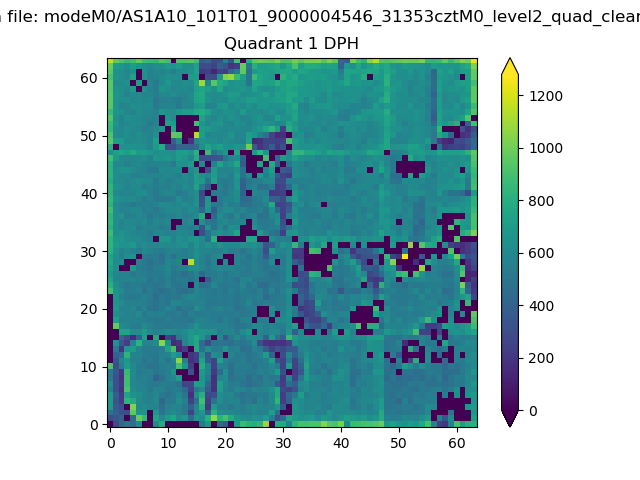
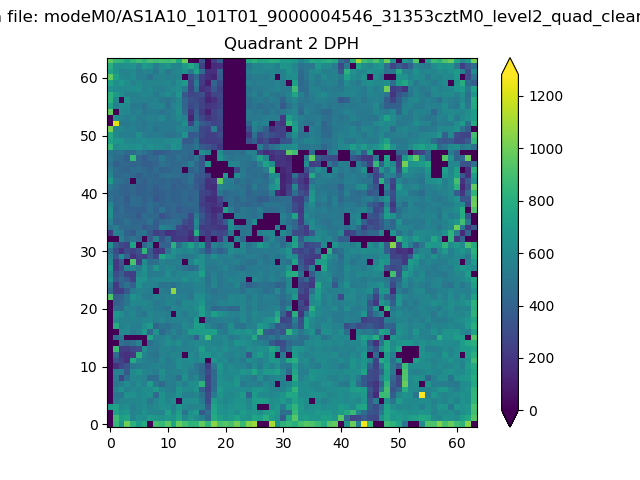
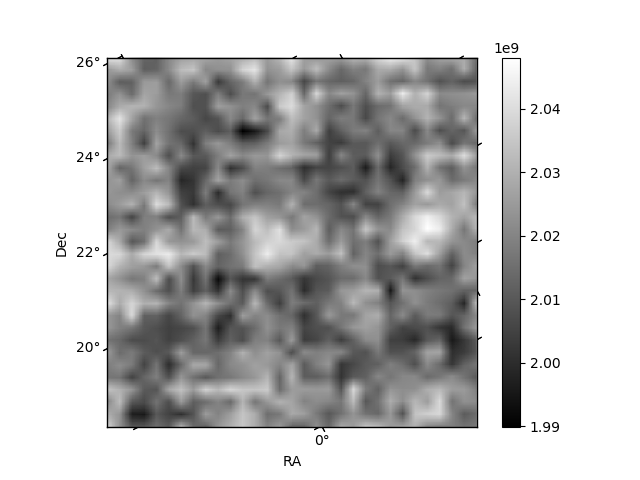
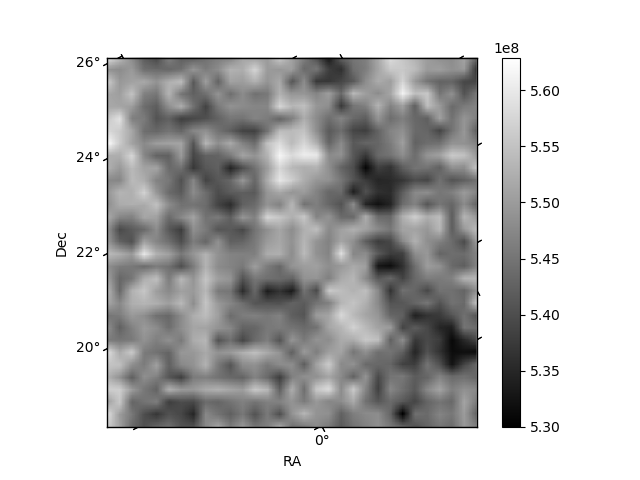
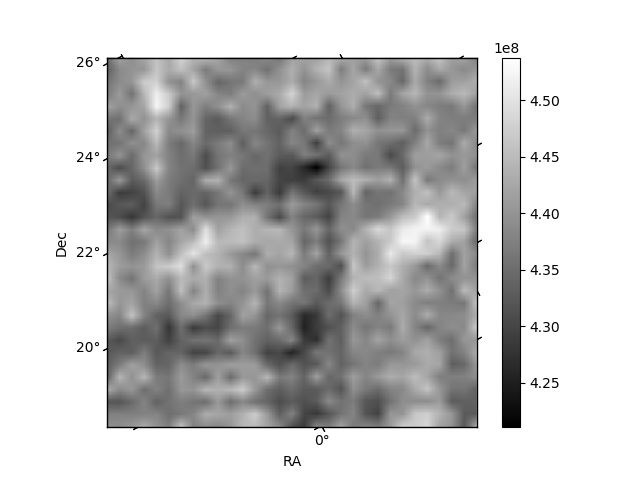
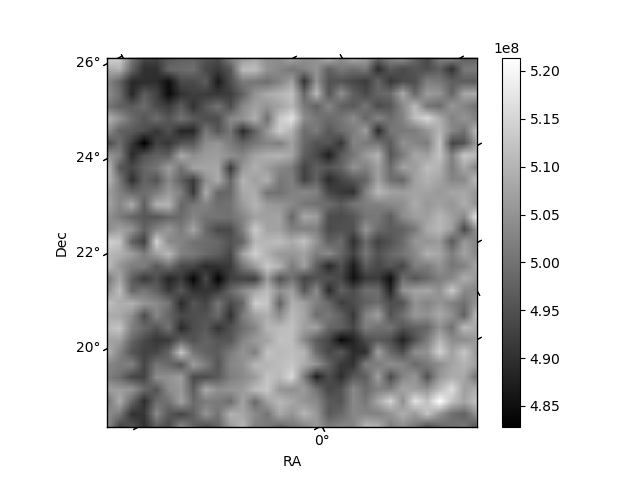
Histogram calculated using DETX and DETY for each event in the final _common_clean file
| Quadrant A | 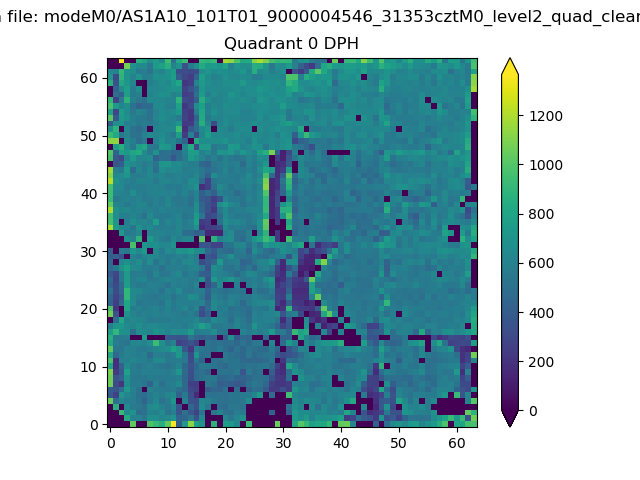 |
 |
Quadrant B |
|---|---|---|---|
| Quadrant D | 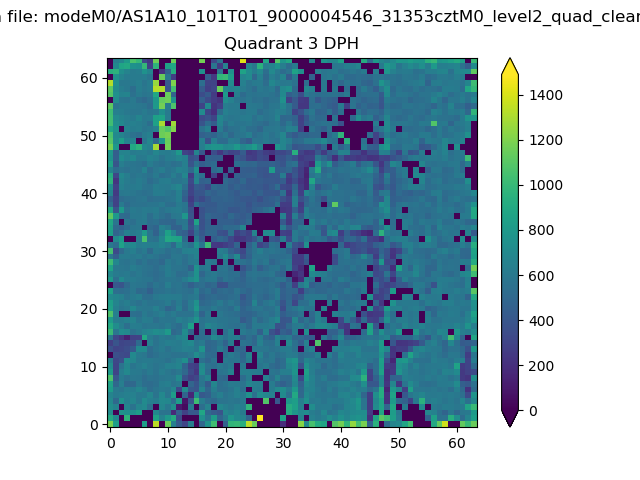 |
 |
Quadrant C |
| Plot type | Count rate plots | Images |
|---|---|---|
| Comparison with Poisson distribution Blue bars denote a histogram of data divided into 1 sec bins. Red curve is a Poisson curve with rate = median count rate of data. |
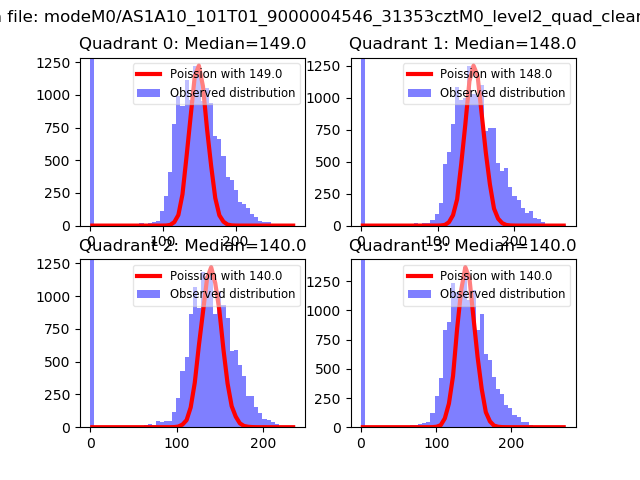 |
 |
| Quadrant-wise count rates Data is divided into 100 sec bins |
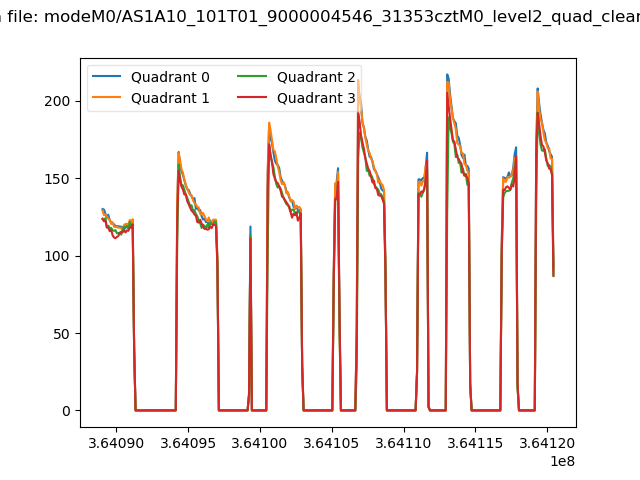 |
|
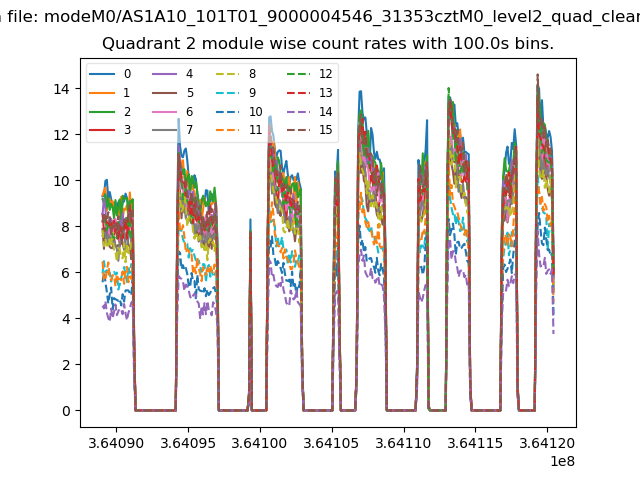
| Module-wise count rates for Quadrant A Data is divided into 100 sec bins |
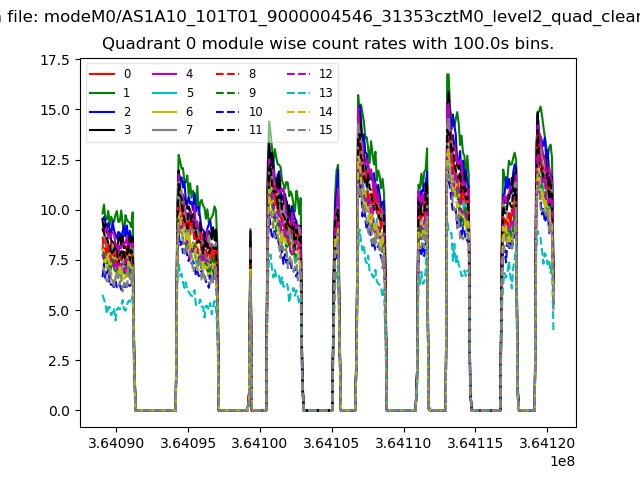 |
 |
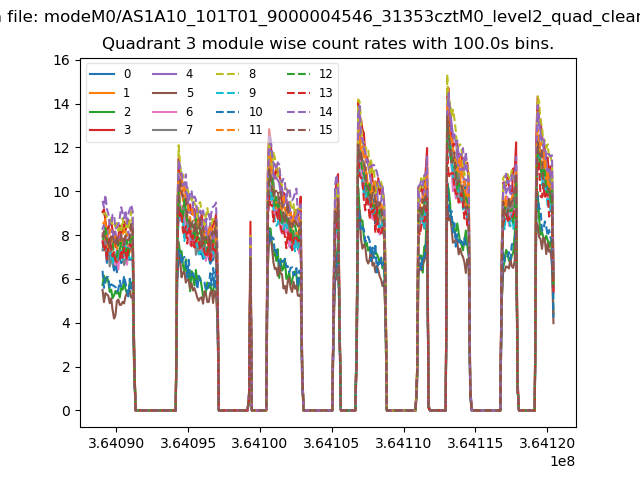
| Module-wise count rates for Quadrant B Data is divided into 100 sec bins |
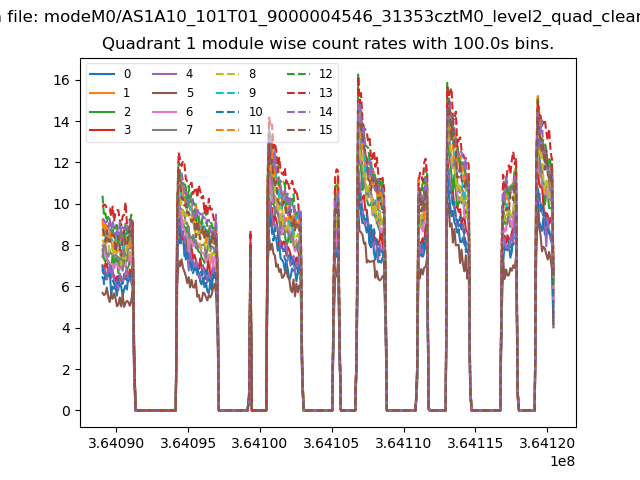 |
 |
| Module-wise count rates for Quadrant C Data is divided into 100 sec bins |
 |
 |
| Module-wise count rates for Quadrant D Data is divided into 100 sec bins |
 |
 |
| Parameter | Plot |
|---|---|
| CZT HV Monitor |  |
| D_VDD | 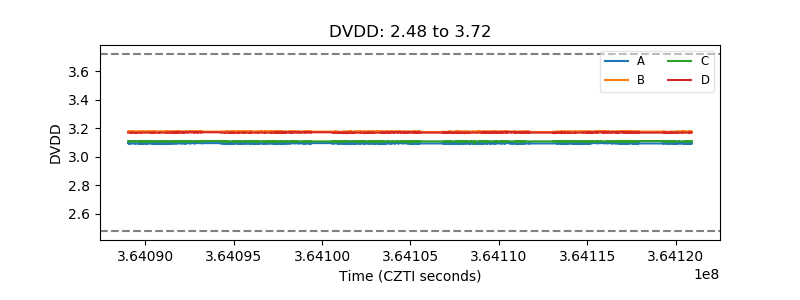 |
| Temperature 1 | 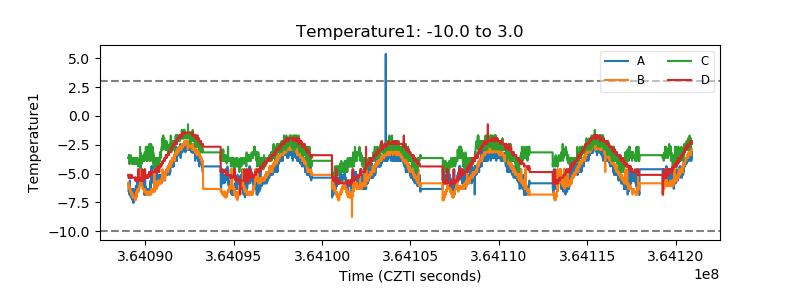 |
| Veto HV Monitor | 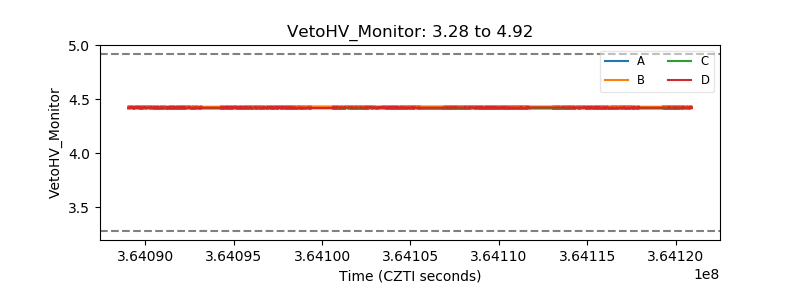 |
| Veto LLD | 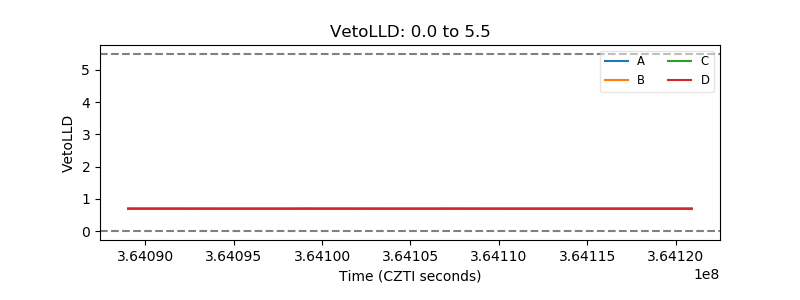 |
| Alpha Counter | 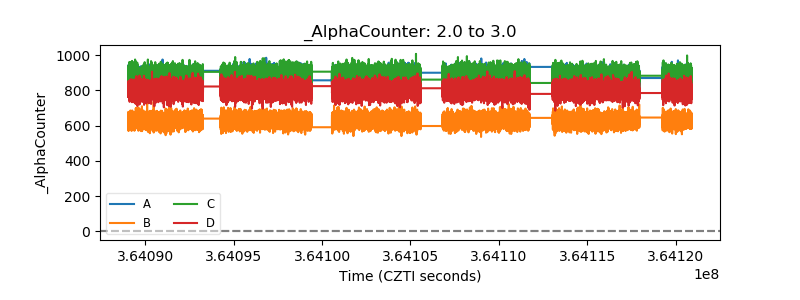 |
| _CPM_Rate | 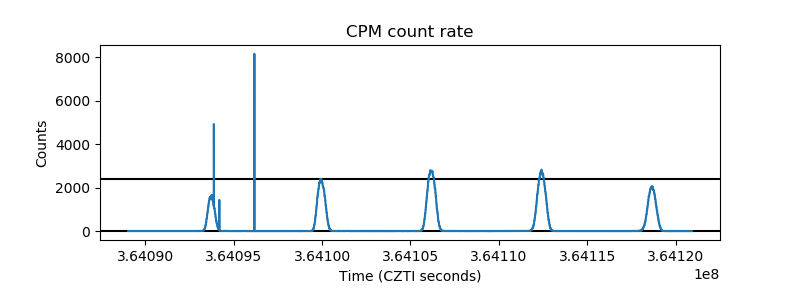 |
| CZT Counter | 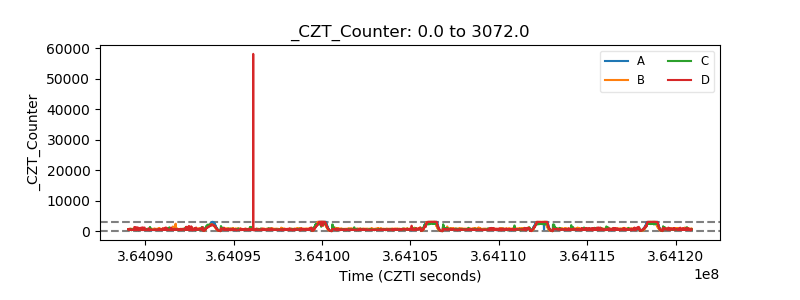 |
| +2.5 Volts monitor | 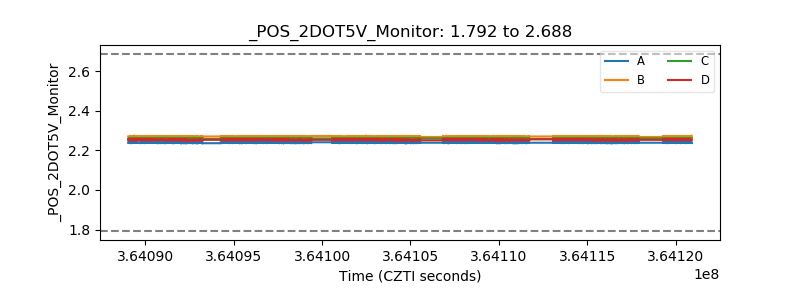 |
| +5 Volts monitor |  |
| _ROLL_ROT | 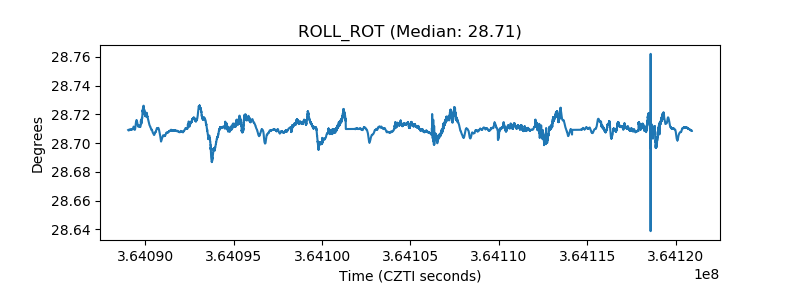 |
| _Roll_DEC | 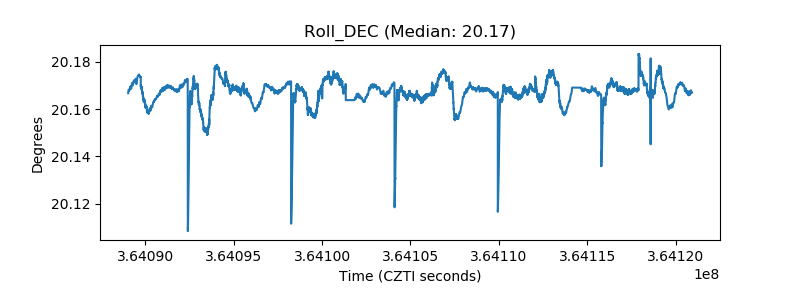 |
| _Roll_RA | 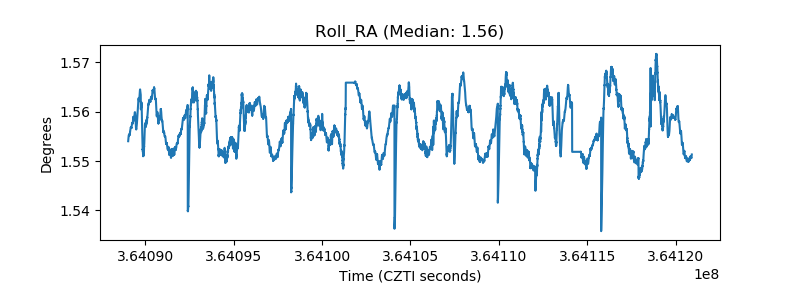 |
| Veto Counter | 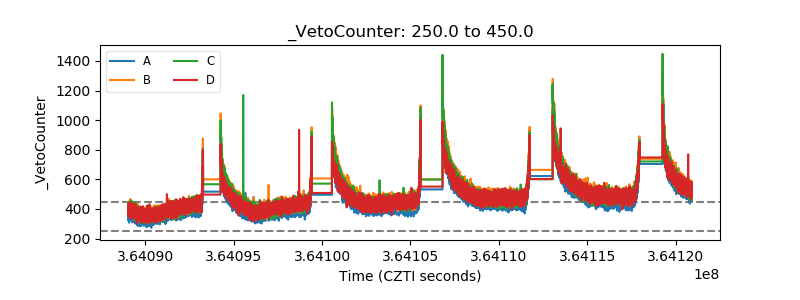 |