| Param | Original file | Final file |
|---|---|---|
| Filename | modeM0/AS1A10_101T01_9000004546_31354cztM0_level2.evt | modeM0/AS1A10_101T01_9000004546_31354cztM0_level2_quad_clean.evt |
| Size (bytes) | 532,762,560 | 79,320,960 |
| Size | 508.1 MB | 75.6 MB |
| Events in quadrant A | 3,318,629 | 511,765 |
| Events in quadrant B | 5,074,259 | 506,443 |
| Events in quadrant C | 3,518,051 | 468,852 |
| Events in quadrant D | 3,802,477 | 480,639 |
| Mode M0 | |||
|---|---|---|---|
| Quadrant | BADHDUFLAG | Total packets | Discarded packets |
| A | 0 | 13140 | 1 |
| B | 0 | 19227 | 2 |
| C | 0 | 13939 | 1 |
| D | 0 | 15063 | 1 |
| Mode SS | |||
|---|---|---|---|
| Quadrant | BADHDUFLAG | Total packets | Discarded packets |
| A | 0 | 126 | 0 |
| B | 0 | 126 | 0 |
| C | 0 | 126 | 0 |
| D | 0 | 126 | 0 |
| Mode M9 | |||
|---|---|---|---|
| Quadrant | BADHDUFLAG | Total packets | Discarded packets |
| A | 0 | 13 | 0 |
| B | 0 | 13 | 0 |
| C | 0 | 13 | 0 |
| D | 0 | 13 | 0 |
| Quadrant | Total seconds | Saturated seconds | Saturation percentage |
|---|---|---|---|
| A | 6223 | 87 | 1.398040% |
| B | 6222 | 159 | 2.555448% |
| C | 6222 | 240 | 3.857281% |
| D | 6223 | 66 | 1.060582% |
Noise dominated data is calculated using 1-second bins in cleaned event files. If a bin has >2000 counts, and if more than 50% of those come from <1% of pixels, then it is considered to be noise-dominated and hence unusable.
| Quadrant | # 1 sec bins | Bins with >0 counts | Bins with >2000 counts | High rate bins dominated by noise | Noise dominated (total time) | Noise dominated (detector-on time) | Marked lightcurve |
|---|---|---|---|---|---|---|---|
| A | 7498 | 6224 | 0 | 0 | 0.00% | 0.00% | 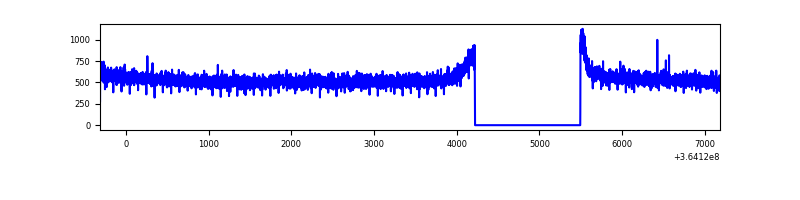 |
| B | 7497 | 6223 | 5 | 5 | 0.07% | 0.08% | 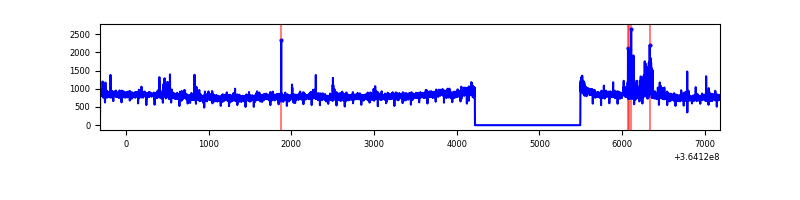 |
| C | 7497 | 6223 | 9 | 9 | 0.12% | 0.14% | 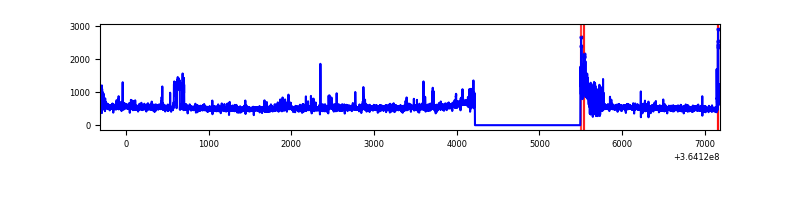 |
| D | 7498 | 6224 | 4 | 4 | 0.05% | 0.06% | 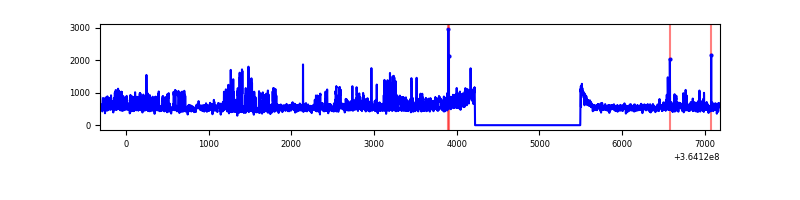 |
Top three noisy pixels from each quadrant. If the there are fewer than three noisy pixels in the level2.evt file, extra rows are filled as -1
| Pixel properties | Quadrant properties | ||||||
|---|---|---|---|---|---|---|---|
| Quadrant | DetID | PixID | Counts | Sigma | Mean | Median | Sigma |
| A | 13 | 254 | 14605 | 80.4 | 859 | 845 | 171.1 |
| A | 3 | 137 | 8151 | 42.69 | 859 | 845 | 171.1 |
| A | 0 | 226 | 7450 | 38.6 | 859 | 845 | 171.1 |
| B | 6 | 159 | 1661664 | 10541.68 | 830 | 810 | 157.6 |
| B | 0 | 190 | 124040 | 782.16 | 830 | 810 | 157.6 |
| B | 12 | 111 | 18835 | 114.41 | 830 | 810 | 157.6 |
| C | 3 | 233 | 171516 | 947.59 | 785 | 791 | 180.2 |
| C | 14 | 238 | 158359 | 874.57 | 785 | 791 | 180.2 |
| C | 0 | 10 | 54537 | 298.31 | 785 | 791 | 180.2 |
| D | 8 | 195 | 641975 | 3320.79 | 823 | 805 | 193.1 |
| D | 2 | 234 | 26441 | 132.78 | 823 | 805 | 193.1 |
| D | 2 | 250 | 23610 | 118.11 | 823 | 805 | 193.1 |
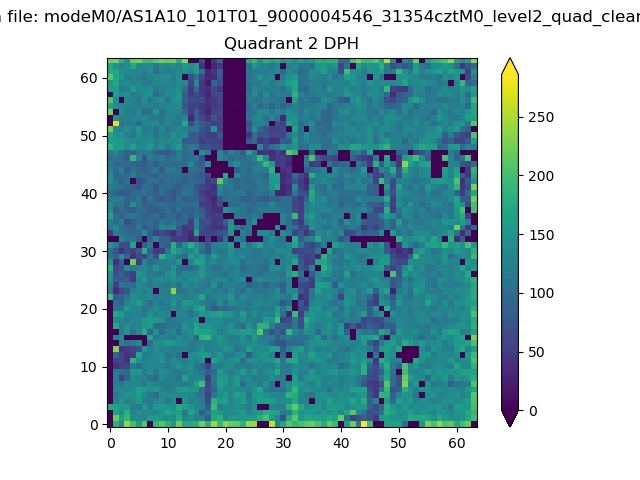
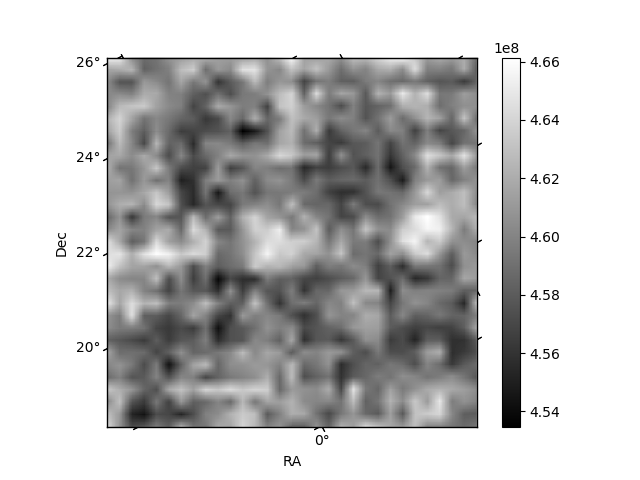
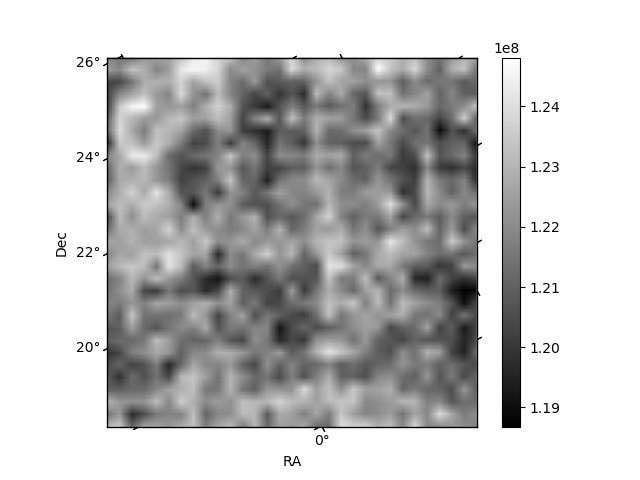
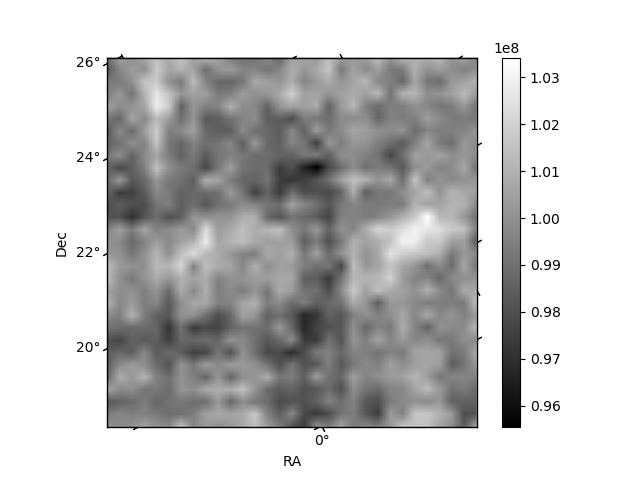
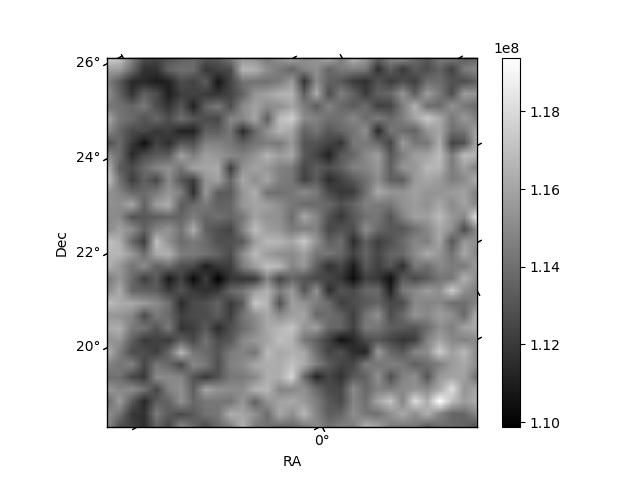
Histogram calculated using DETX and DETY for each event in the final _common_clean file
| Quadrant A | 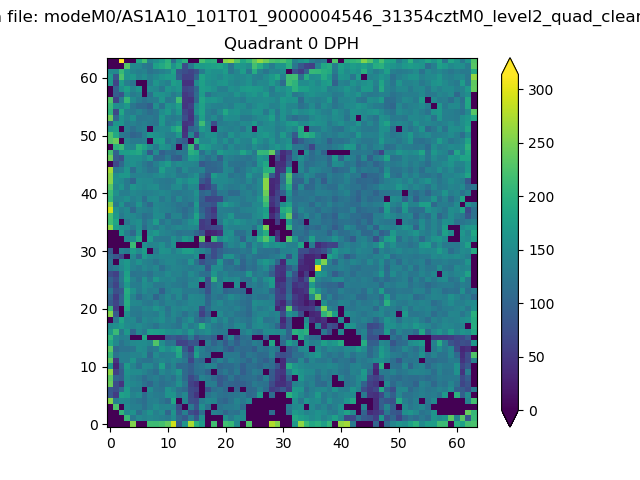 |
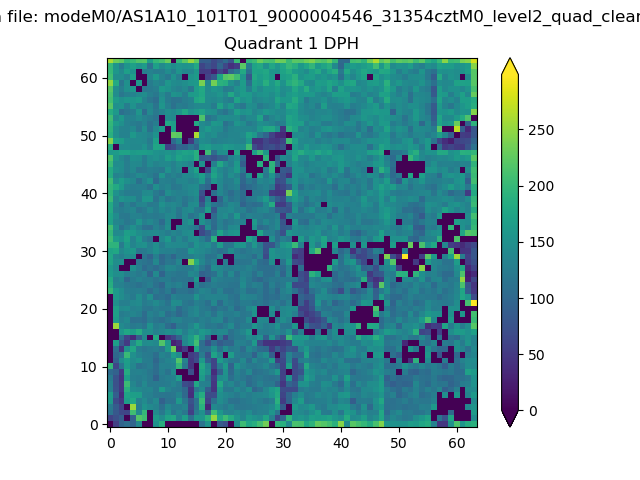 |
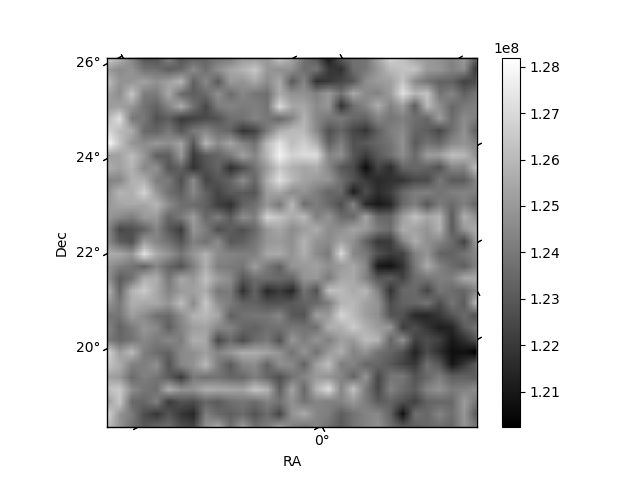
Quadrant B |
|---|---|---|---|
| Quadrant D | 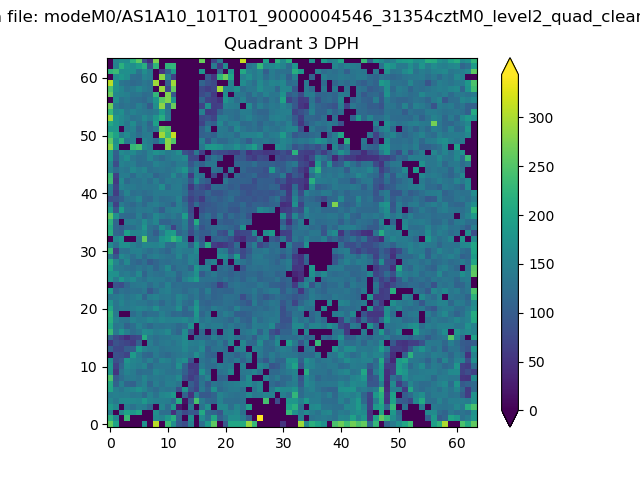 |
 |
Quadrant C |
| Plot type | Count rate plots | Images |
|---|---|---|
| Comparison with Poisson distribution Blue bars denote a histogram of data divided into 1 sec bins. Red curve is a Poisson curve with rate = median count rate of data. |
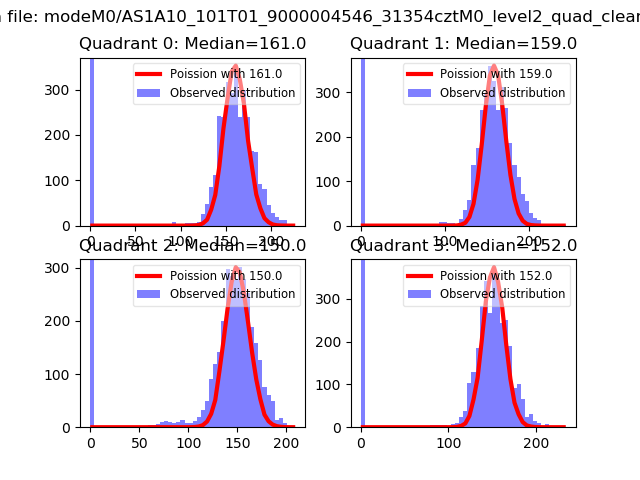 |
 |
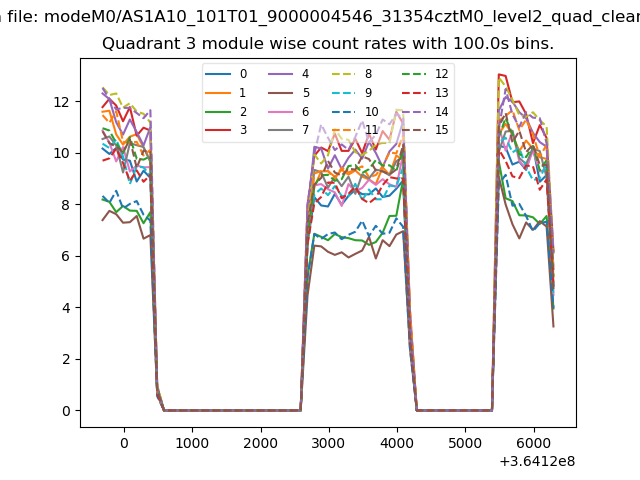
| Quadrant-wise count rates Data is divided into 100 sec bins |
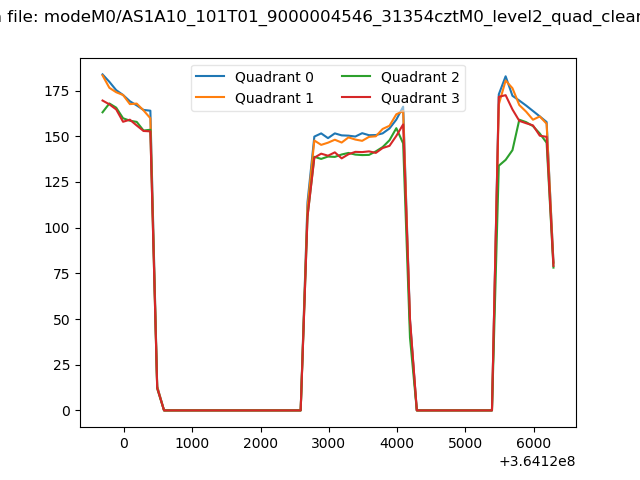 |
|
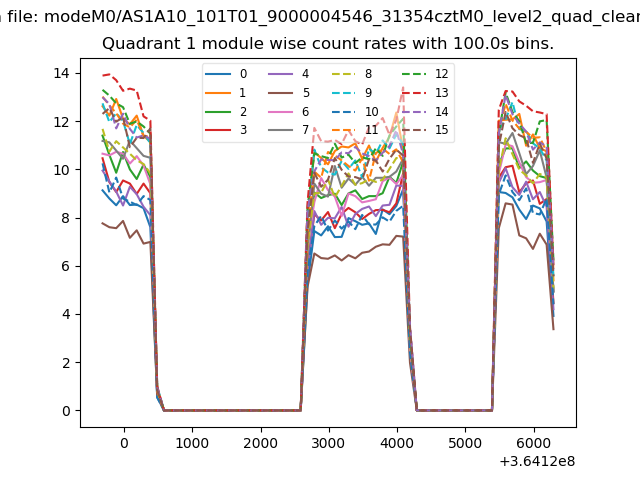
| Module-wise count rates for Quadrant A Data is divided into 100 sec bins |
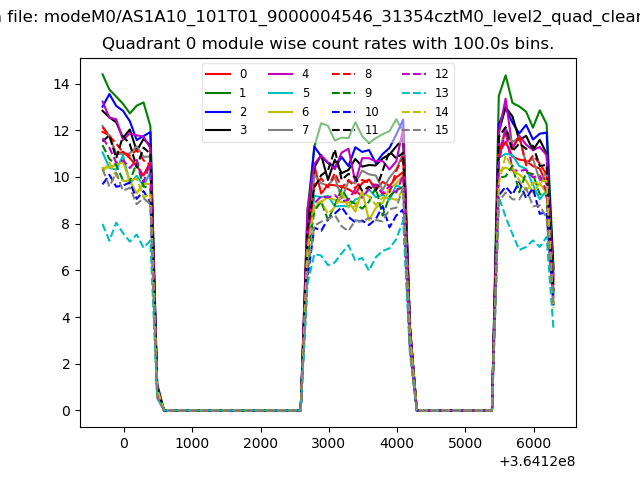 |
 |
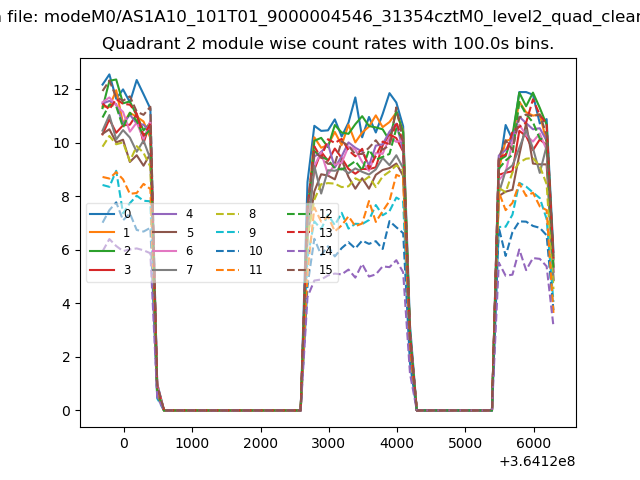
| Module-wise count rates for Quadrant B Data is divided into 100 sec bins |
 |
 |
| Module-wise count rates for Quadrant C Data is divided into 100 sec bins |
 |
 |
| Module-wise count rates for Quadrant D Data is divided into 100 sec bins |
 |
 |
| Parameter | Plot |
|---|---|
| CZT HV Monitor | 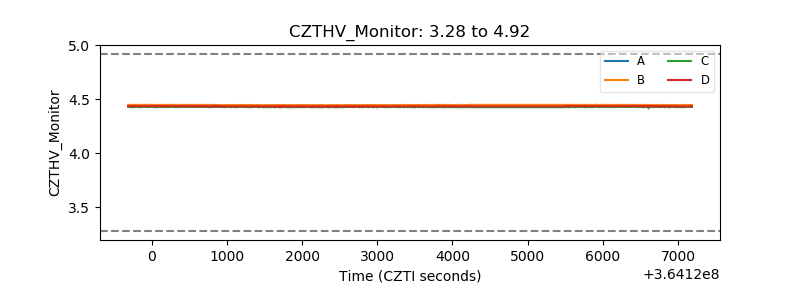 |
| D_VDD | 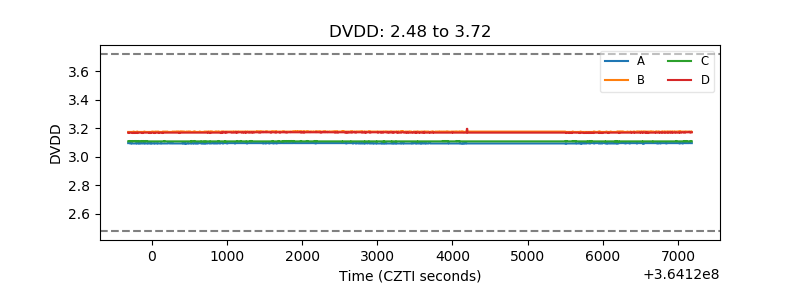 |
| Temperature 1 | 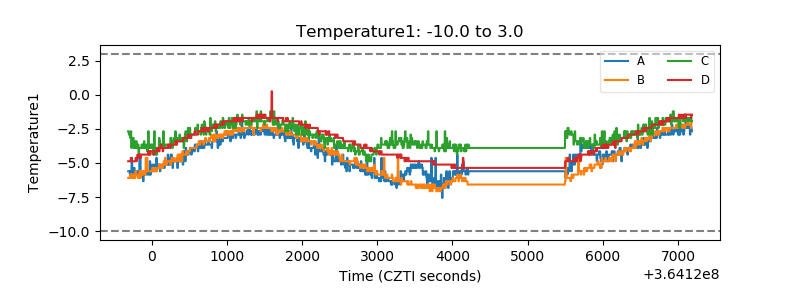 |
| Veto HV Monitor | 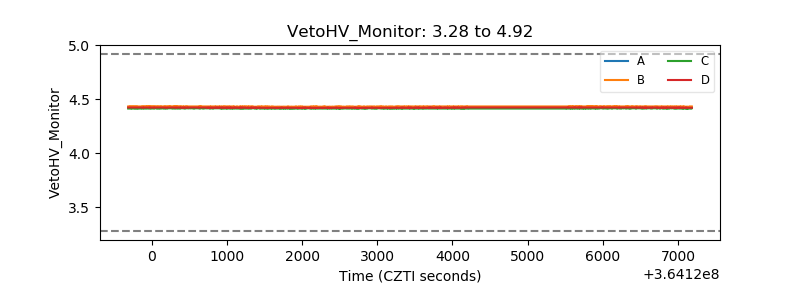 |
| Veto LLD | 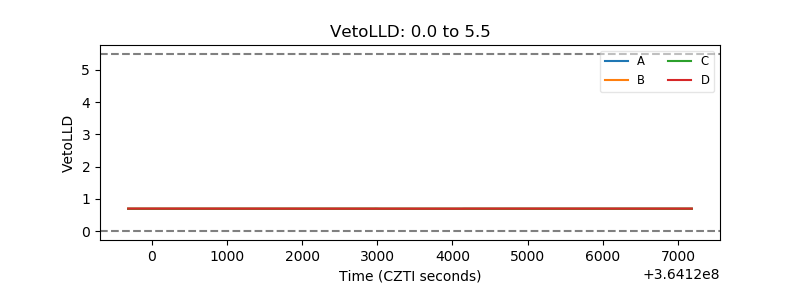 |
| Alpha Counter | 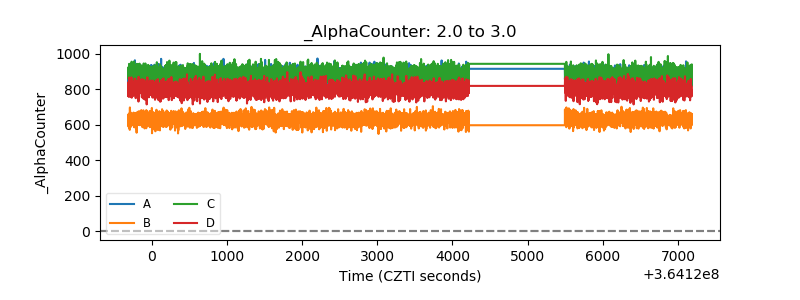 |
| _CPM_Rate | 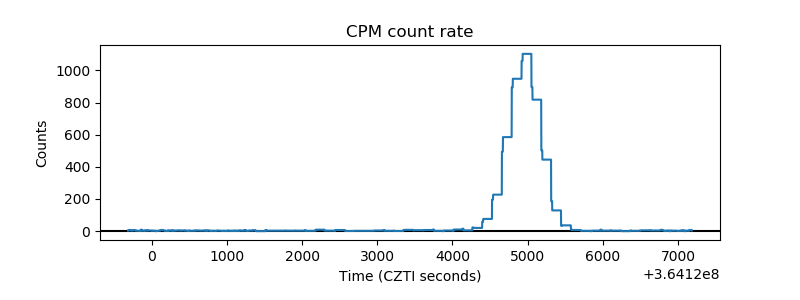 |
| CZT Counter | 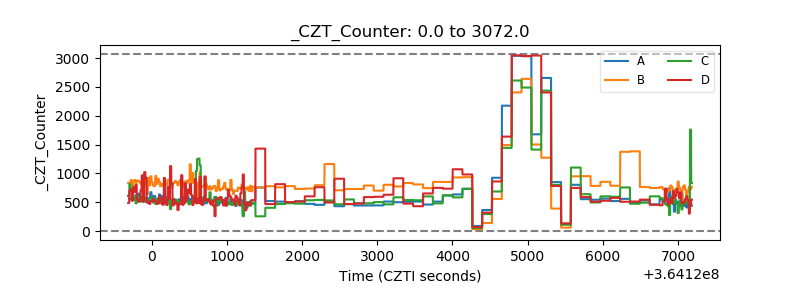 |
| +2.5 Volts monitor | 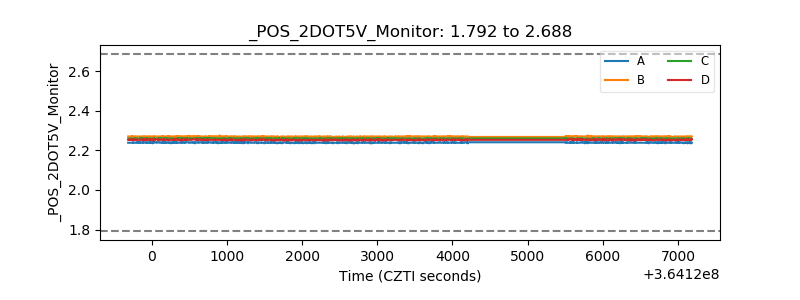 |
| +5 Volts monitor |  |
| _ROLL_ROT | 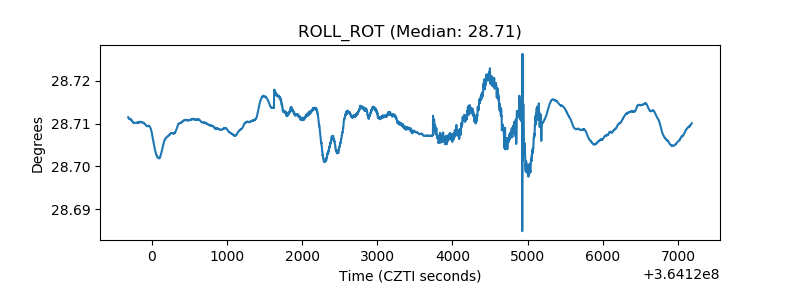 |
| _Roll_DEC | 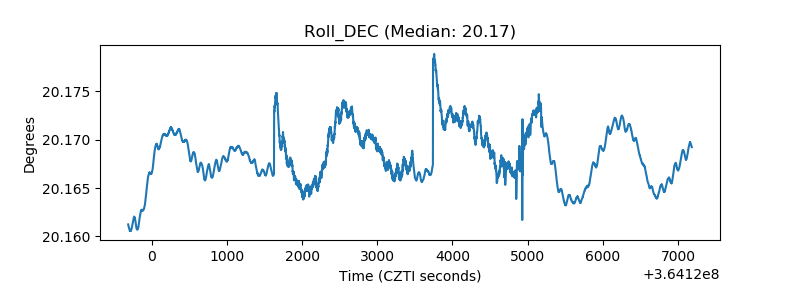 |
| _Roll_RA | 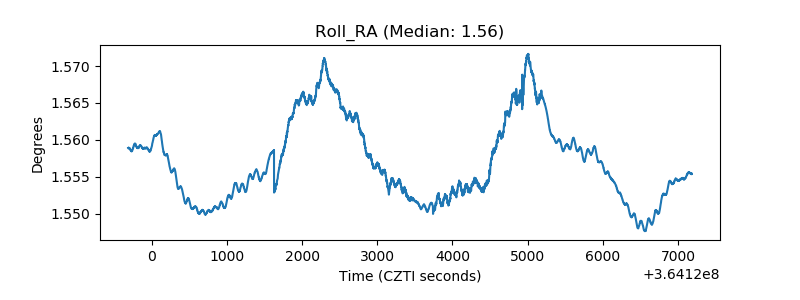 |
| Veto Counter | 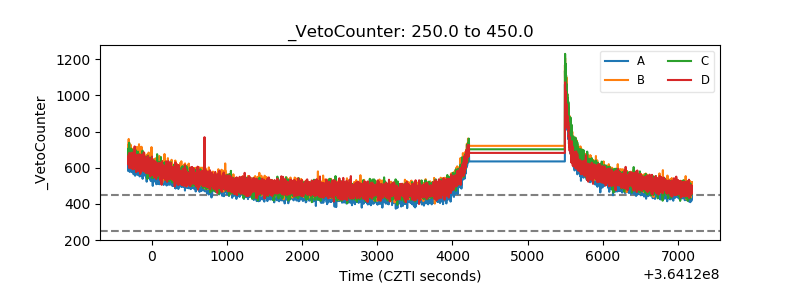 |