| Param | Original file | Final file |
|---|---|---|
| Filename | modeM0/AS1A10_101T01_9000004546_31355cztM0_level2.evt | modeM0/AS1A10_101T01_9000004546_31355cztM0_level2_quad_clean.evt |
| Size (bytes) | 560,718,720 | 79,125,120 |
| Size | 534.7 MB | 75.5 MB |
| Events in quadrant A | 3,440,904 | 499,756 |
| Events in quadrant B | 5,446,573 | 493,085 |
| Events in quadrant C | 3,647,216 | 466,735 |
| Events in quadrant D | 3,995,242 | 471,530 |
| Mode M0 | |||
|---|---|---|---|
| Quadrant | BADHDUFLAG | Total packets | Discarded packets |
| A | 0 | 13923 | 1 |
| B | 0 | 20837 | 1 |
| C | 0 | 14625 | 1 |
| D | 0 | 16028 | 1 |
| Mode SS | |||
|---|---|---|---|
| Quadrant | BADHDUFLAG | Total packets | Discarded packets |
| A | 0 | 136 | 0 |
| B | 0 | 136 | 0 |
| C | 0 | 136 | 0 |
| D | 0 | 136 | 0 |
| Mode M9 | |||
|---|---|---|---|
| Quadrant | BADHDUFLAG | Total packets | Discarded packets |
| A | 0 | 10 | 0 |
| B | 0 | 10 | 0 |
| C | 0 | 10 | 0 |
| D | 0 | 10 | 0 |
| Quadrant | Total seconds | Saturated seconds | Saturation percentage |
|---|---|---|---|
| A | 6663 | 111 | 1.665916% |
| B | 6663 | 217 | 3.256791% |
| C | 6664 | 256 | 3.841537% |
| D | 6664 | 114 | 1.710684% |
Noise dominated data is calculated using 1-second bins in cleaned event files. If a bin has >2000 counts, and if more than 50% of those come from <1% of pixels, then it is considered to be noise-dominated and hence unusable.
| Quadrant | # 1 sec bins | Bins with >0 counts | Bins with >2000 counts | High rate bins dominated by noise | Noise dominated (total time) | Noise dominated (detector-on time) | Marked lightcurve |
|---|---|---|---|---|---|---|---|
| A | 7698 | 6664 | 0 | 0 | 0.00% | 0.00% | 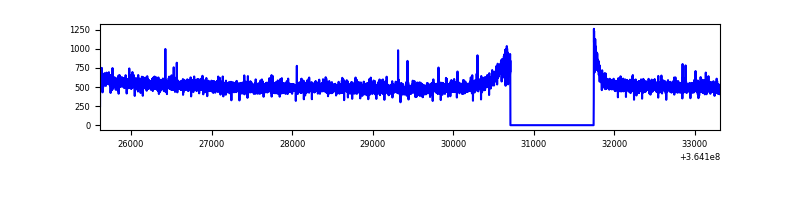 |
| B | 7698 | 6663 | 23 | 23 | 0.30% | 0.35% | 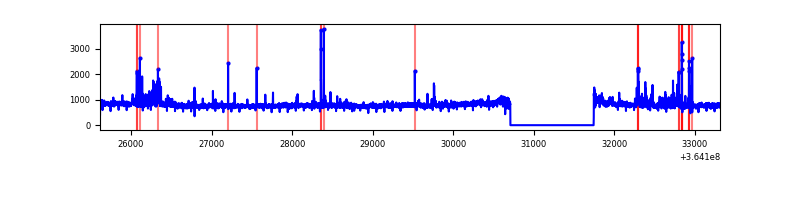 |
| C | 7699 | 6665 | 33 | 33 | 0.43% | 0.50% | 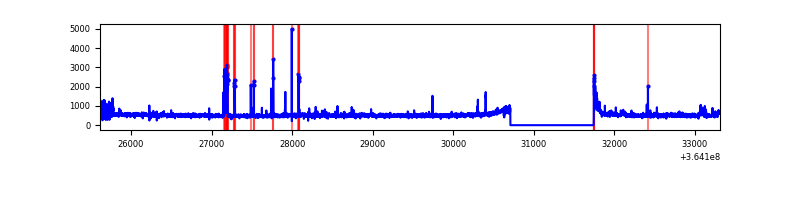 |
| D | 7699 | 6665 | 16 | 16 | 0.21% | 0.24% | 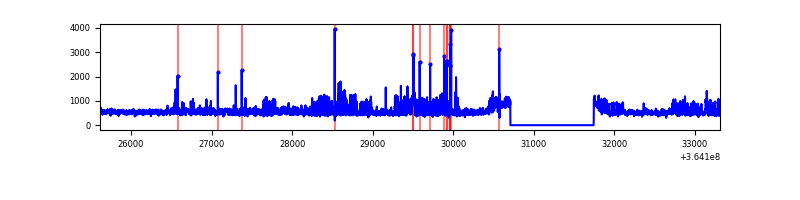 |
Top three noisy pixels from each quadrant. If the there are fewer than three noisy pixels in the level2.evt file, extra rows are filled as -1
| Pixel properties | Quadrant properties | ||||||
|---|---|---|---|---|---|---|---|
| Quadrant | DetID | PixID | Counts | Sigma | Mean | Median | Sigma |
| A | 13 | 254 | 15590 | 82.66 | 891 | 876 | 178.0 |
| A | 3 | 137 | 8462 | 42.62 | 891 | 876 | 178.0 |
| A | 0 | 226 | 7717 | 38.43 | 891 | 876 | 178.0 |
| B | 6 | 159 | 1756187 | 10616.46 | 862 | 841 | 165.3 |
| B | 0 | 190 | 178183 | 1072.58 | 862 | 841 | 165.3 |
| B | 10 | 247 | 90231 | 540.64 | 862 | 841 | 165.3 |
| C | 3 | 233 | 178858 | 935.27 | 825 | 832 | 190.3 |
| C | 14 | 238 | 155330 | 811.66 | 825 | 832 | 190.3 |
| C | 0 | 10 | 29755 | 151.95 | 825 | 832 | 190.3 |
| D | 8 | 195 | 606699 | 3017.98 | 856 | 837 | 200.8 |
| D | 12 | 79 | 78211 | 385.42 | 856 | 837 | 200.8 |
| D | 2 | 250 | 54036 | 265.0 | 856 | 837 | 200.8 |
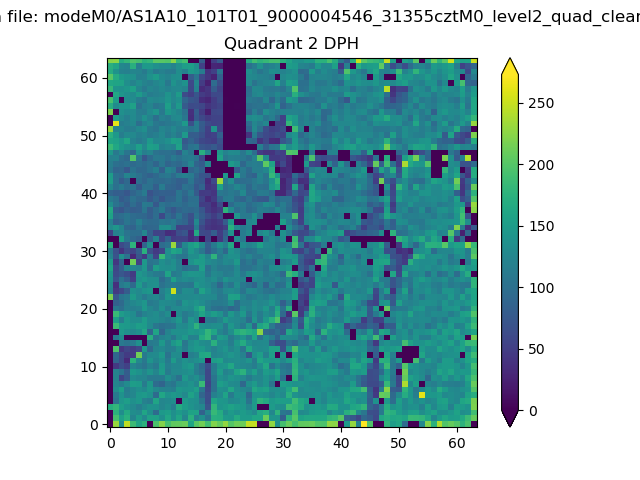
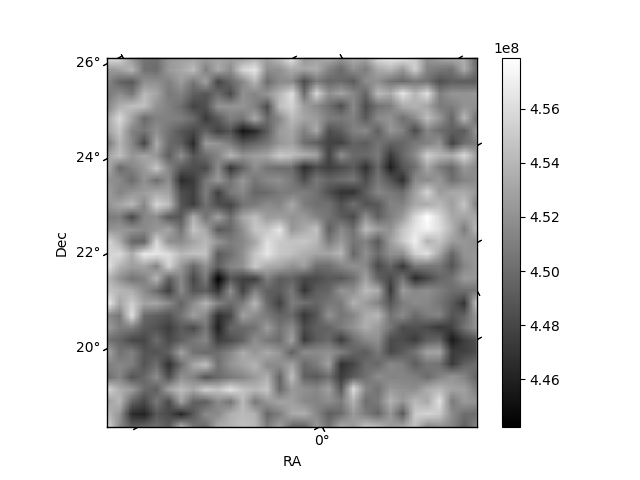
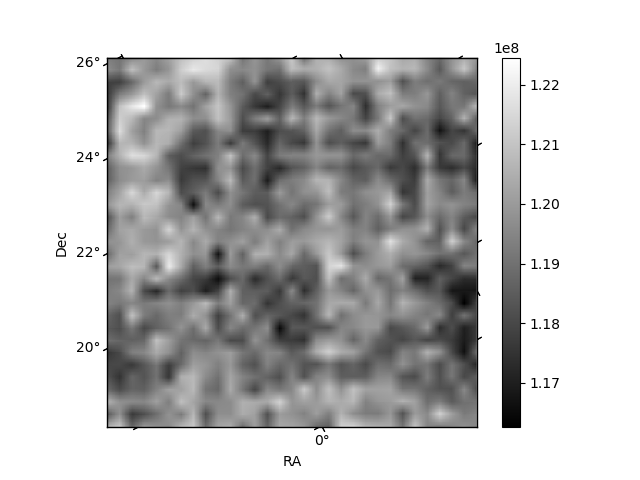
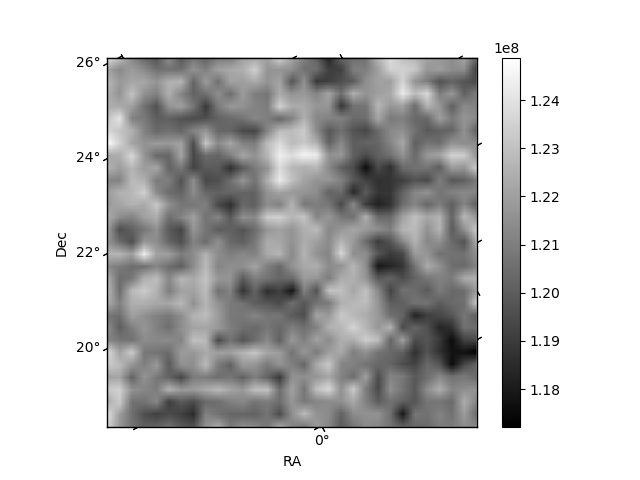
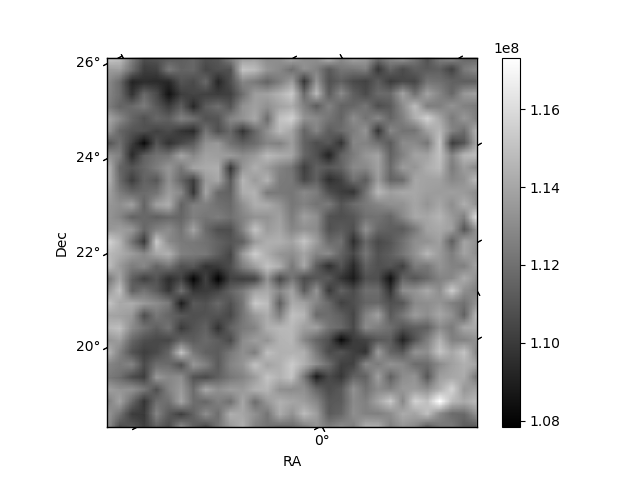
Histogram calculated using DETX and DETY for each event in the final _common_clean file
| Quadrant A | 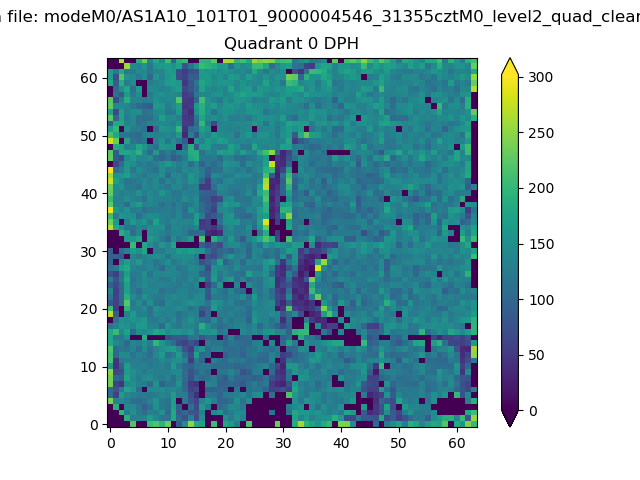 |
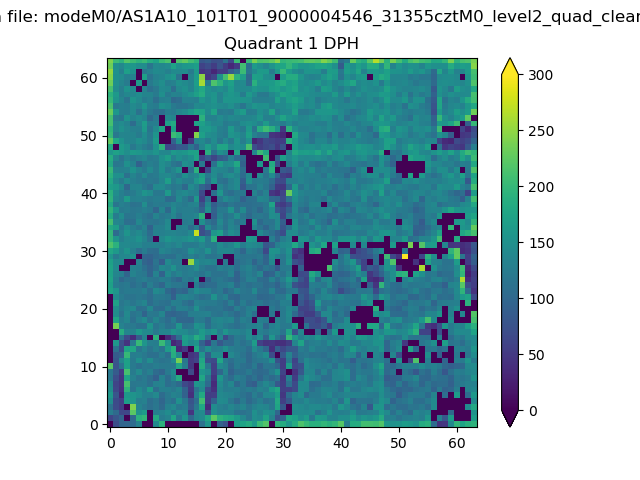 |
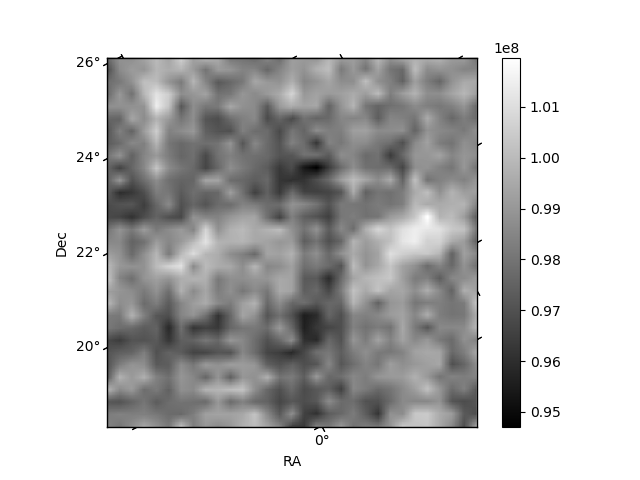
Quadrant B |
|---|---|---|---|
| Quadrant D | 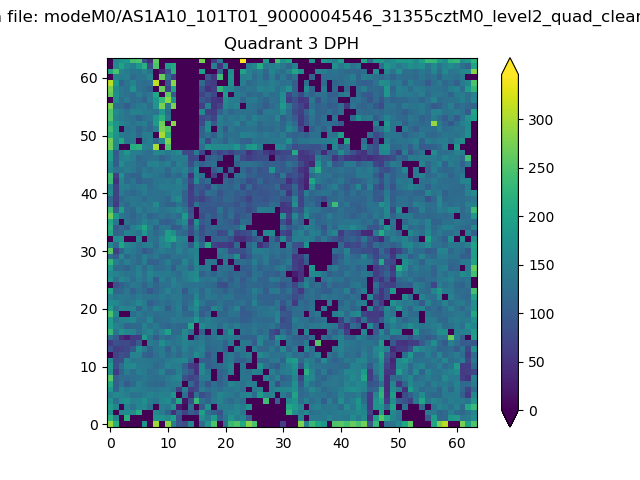 |
 |
Quadrant C |
| Plot type | Count rate plots | Images |
|---|---|---|
| Comparison with Poisson distribution Blue bars denote a histogram of data divided into 1 sec bins. Red curve is a Poisson curve with rate = median count rate of data. |
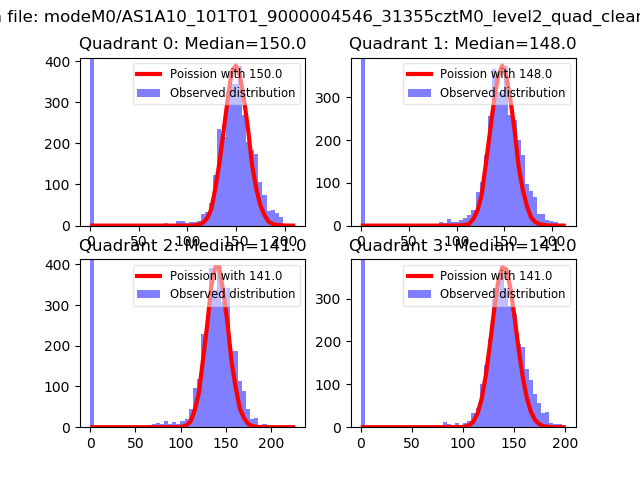 |
 |
| Quadrant-wise count rates Data is divided into 100 sec bins |
 |
|
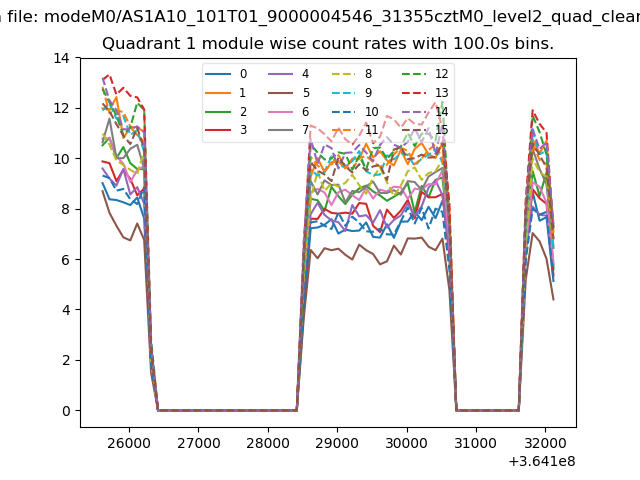
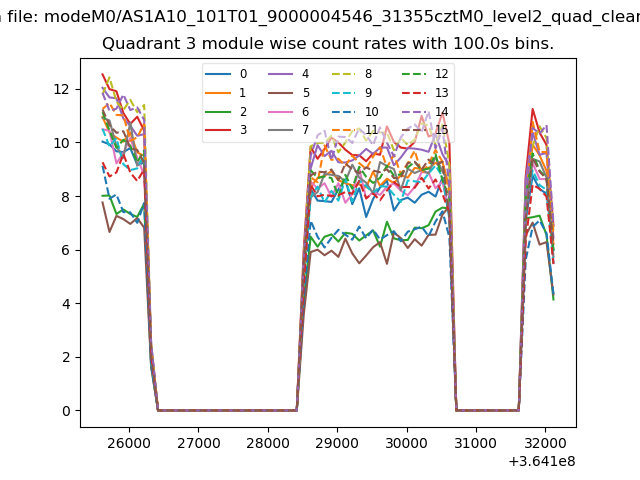
| Module-wise count rates for Quadrant A Data is divided into 100 sec bins |
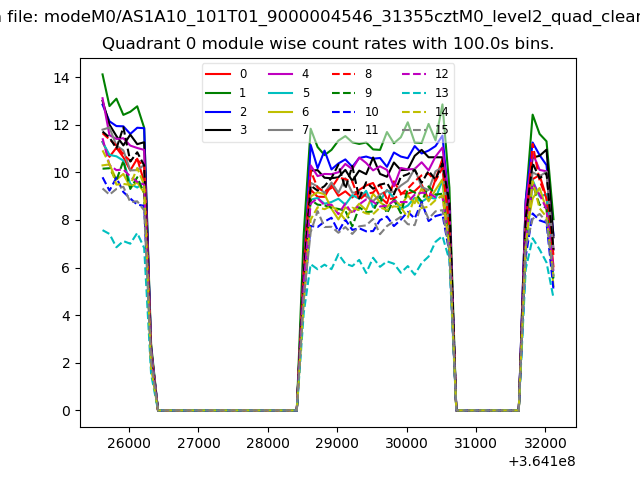 |
 |
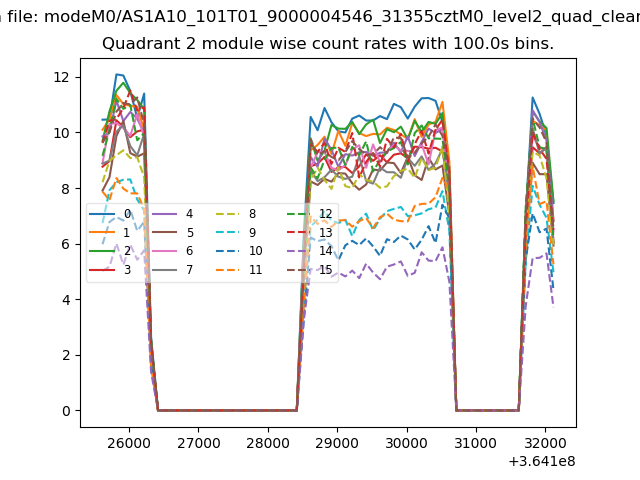
| Module-wise count rates for Quadrant B Data is divided into 100 sec bins |
 |
 |
| Module-wise count rates for Quadrant C Data is divided into 100 sec bins |
 |
 |
| Module-wise count rates for Quadrant D Data is divided into 100 sec bins |
 |
 |
| Parameter | Plot |
|---|---|
| CZT HV Monitor | 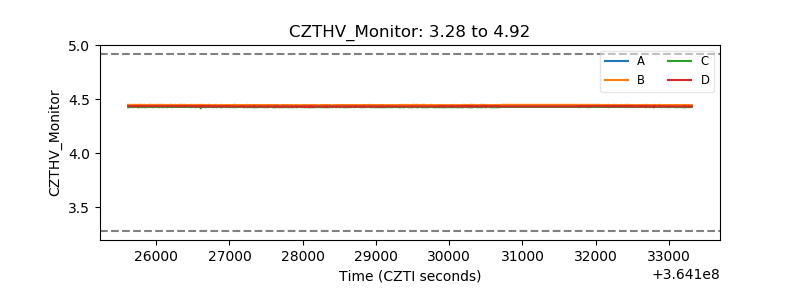 |
| D_VDD | 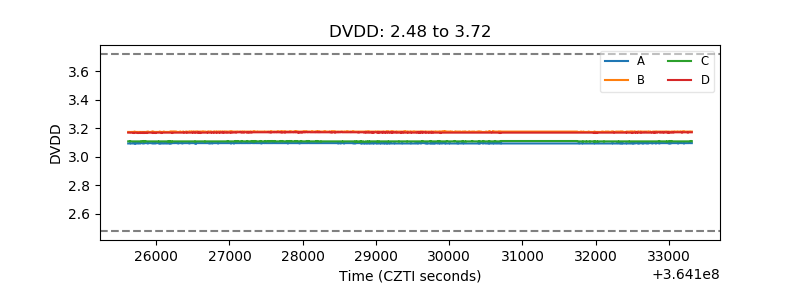 |
| Temperature 1 | 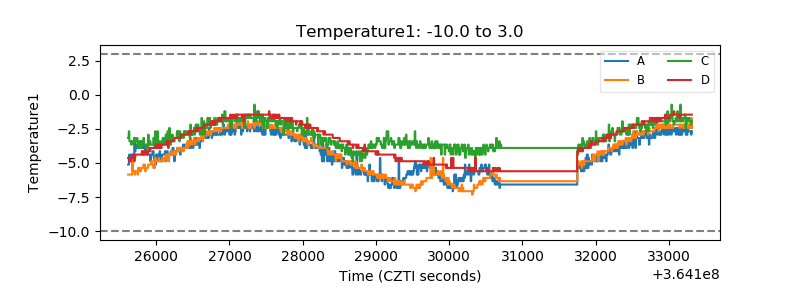 |
| Veto HV Monitor | 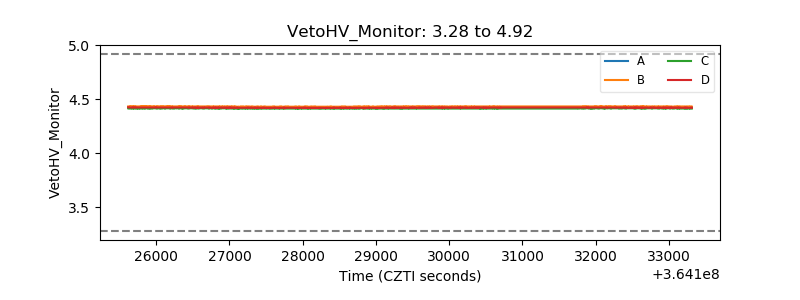 |
| Veto LLD | 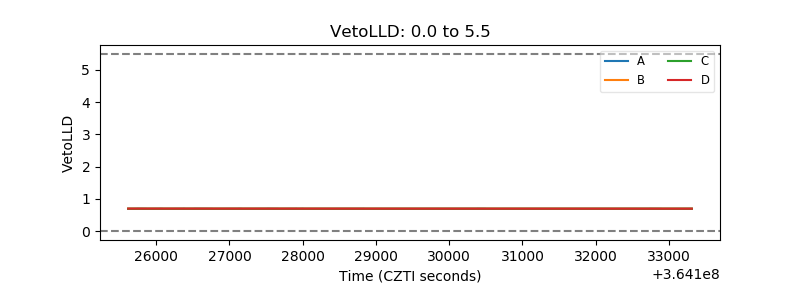 |
| Alpha Counter | 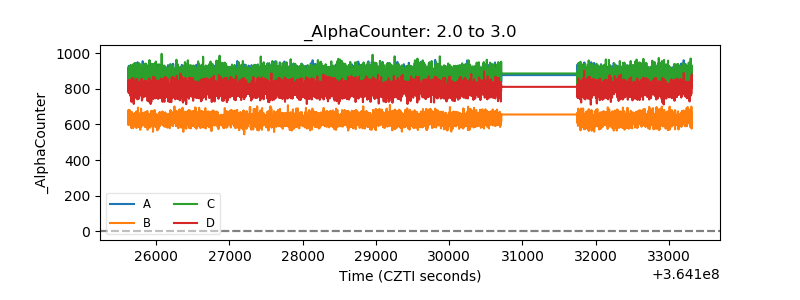 |
| _CPM_Rate |  |
| CZT Counter | 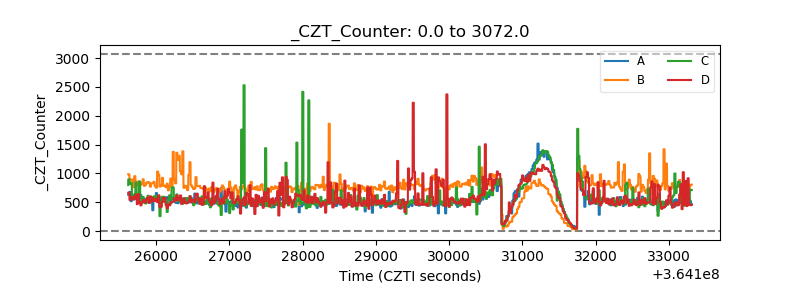 |
| +2.5 Volts monitor |  |
| +5 Volts monitor |  |
| _ROLL_ROT | 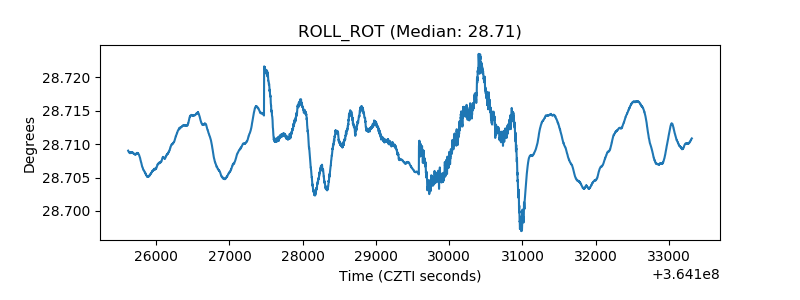 |
| _Roll_DEC | 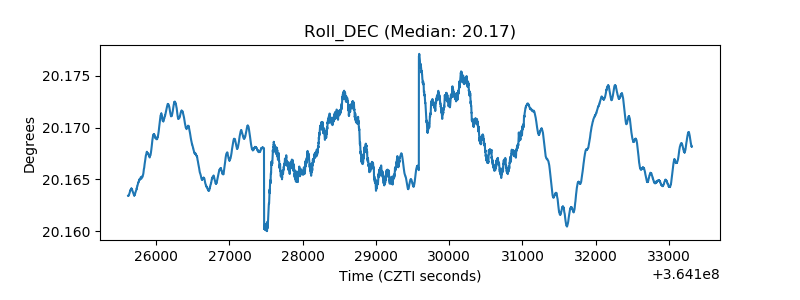 |
| _Roll_RA | 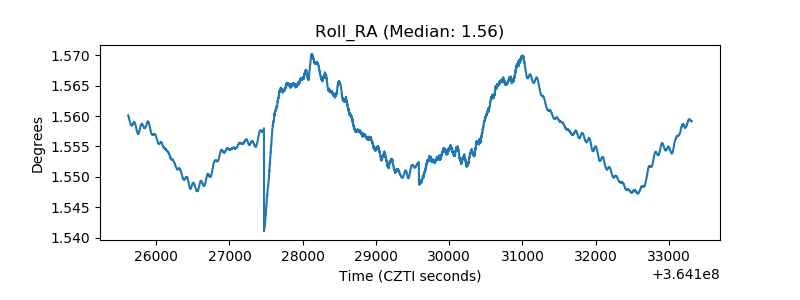 |
| Veto Counter | 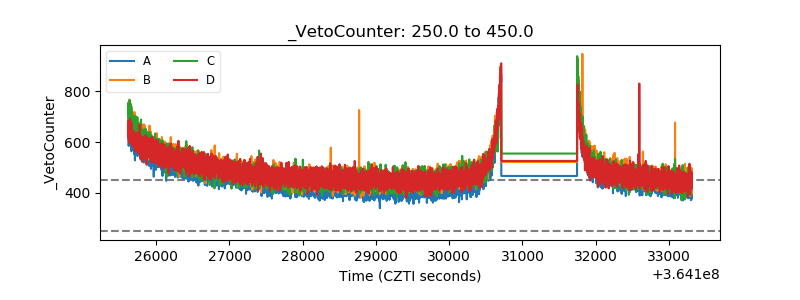 |