| Param | Original file | Final file |
|---|---|---|
| Filename | modeM0/AS1A10_101T01_9000004546_31358cztM0_level2.evt | modeM0/AS1A10_101T01_9000004546_31358cztM0_level2_quad_clean.evt |
| Size (bytes) | 667,964,160 | 88,096,320 |
| Size | 637.0 MB | 84.0 MB |
| Events in quadrant A | 4,045,456 | 540,336 |
| Events in quadrant B | 6,326,436 | 534,966 |
| Events in quadrant C | 4,704,574 | 509,251 |
| Events in quadrant D | 4,600,206 | 515,815 |
| Mode M0 | |||
|---|---|---|---|
| Quadrant | BADHDUFLAG | Total packets | Discarded packets |
| A | 0 | 17125 | 2 |
| B | 0 | 24863 | 2 |
| C | 0 | 19044 | 2 |
| D | 0 | 19157 | 2 |
| Mode SS | |||
|---|---|---|---|
| Quadrant | BADHDUFLAG | Total packets | Discarded packets |
| A | 0 | 168 | 0 |
| B | 0 | 168 | 0 |
| C | 0 | 168 | 0 |
| D | 0 | 168 | 0 |
| Mode M9 | |||
|---|---|---|---|
| Quadrant | BADHDUFLAG | Total packets | Discarded packets |
| A | 0 | 4 | 0 |
| B | 0 | 4 | 0 |
| C | 0 | 4 | 0 |
| D | 0 | 4 | 0 |
| Quadrant | Total seconds | Saturated seconds | Saturation percentage |
|---|---|---|---|
| A | 8158 | 214 | 2.623192% |
| B | 8159 | 367 | 4.498100% |
| C | 8159 | 605 | 7.415124% |
| D | 8159 | 205 | 2.512563% |
Noise dominated data is calculated using 1-second bins in cleaned event files. If a bin has >2000 counts, and if more than 50% of those come from <1% of pixels, then it is considered to be noise-dominated and hence unusable.
| Quadrant | # 1 sec bins | Bins with >0 counts | Bins with >2000 counts | High rate bins dominated by noise | Noise dominated (total time) | Noise dominated (detector-on time) | Marked lightcurve |
|---|---|---|---|---|---|---|---|
| A | 8598 | 8160 | 0 | 0 | 0.00% | 0.00% | 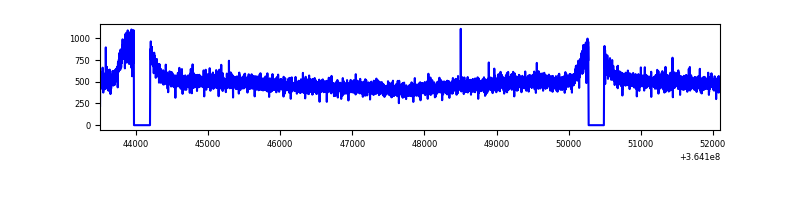 |
| B | 8599 | 8161 | 4 | 4 | 0.05% | 0.05% | 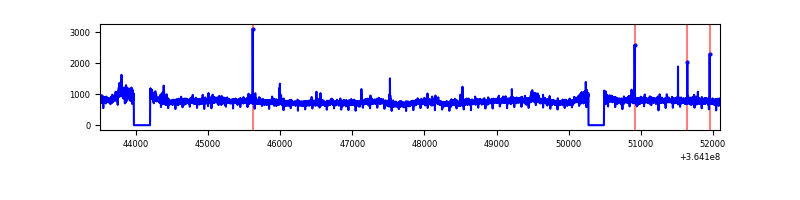 |
| C | 8599 | 8161 | 0 | 0 | 0.00% | 0.00% |  |
| D | 8599 | 8161 | 12 | 12 | 0.14% | 0.15% | 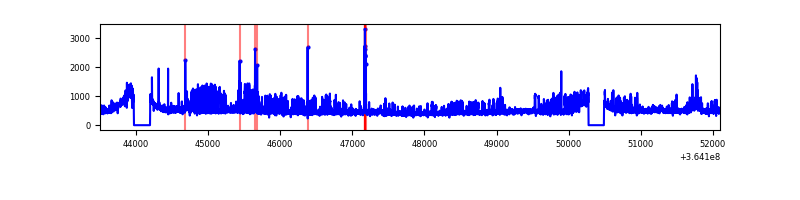 |
Top three noisy pixels from each quadrant. If the there are fewer than three noisy pixels in the level2.evt file, extra rows are filled as -1
| Pixel properties | Quadrant properties | ||||||
|---|---|---|---|---|---|---|---|
| Quadrant | DetID | PixID | Counts | Sigma | Mean | Median | Sigma |
| A | 13 | 254 | 16576 | 73.98 | 1048 | 1025 | 210.2 |
| A | 3 | 137 | 11126 | 48.05 | 1048 | 1025 | 210.2 |
| A | 0 | 226 | 8930 | 37.61 | 1048 | 1025 | 210.2 |
| B | 6 | 159 | 2232489 | 11138.66 | 1019 | 994 | 200.3 |
| B | 0 | 190 | 44469 | 217.01 | 1019 | 994 | 200.3 |
| B | 12 | 111 | 24645 | 118.06 | 1019 | 994 | 200.3 |
| C | 3 | 233 | 500293 | 2169.1 | 978 | 982 | 230.2 |
| C | 14 | 238 | 230943 | 998.99 | 978 | 982 | 230.2 |
| C | 14 | 254 | 96987 | 417.06 | 978 | 982 | 230.2 |
| D | 8 | 195 | 632323 | 2611.43 | 1010 | 983 | 241.8 |
| D | 2 | 250 | 78637 | 321.2 | 1010 | 983 | 241.8 |
| D | 2 | 234 | 41908 | 169.28 | 1010 | 983 | 241.8 |
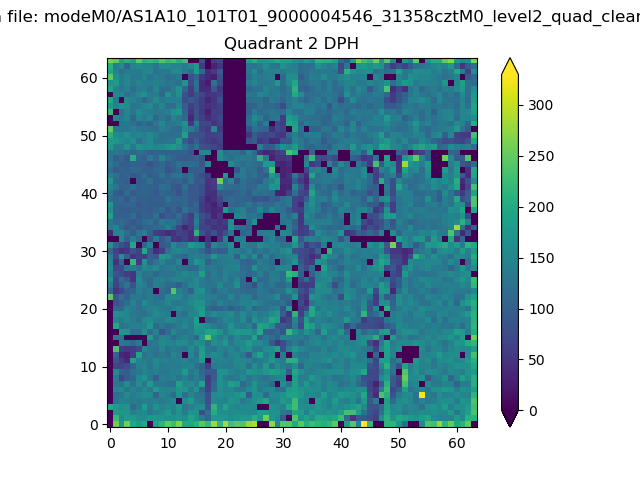
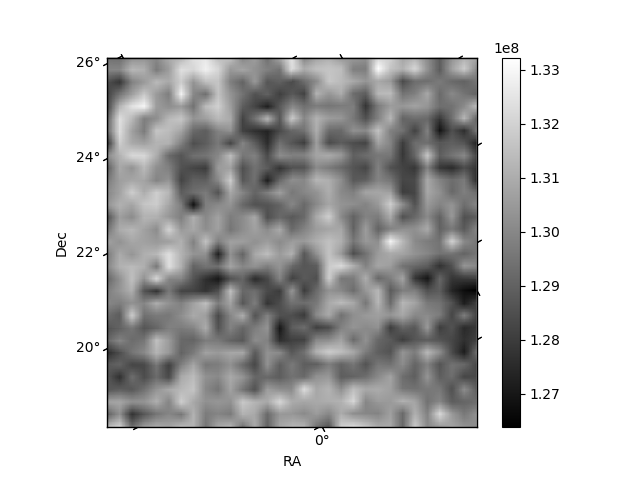
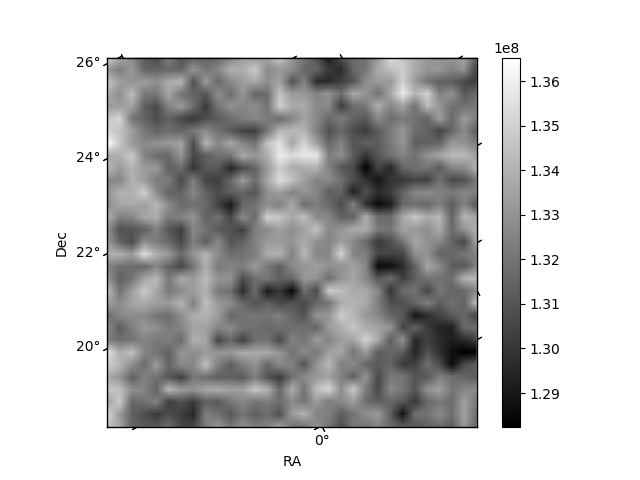
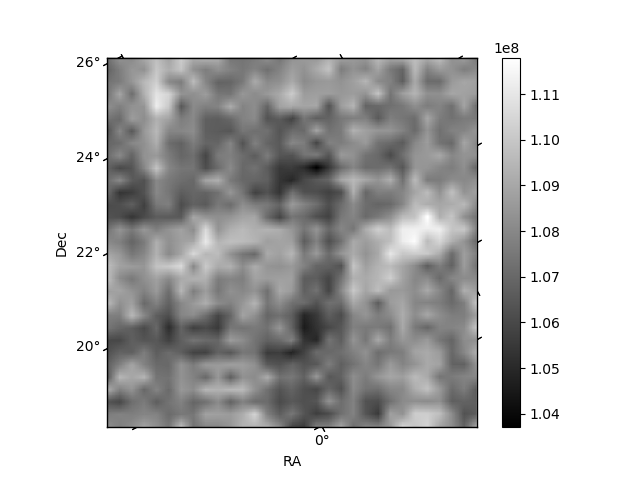
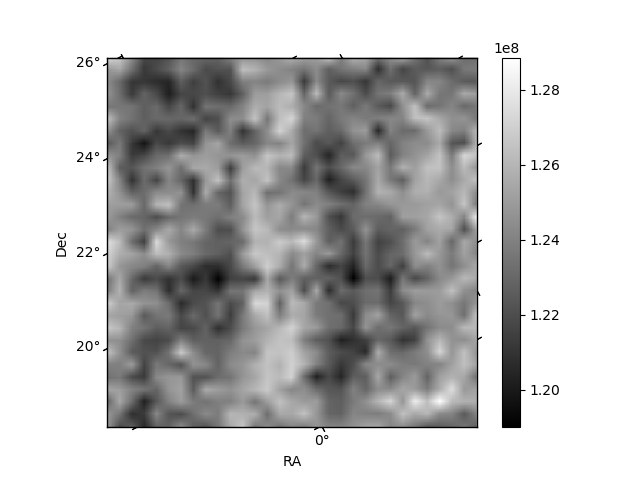
Histogram calculated using DETX and DETY for each event in the final _common_clean file
| Quadrant A |  |
 |
Quadrant B |
|---|---|---|---|
| Quadrant D | 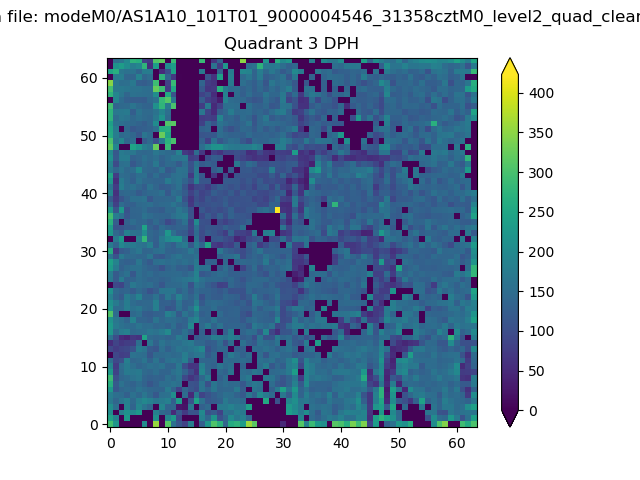 |
 |
Quadrant C |
| Plot type | Count rate plots | Images |
|---|---|---|
| Comparison with Poisson distribution Blue bars denote a histogram of data divided into 1 sec bins. Red curve is a Poisson curve with rate = median count rate of data. |
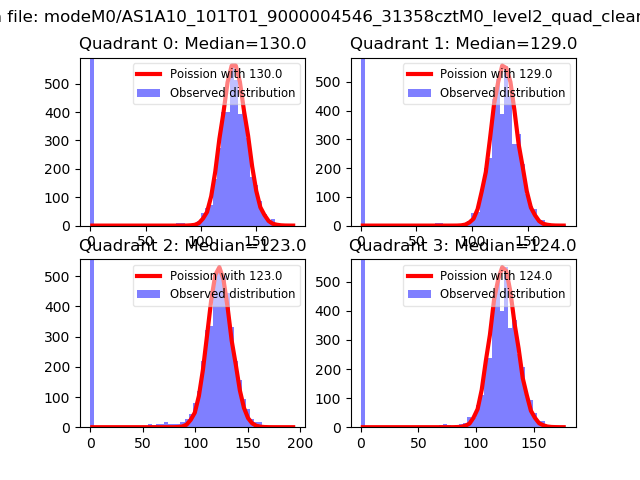 |
 |
| Quadrant-wise count rates Data is divided into 100 sec bins |
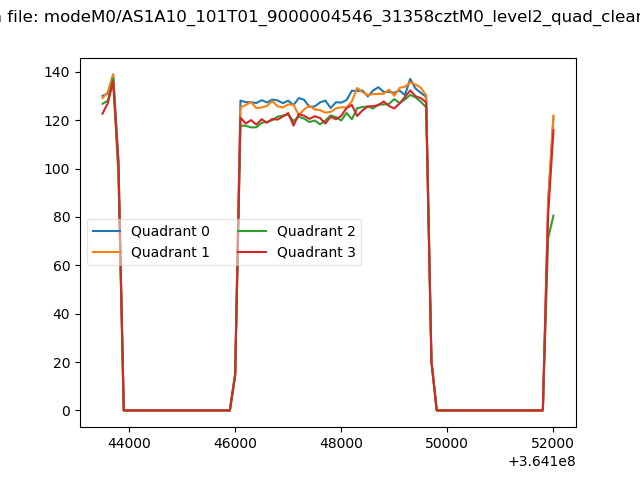 |
|
| Module-wise count rates for Quadrant A Data is divided into 100 sec bins |
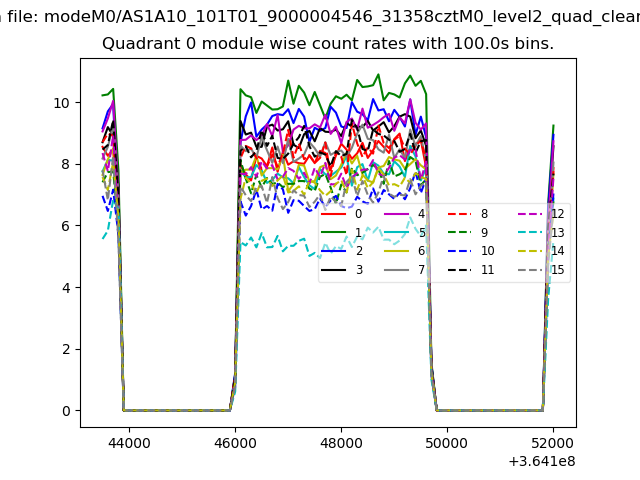 |
 |
| Module-wise count rates for Quadrant B Data is divided into 100 sec bins |
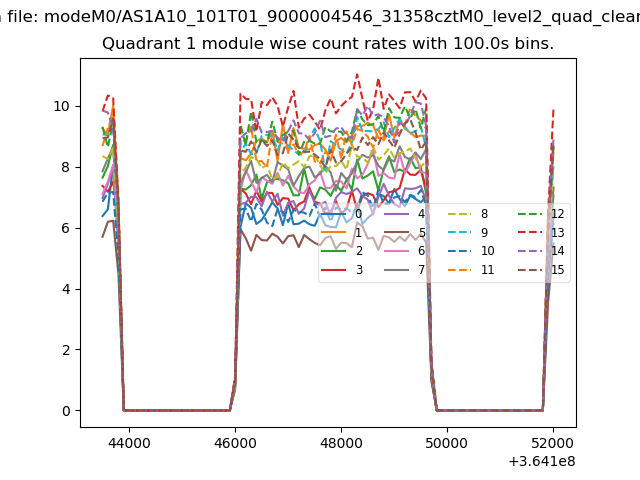 |
 |
| Module-wise count rates for Quadrant C Data is divided into 100 sec bins |
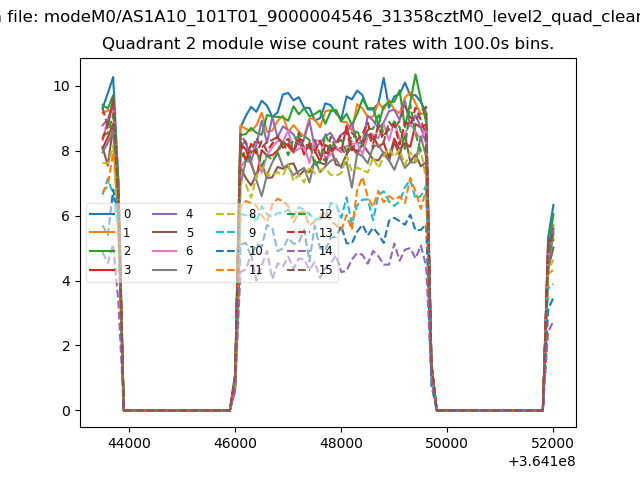 |
 |
| Module-wise count rates for Quadrant D Data is divided into 100 sec bins |
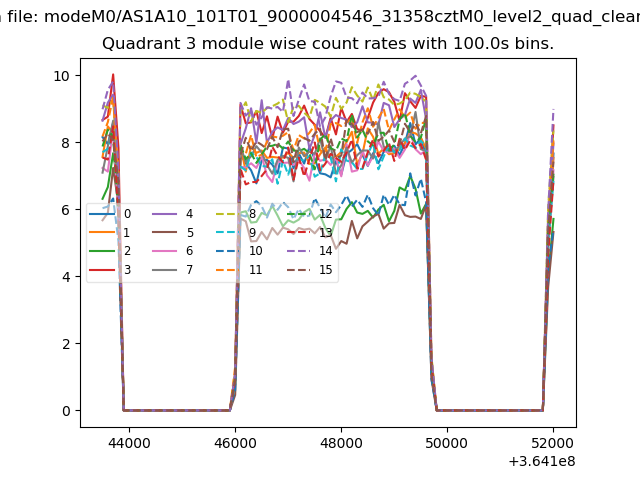 |
 |
| Parameter | Plot |
|---|---|
| CZT HV Monitor | 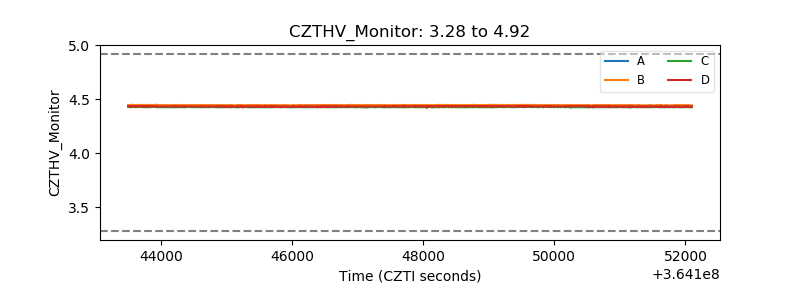 |
| D_VDD | 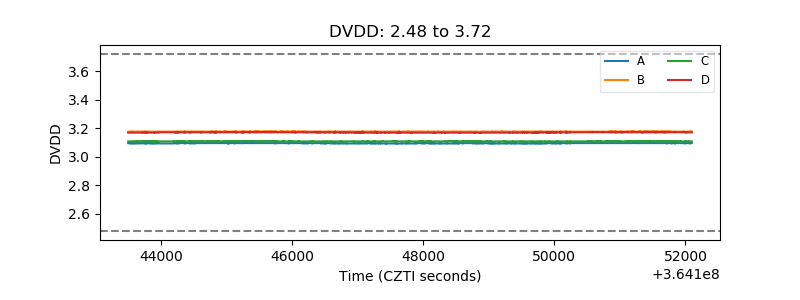 |
| Temperature 1 | 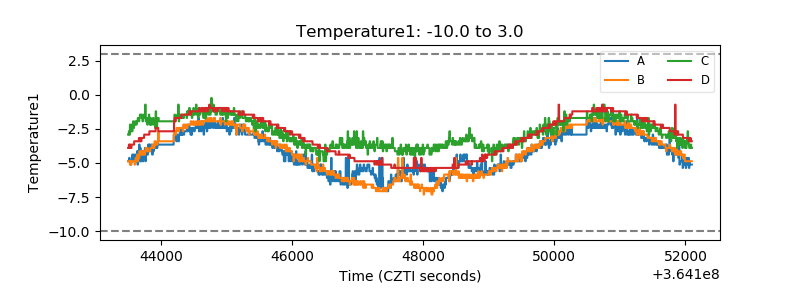 |
| Veto HV Monitor |  |
| Veto LLD | 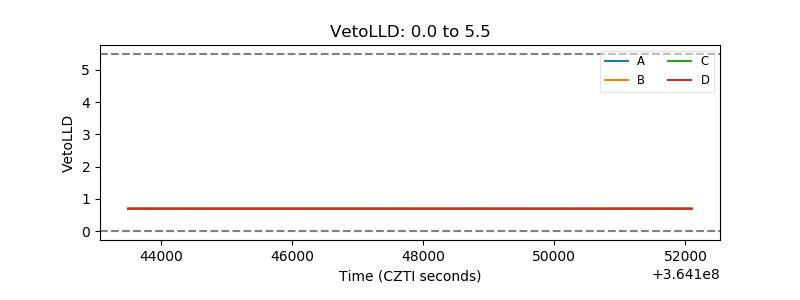 |
| Alpha Counter | 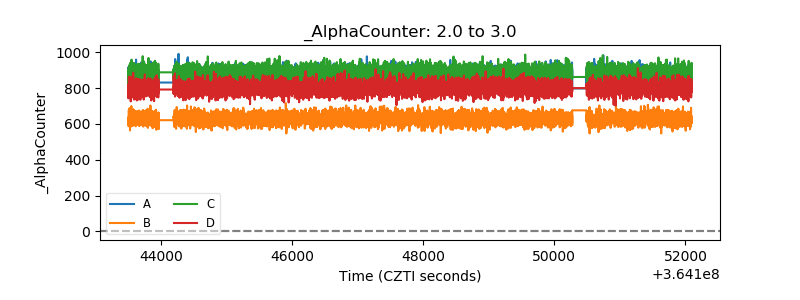 |
| _CPM_Rate | 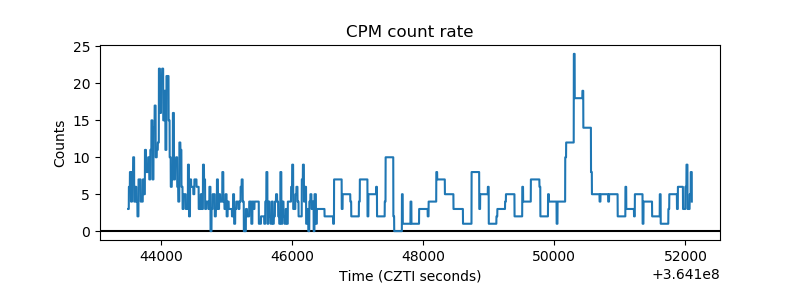 |
| CZT Counter | 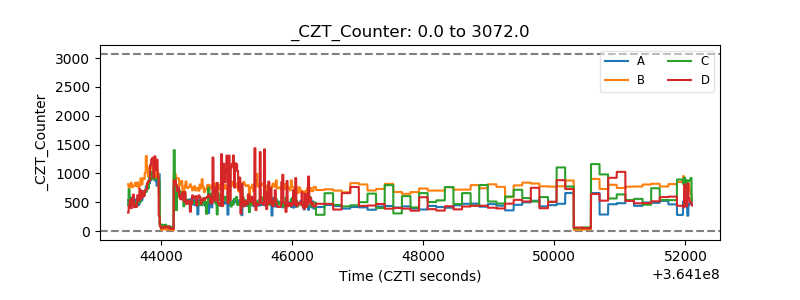 |
| +2.5 Volts monitor | 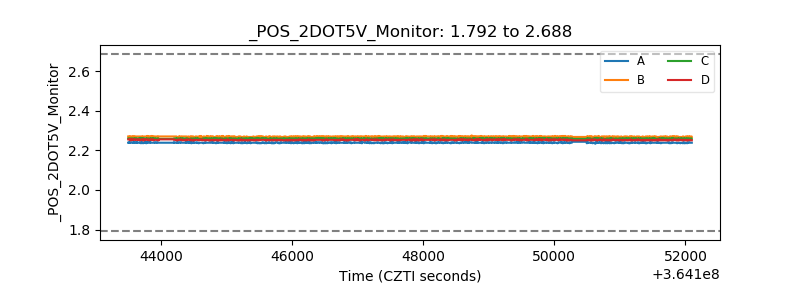 |
| +5 Volts monitor |  |
| _ROLL_ROT | 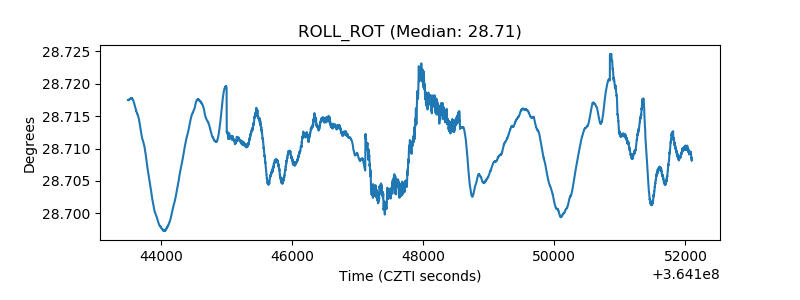 |
| _Roll_DEC | 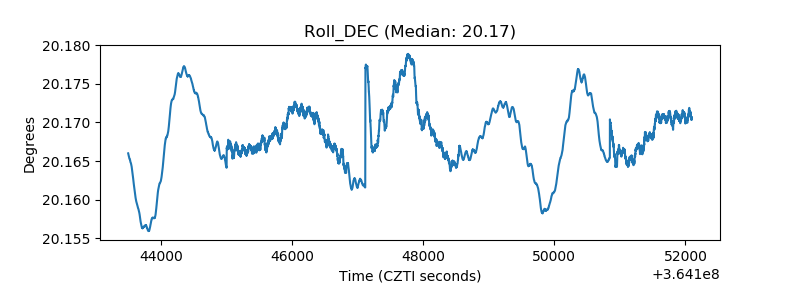 |
| _Roll_RA | 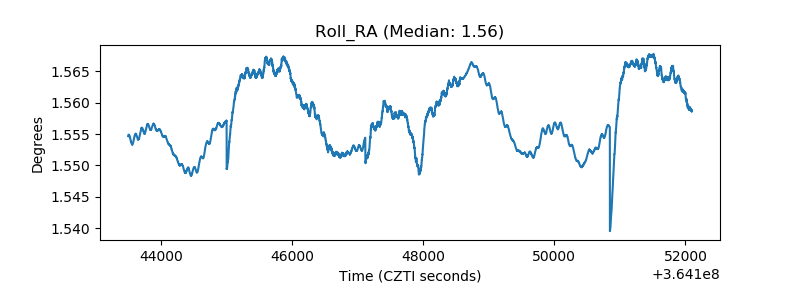 |
| Veto Counter | 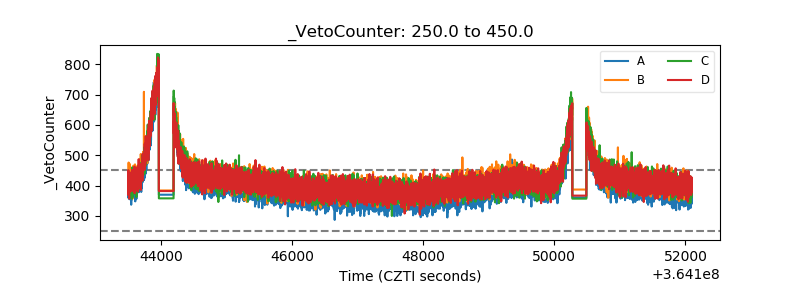 |