| Param | Original file | Final file |
|---|---|---|
| Filename | modeM0/AS1A10_101T01_9000004546_31359cztM0_level2.evt | modeM0/AS1A10_101T01_9000004546_31359cztM0_level2_quad_clean.evt |
| Size (bytes) | 555,272,640 | 85,881,600 |
| Size | 529.5 MB | 81.9 MB |
| Events in quadrant A | 3,385,802 | 541,441 |
| Events in quadrant B | 5,497,774 | 537,141 |
| Events in quadrant C | 3,713,513 | 507,721 |
| Events in quadrant D | 3,732,599 | 514,287 |
| Mode M0 | |||
|---|---|---|---|
| Quadrant | BADHDUFLAG | Total packets | Discarded packets |
| A | 0 | 14593 | 1 |
| B | 0 | 21705 | 3 |
| C | 0 | 15508 | 1 |
| D | 0 | 15856 | 1 |
| Mode SS | |||
|---|---|---|---|
| Quadrant | BADHDUFLAG | Total packets | Discarded packets |
| A | 0 | 146 | 0 |
| B | 0 | 146 | 0 |
| C | 0 | 146 | 0 |
| D | 0 | 146 | 0 |
| Mode M9 | |||
|---|---|---|---|
| Quadrant | BADHDUFLAG | Total packets | Discarded packets |
| A | 0 | 4 | 0 |
| B | 0 | 4 | 0 |
| C | 0 | 4 | 0 |
| D | 0 | 4 | 0 |
| Quadrant | Total seconds | Saturated seconds | Saturation percentage |
|---|---|---|---|
| A | 7179 | 35 | 0.487533% |
| B | 7179 | 99 | 1.379022% |
| C | 7179 | 394 | 5.488230% |
| D | 7179 | 25 | 0.348238% |
Noise dominated data is calculated using 1-second bins in cleaned event files. If a bin has >2000 counts, and if more than 50% of those come from <1% of pixels, then it is considered to be noise-dominated and hence unusable.
| Quadrant | # 1 sec bins | Bins with >0 counts | Bins with >2000 counts | High rate bins dominated by noise | Noise dominated (total time) | Noise dominated (detector-on time) | Marked lightcurve |
|---|---|---|---|---|---|---|---|
| A | 7584 | 7180 | 0 | 0 | 0.00% | 0.00% | 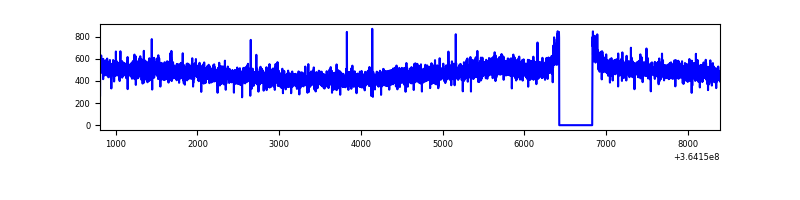 |
| B | 7584 | 7180 | 3 | 3 | 0.04% | 0.04% | 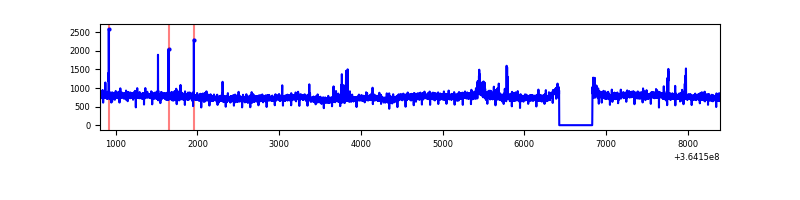 |
| C | 7584 | 7180 | 3 | 3 | 0.04% | 0.04% | 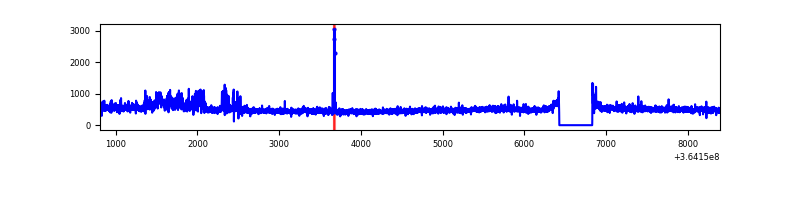 |
| D | 7584 | 7180 | 0 | 0 | 0.00% | 0.00% | 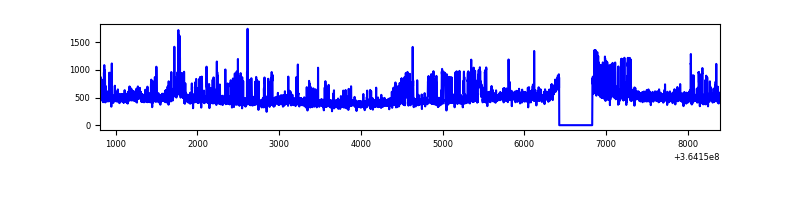 |
Top three noisy pixels from each quadrant. If the there are fewer than three noisy pixels in the level2.evt file, extra rows are filled as -1
| Pixel properties | Quadrant properties | ||||||
|---|---|---|---|---|---|---|---|
| Quadrant | DetID | PixID | Counts | Sigma | Mean | Median | Sigma |
| A | 13 | 254 | 12962 | 68.18 | 878 | 859 | 177.5 |
| A | 3 | 137 | 8885 | 45.21 | 878 | 859 | 177.5 |
| A | 0 | 226 | 7284 | 36.19 | 878 | 859 | 177.5 |
| B | 6 | 159 | 2020453 | 12063.62 | 862 | 840 | 167.4 |
| B | 0 | 190 | 54379 | 319.8 | 862 | 840 | 167.4 |
| B | 12 | 111 | 20701 | 118.63 | 862 | 840 | 167.4 |
| C | 14 | 238 | 220049 | 1126.56 | 824 | 828 | 194.6 |
| C | 14 | 254 | 111211 | 567.25 | 824 | 828 | 194.6 |
| C | 3 | 233 | 83297 | 423.8 | 824 | 828 | 194.6 |
| D | 8 | 195 | 420141 | 2081.23 | 847 | 825 | 201.5 |
| D | 12 | 79 | 49516 | 241.67 | 847 | 825 | 201.5 |
| D | 2 | 234 | 33534 | 162.35 | 847 | 825 | 201.5 |
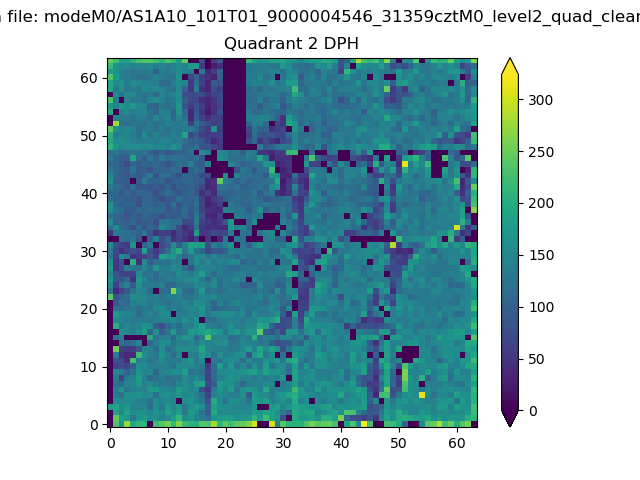
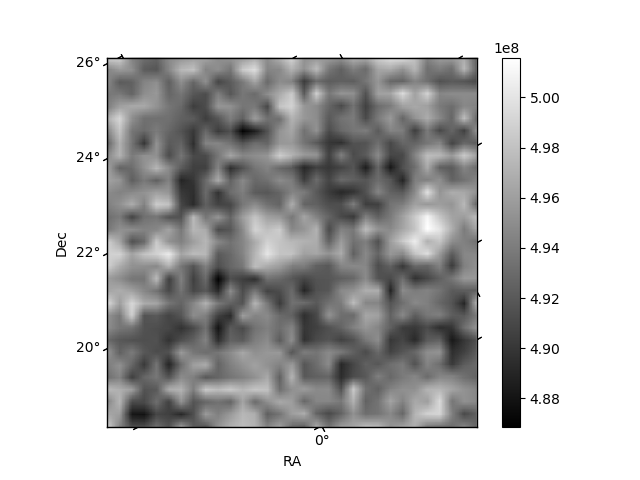
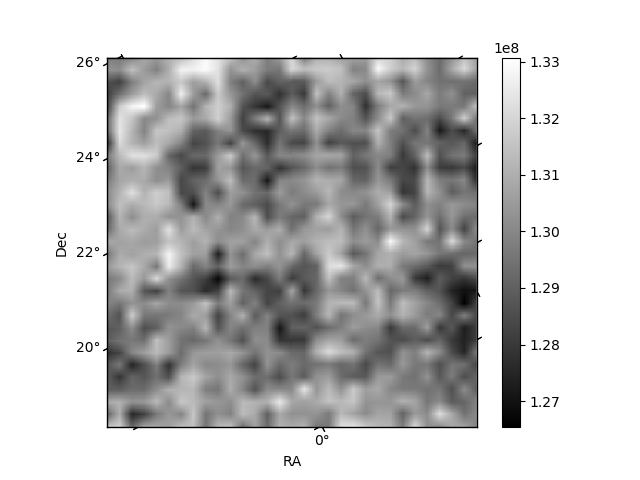
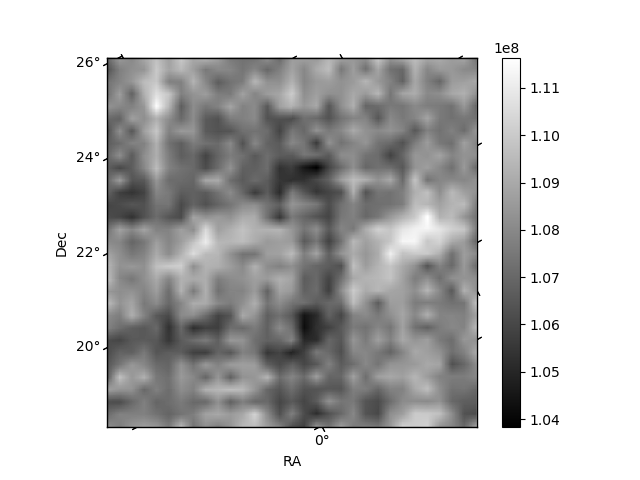
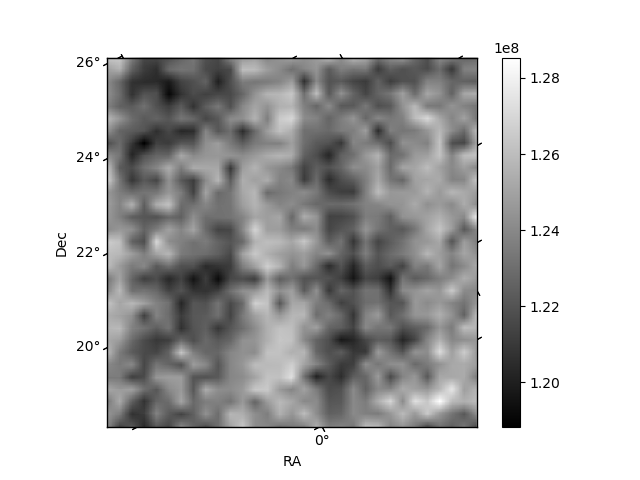
Histogram calculated using DETX and DETY for each event in the final _common_clean file
| Quadrant A | 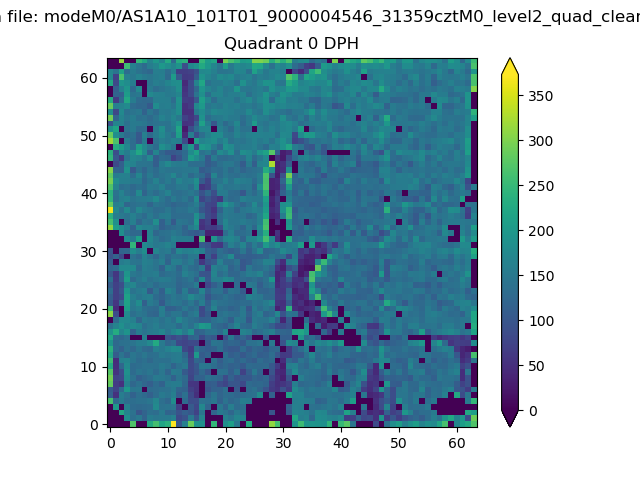 |
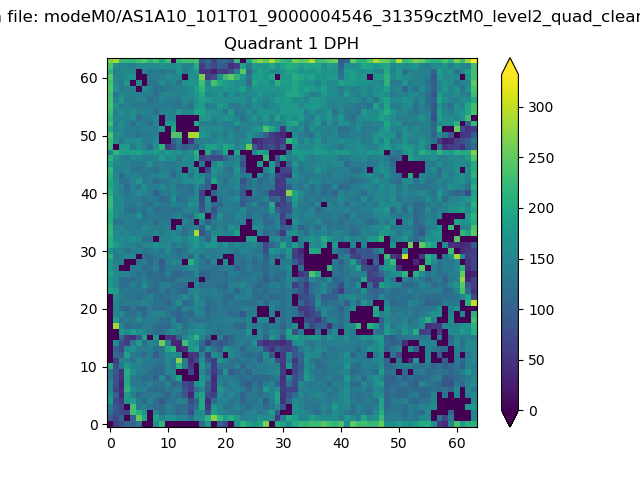 |
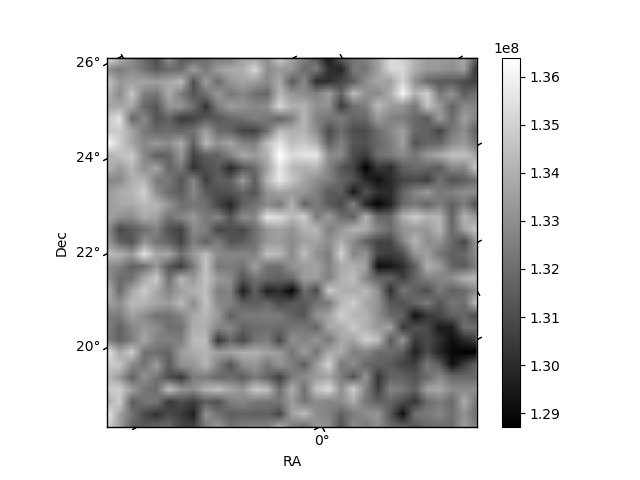
Quadrant B |
|---|---|---|---|
| Quadrant D | 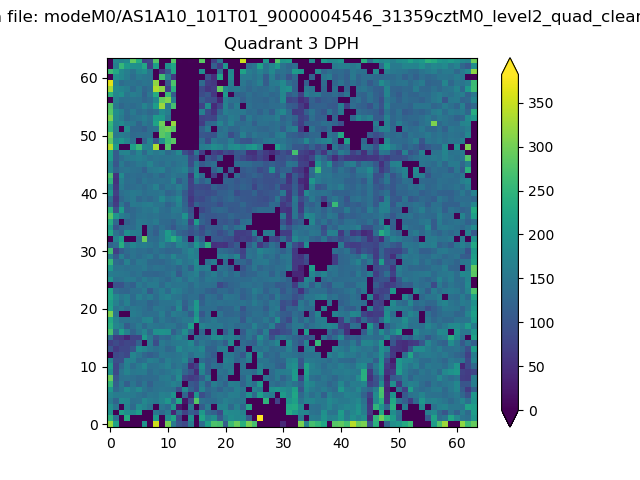 |
 |
Quadrant C |
| Plot type | Count rate plots | Images |
|---|---|---|
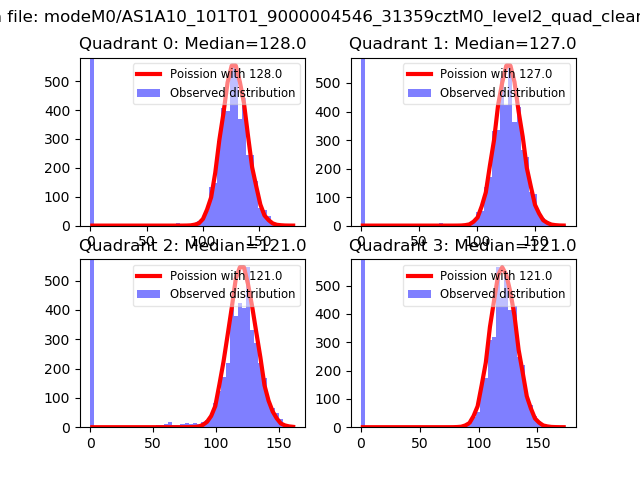
| Comparison with Poisson distribution Blue bars denote a histogram of data divided into 1 sec bins. Red curve is a Poisson curve with rate = median count rate of data. |
 |
 |
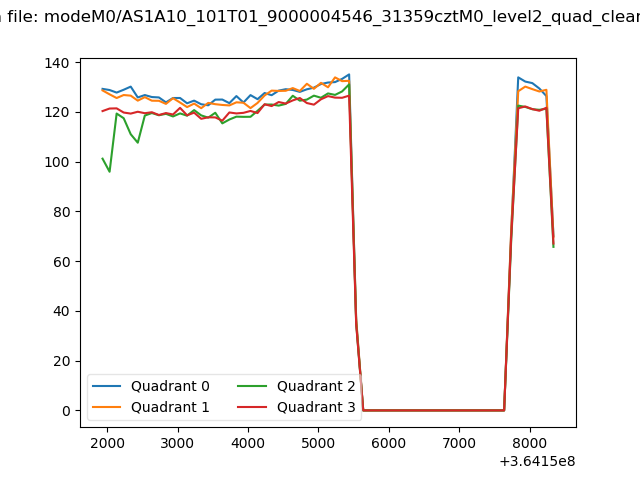
| Quadrant-wise count rates Data is divided into 100 sec bins |
 |
|
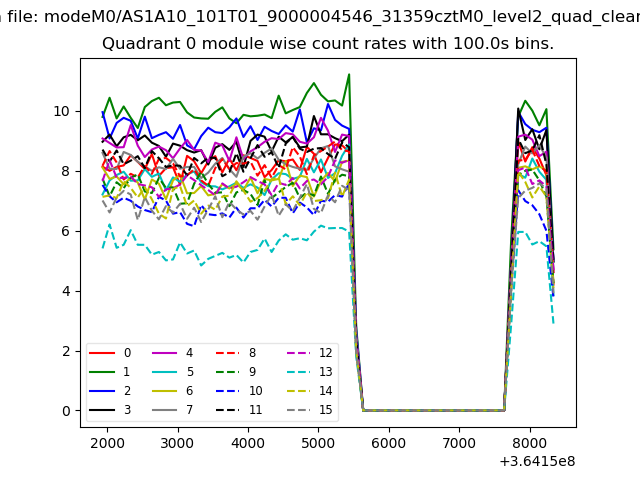
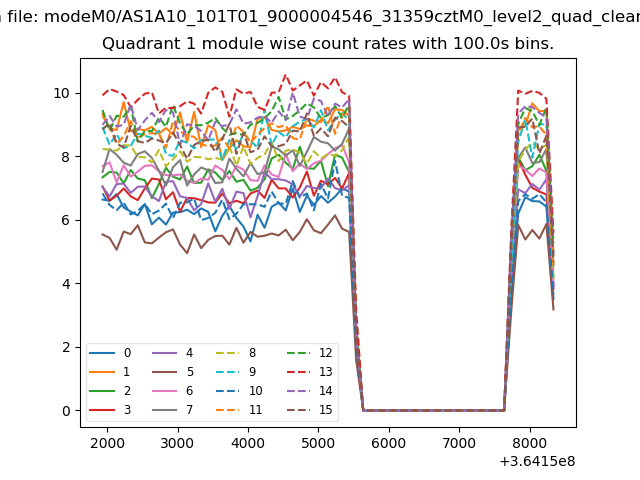
| Module-wise count rates for Quadrant A Data is divided into 100 sec bins |
 |
 |
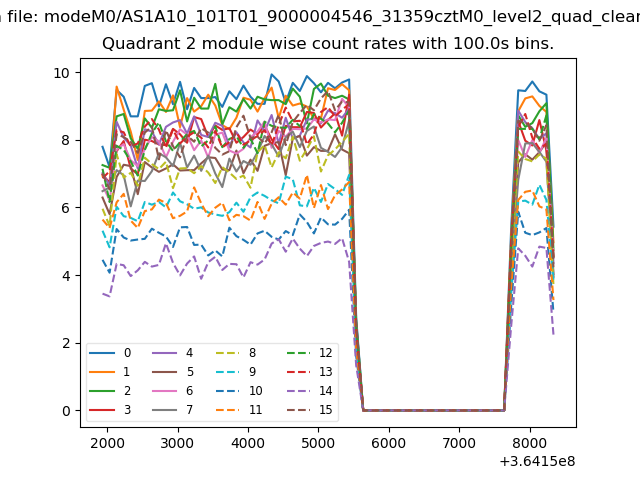
| Module-wise count rates for Quadrant B Data is divided into 100 sec bins |
 |
 |
| Module-wise count rates for Quadrant C Data is divided into 100 sec bins |
 |
 |
| Module-wise count rates for Quadrant D Data is divided into 100 sec bins |
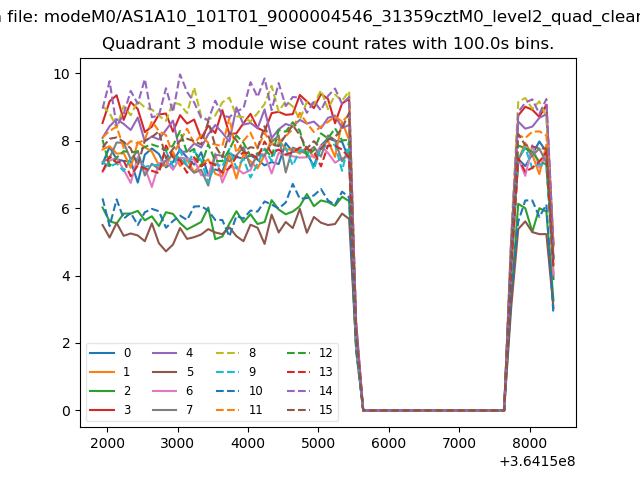 |
 |
| Parameter | Plot |
|---|---|
| CZT HV Monitor | 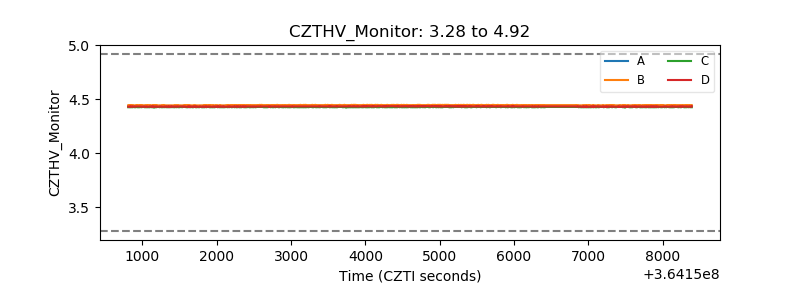 |
| D_VDD | 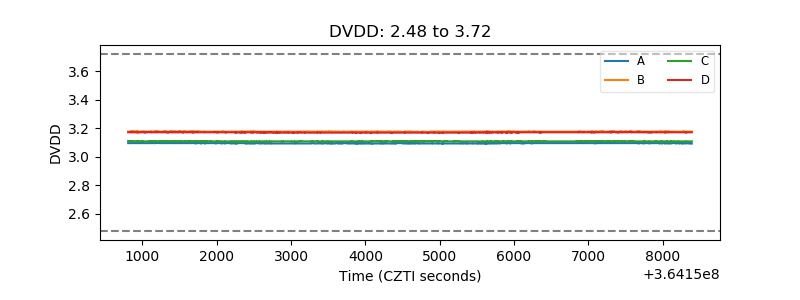 |
| Temperature 1 | 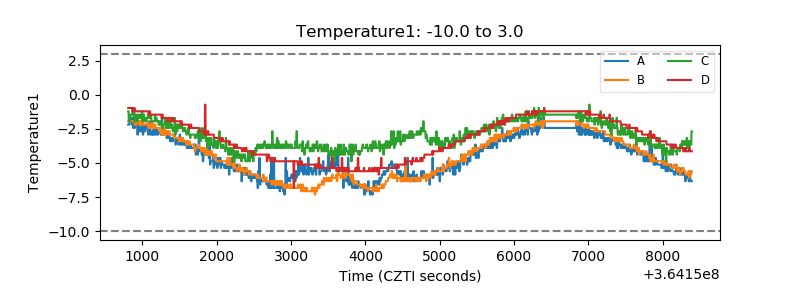 |
| Veto HV Monitor | 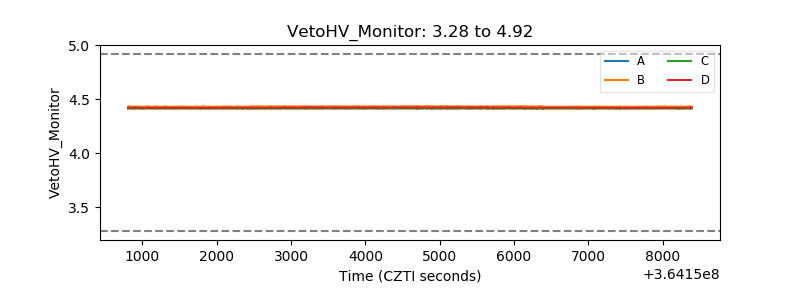 |
| Veto LLD | 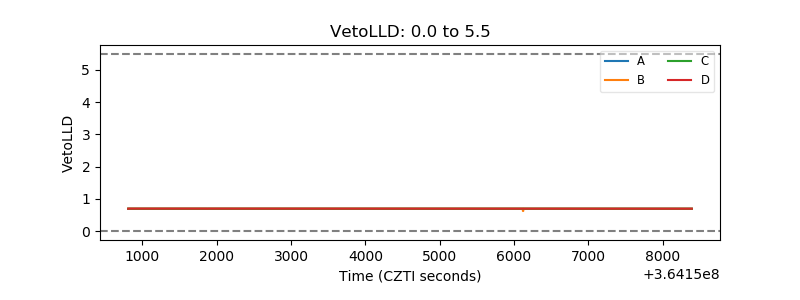 |
| Alpha Counter |  |
| _CPM_Rate | 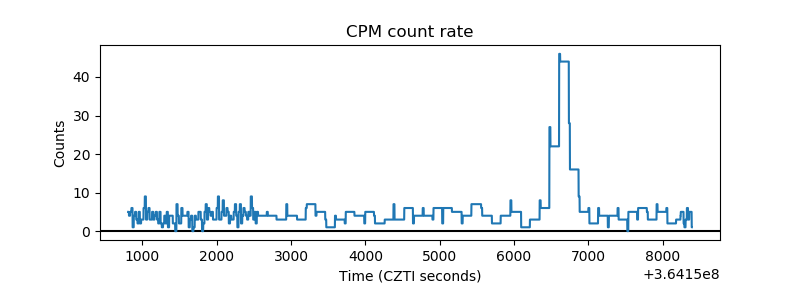 |
| CZT Counter | 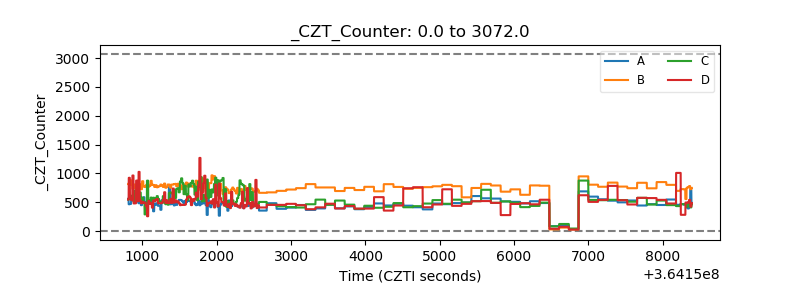 |
| +2.5 Volts monitor |  |
| +5 Volts monitor |  |
| _ROLL_ROT | 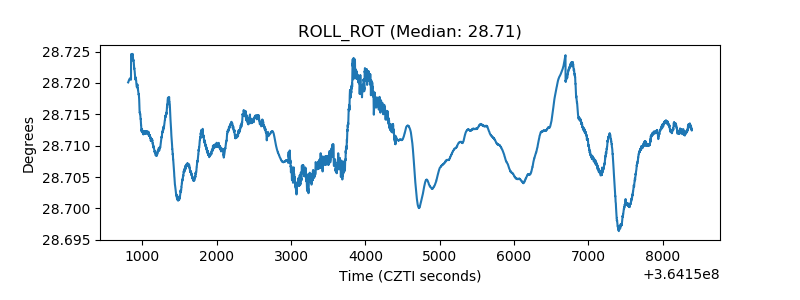 |
| _Roll_DEC | 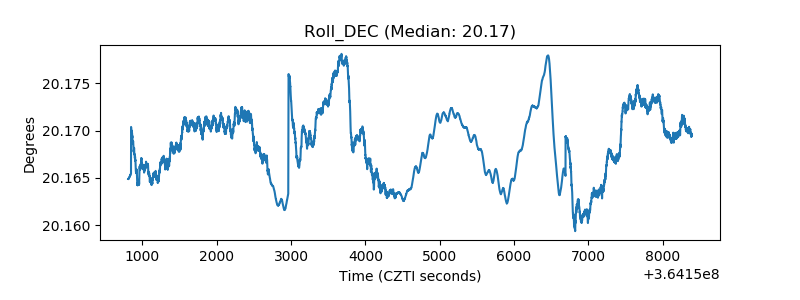 |
| _Roll_RA |  |
| Veto Counter | 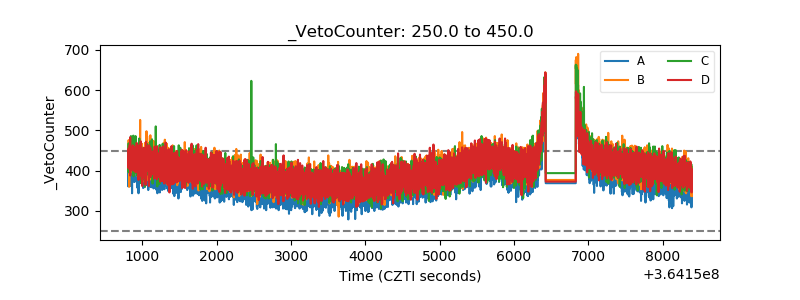 |