| Param | Original file | Final file |
|---|---|---|
| Filename | modeM0/AS1A10_101T01_9000004546_31361cztM0_level2.evt | modeM0/AS1A10_101T01_9000004546_31361cztM0_level2_quad_clean.evt |
| Size (bytes) | 999,688,320 | 170,579,520 |
| Size | 953.4 MB | 162.7 MB |
| Events in quadrant A | 5,942,016 | 1,103,668 |
| Events in quadrant B | 9,931,092 | 1,088,910 |
| Events in quadrant C | 6,475,262 | 1,052,770 |
| Events in quadrant D | 7,069,018 | 1,042,412 |
| Mode M0 | |||
|---|---|---|---|
| Quadrant | BADHDUFLAG | Total packets | Discarded packets |
| A | 0 | 25938 | 2 |
| B | 0 | 38932 | 2 |
| C | 0 | 27127 | 2 |
| D | 0 | 29603 | 2 |
| Mode SS | |||
|---|---|---|---|
| Quadrant | BADHDUFLAG | Total packets | Discarded packets |
| A | 0 | 256 | 0 |
| B | 0 | 256 | 0 |
| C | 0 | 256 | 0 |
| D | 0 | 256 | 0 |
| Mode M9 | |||
|---|---|---|---|
| Quadrant | BADHDUFLAG | Total packets | Discarded packets |
| A | 0 | 14 | 0 |
| B | 0 | 14 | 0 |
| C | 0 | 14 | 0 |
| D | 0 | 14 | 0 |
| Quadrant | Total seconds | Saturated seconds | Saturation percentage |
|---|---|---|---|
| A | 12716 | 36 | 0.283108% |
| B | 12717 | 262 | 2.060234% |
| C | 12717 | 232 | 1.824330% |
| D | 12717 | 146 | 1.148070% |
Noise dominated data is calculated using 1-second bins in cleaned event files. If a bin has >2000 counts, and if more than 50% of those come from <1% of pixels, then it is considered to be noise-dominated and hence unusable.
| Quadrant | # 1 sec bins | Bins with >0 counts | Bins with >2000 counts | High rate bins dominated by noise | Noise dominated (total time) | Noise dominated (detector-on time) | Marked lightcurve |
|---|---|---|---|---|---|---|---|
| A | 14056 | 12718 | 0 | 0 | 0.00% | 0.00% | 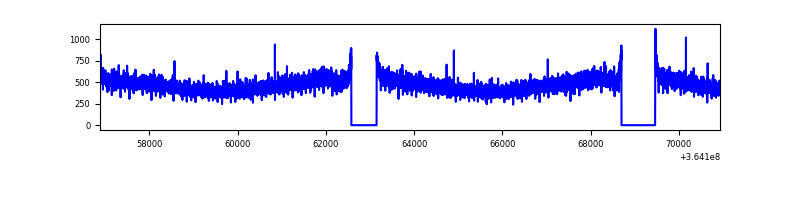 |
| B | 14057 | 12719 | 78 | 78 | 0.55% | 0.61% | 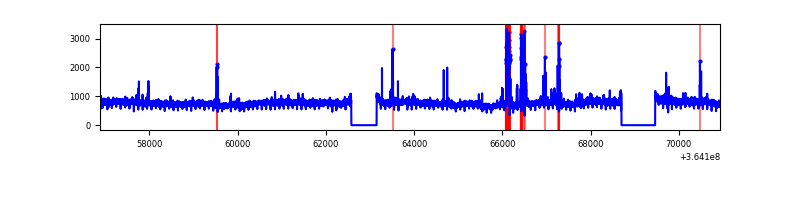 |
| C | 14057 | 12719 | 11 | 11 | 0.08% | 0.09% | 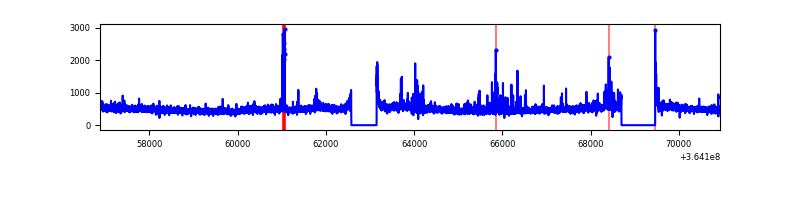 |
| D | 14057 | 12719 | 100 | 100 | 0.71% | 0.79% | 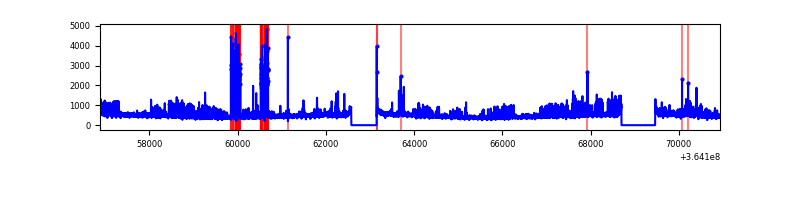 |
Top three noisy pixels from each quadrant. If the there are fewer than three noisy pixels in the level2.evt file, extra rows are filled as -1
| Pixel properties | Quadrant properties | ||||||
|---|---|---|---|---|---|---|---|
| Quadrant | DetID | PixID | Counts | Sigma | Mean | Median | Sigma |
| A | 13 | 254 | 23590 | 71.72 | 1539 | 1508 | 307.9 |
| A | 3 | 137 | 16135 | 47.51 | 1539 | 1508 | 307.9 |
| A | 0 | 226 | 12896 | 36.99 | 1539 | 1508 | 307.9 |
| B | 6 | 159 | 3579983 | 12296.34 | 1513 | 1473 | 291.0 |
| B | 4 | 80 | 296039 | 1012.17 | 1513 | 1473 | 291.0 |
| B | 0 | 190 | 40450 | 133.93 | 1513 | 1473 | 291.0 |
| C | 3 | 233 | 398751 | 1153.92 | 1467 | 1475 | 344.3 |
| C | 14 | 238 | 253114 | 730.91 | 1467 | 1475 | 344.3 |
| C | 0 | 10 | 29146 | 80.37 | 1467 | 1475 | 344.3 |
| D | 8 | 195 | 933606 | 2652.52 | 1480 | 1437 | 351.4 |
| D | 12 | 79 | 385317 | 1092.34 | 1480 | 1437 | 351.4 |
| D | 2 | 234 | 59422 | 165.0 | 1480 | 1437 | 351.4 |
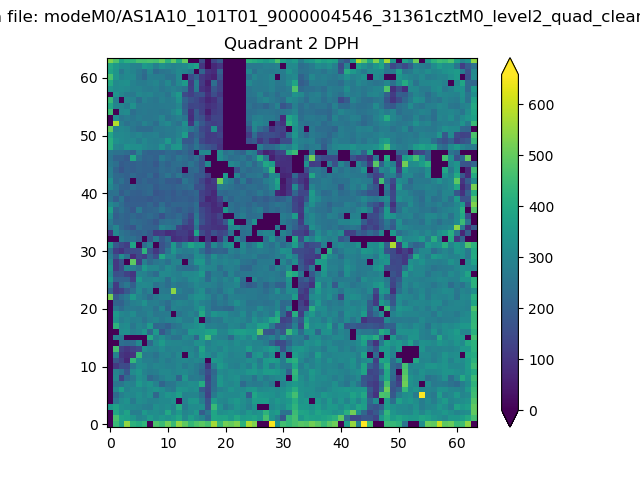
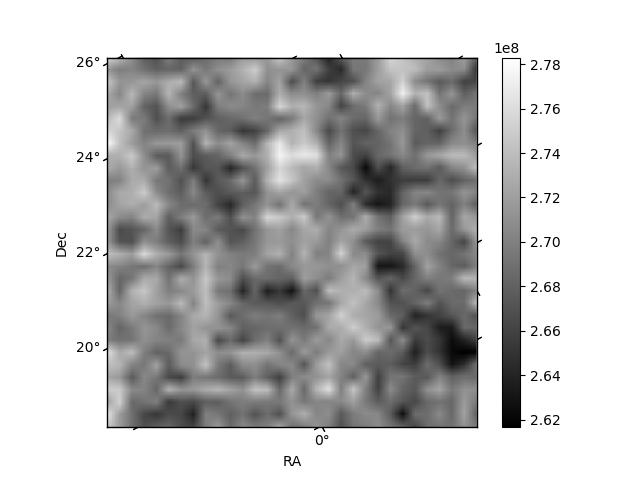
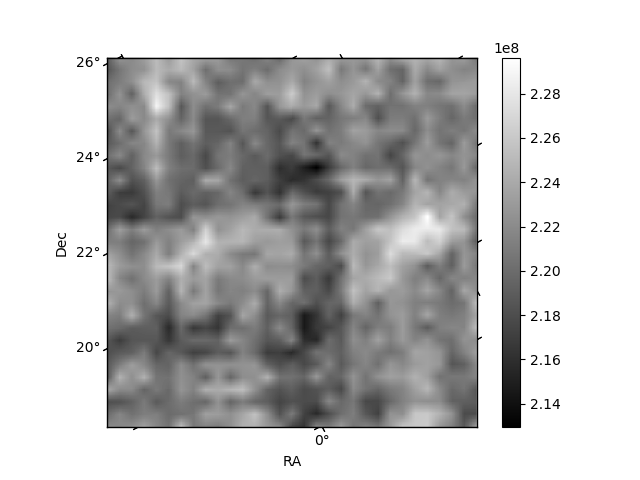
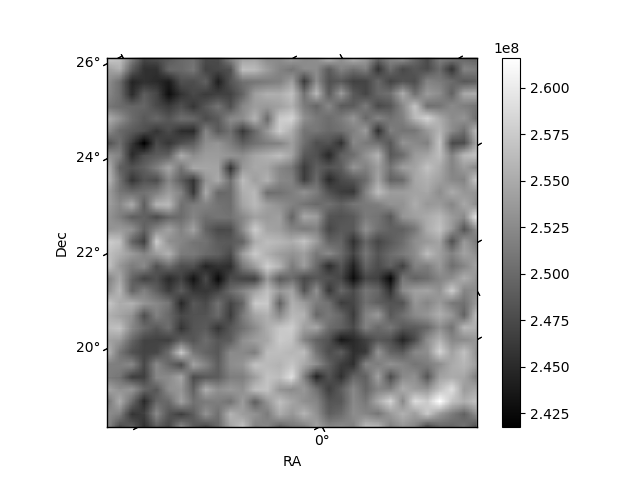
Histogram calculated using DETX and DETY for each event in the final _common_clean file
| Quadrant A | 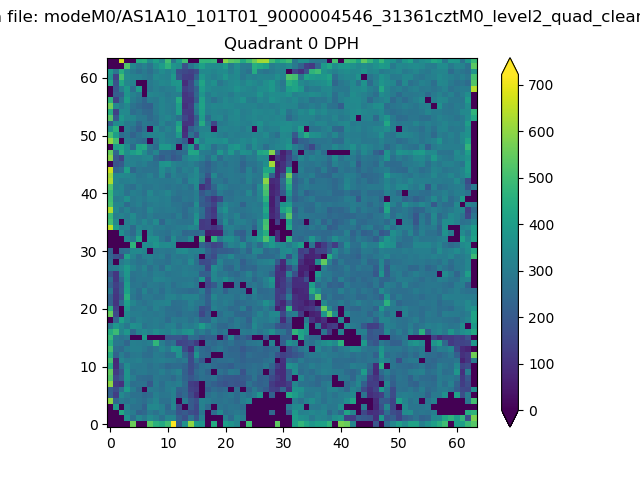 |
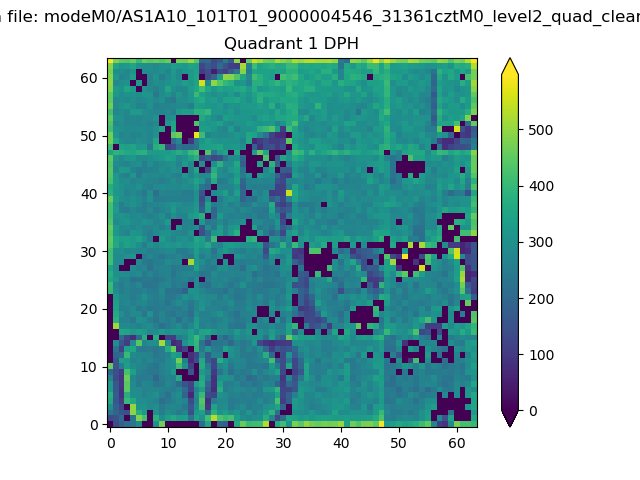 |
Quadrant B |
|---|---|---|---|
| Quadrant D | 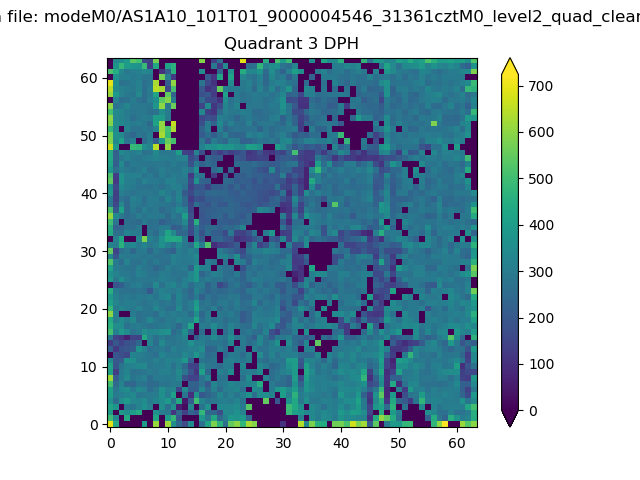 |
 |
Quadrant C |
| Plot type | Count rate plots | Images |
|---|---|---|
| Comparison with Poisson distribution Blue bars denote a histogram of data divided into 1 sec bins. Red curve is a Poisson curve with rate = median count rate of data. |
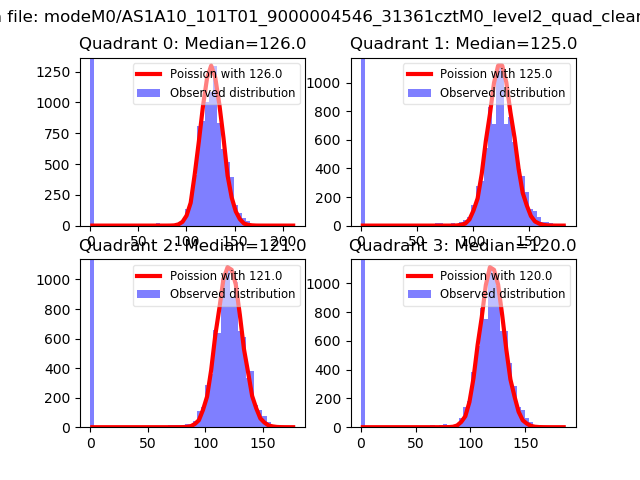 |
 |
| Quadrant-wise count rates Data is divided into 100 sec bins |
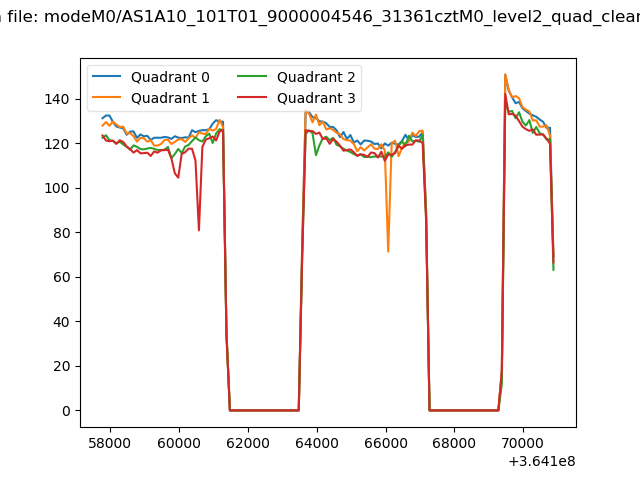 |
|
| Module-wise count rates for Quadrant A Data is divided into 100 sec bins |
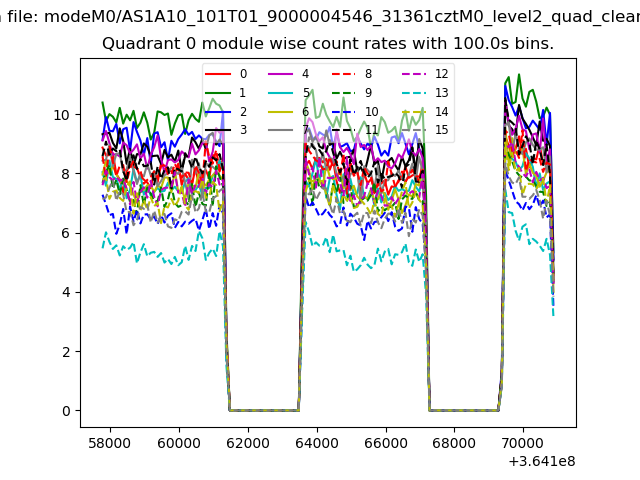 |
 |
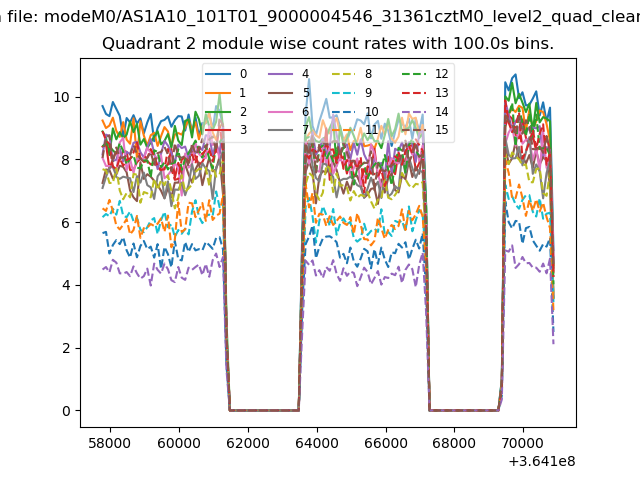
| Module-wise count rates for Quadrant B Data is divided into 100 sec bins |
 |
 |
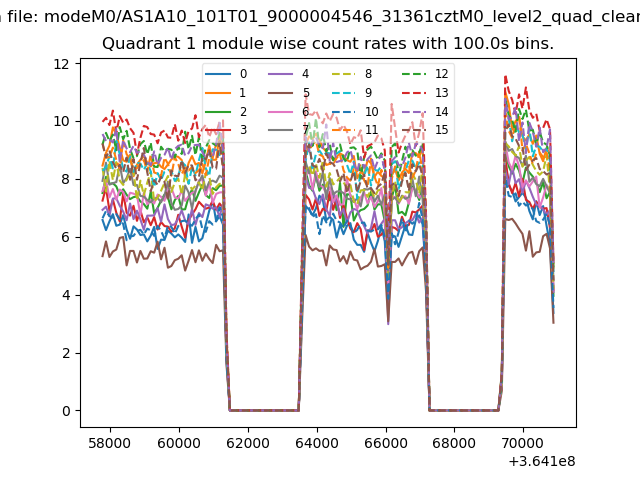
| Module-wise count rates for Quadrant C Data is divided into 100 sec bins |
 |
 |
| Module-wise count rates for Quadrant D Data is divided into 100 sec bins |
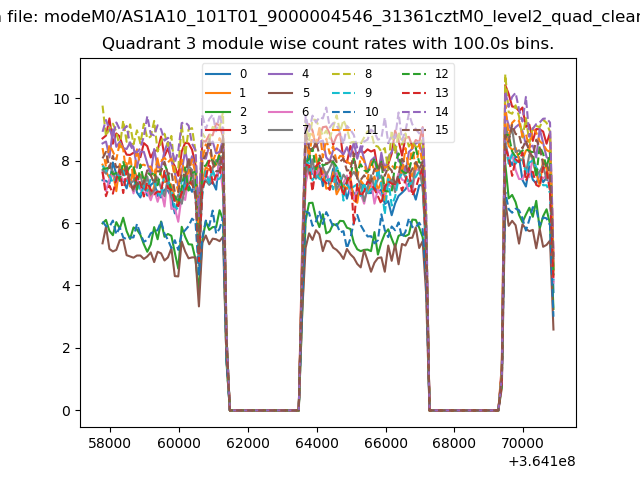 |
 |
| Parameter | Plot |
|---|---|
| CZT HV Monitor | 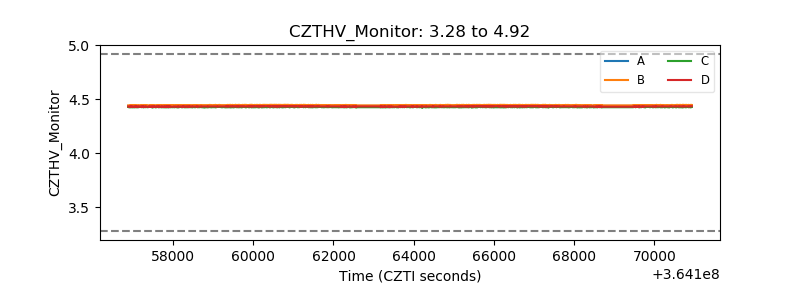 |
| D_VDD | 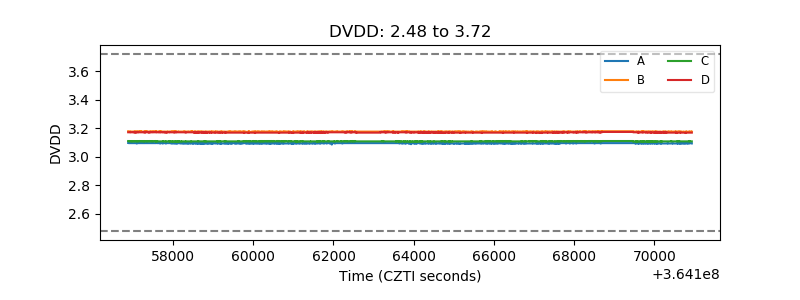 |
| Temperature 1 | 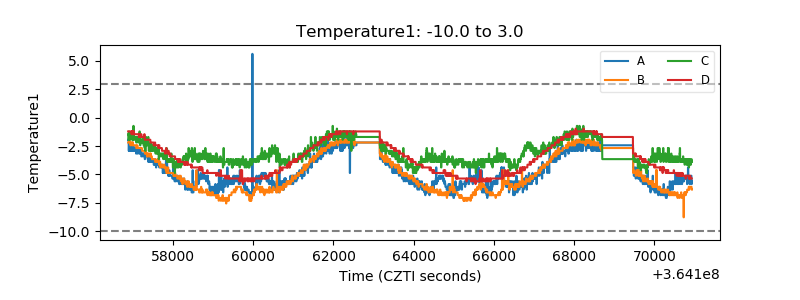 |
| Veto HV Monitor | 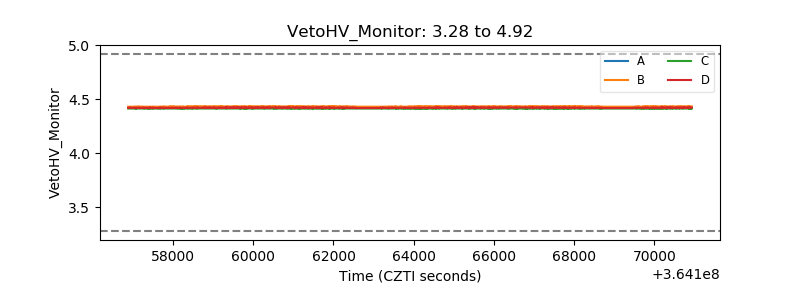 |
| Veto LLD | 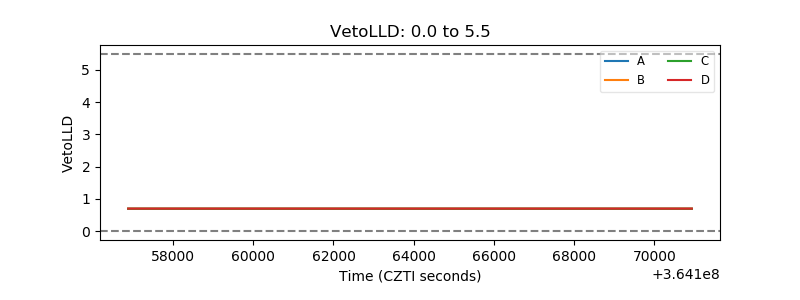 |
| Alpha Counter |  |
| _CPM_Rate | 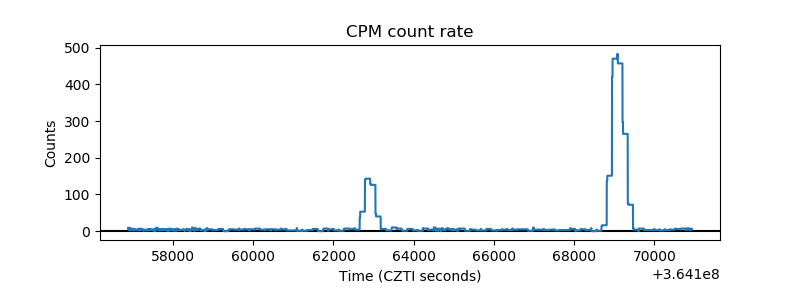 |
| CZT Counter |  |
| +2.5 Volts monitor |  |
| +5 Volts monitor |  |
| _ROLL_ROT | 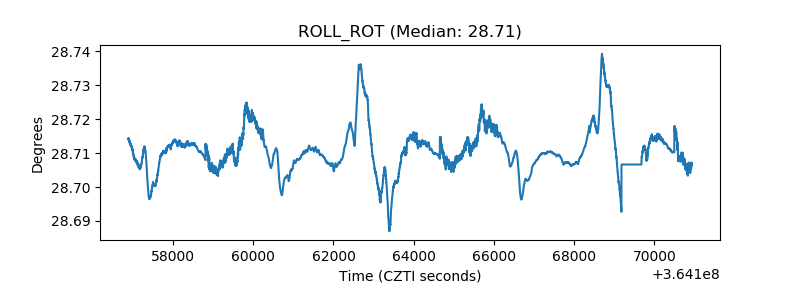 |
| _Roll_DEC | 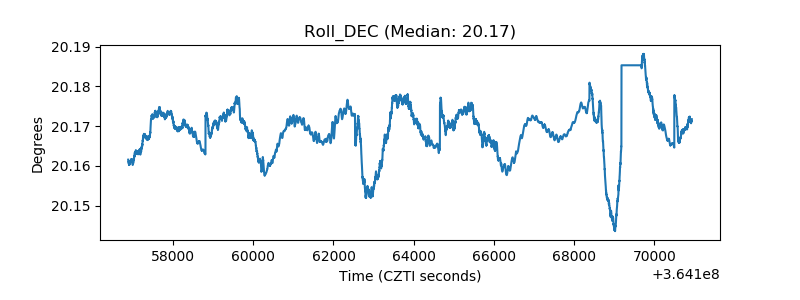 |
| _Roll_RA |  |
| Veto Counter | 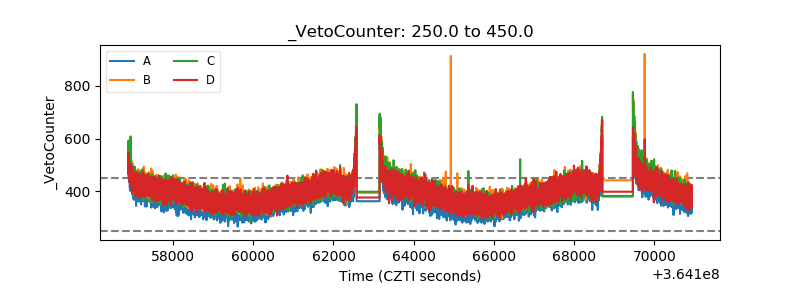 |