| Param | Original file | Final file |
|---|---|---|
| Filename | modeM0/AS1A10_101T01_9000004546_31363cztM0_level2.evt | modeM0/AS1A10_101T01_9000004546_31363cztM0_level2_quad_clean.evt |
| Size (bytes) | 559,249,920 | 94,098,240 |
| Size | 533.3 MB | 89.7 MB |
| Events in quadrant A | 3,191,372 | 618,323 |
| Events in quadrant B | 5,199,717 | 621,244 |
| Events in quadrant C | 4,485,281 | 567,381 |
| Events in quadrant D | 3,613,368 | 582,399 |
| Mode M0 | |||
|---|---|---|---|
| Quadrant | BADHDUFLAG | Total packets | Discarded packets |
| A | 0 | 13776 | 2 |
| B | 0 | 20413 | 2 |
| C | 0 | 17896 | 2 |
| D | 0 | 15269 | 2 |
| Mode SS | |||
|---|---|---|---|
| Quadrant | BADHDUFLAG | Total packets | Discarded packets |
| A | 0 | 132 | 0 |
| B | 0 | 132 | 0 |
| C | 0 | 132 | 0 |
| D | 0 | 132 | 0 |
| Mode M9 | |||
|---|---|---|---|
| Quadrant | BADHDUFLAG | Total packets | Discarded packets |
| A | 0 | 21 | 0 |
| B | 0 | 21 | 0 |
| C | 0 | 21 | 0 |
| D | 0 | 21 | 0 |
| Quadrant | Total seconds | Saturated seconds | Saturation percentage |
|---|---|---|---|
| A | 6613 | 49 | 0.740965% |
| B | 6613 | 186 | 2.812642% |
| C | 6613 | 532 | 8.044760% |
| D | 6613 | 72 | 1.088765% |
Noise dominated data is calculated using 1-second bins in cleaned event files. If a bin has >2000 counts, and if more than 50% of those come from <1% of pixels, then it is considered to be noise-dominated and hence unusable.
| Quadrant | # 1 sec bins | Bins with >0 counts | Bins with >2000 counts | High rate bins dominated by noise | Noise dominated (total time) | Noise dominated (detector-on time) | Marked lightcurve |
|---|---|---|---|---|---|---|---|
| A | 8598 | 6615 | 0 | 0 | 0.00% | 0.00% | 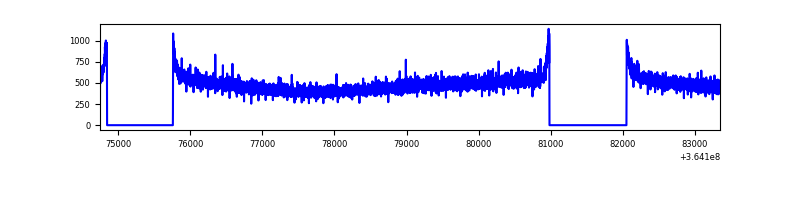 |
| B | 8598 | 6615 | 30 | 30 | 0.35% | 0.45% | 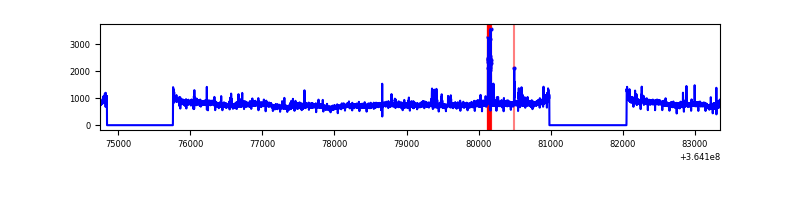 |
| C | 8598 | 6615 | 202 | 202 | 2.35% | 3.05% | 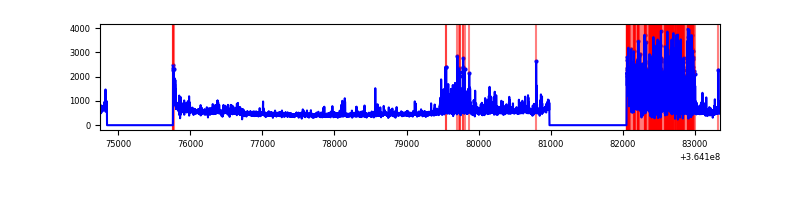 |
| D | 8598 | 6615 | 26 | 26 | 0.30% | 0.39% | 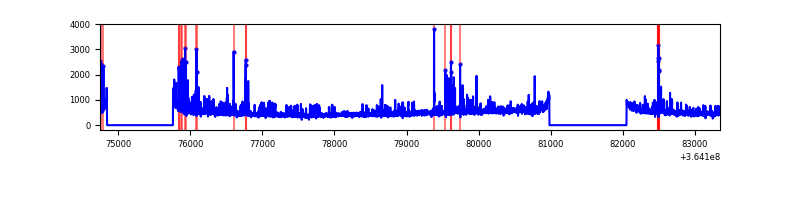 |
Top three noisy pixels from each quadrant. If the there are fewer than three noisy pixels in the level2.evt file, extra rows are filled as -1
| Pixel properties | Quadrant properties | ||||||
|---|---|---|---|---|---|---|---|
| Quadrant | DetID | PixID | Counts | Sigma | Mean | Median | Sigma |
| A | 13 | 254 | 13774 | 77.97 | 827 | 812 | 166.2 |
| A | 3 | 137 | 8466 | 46.04 | 827 | 812 | 166.2 |
| A | 0 | 226 | 6714 | 35.5 | 827 | 812 | 166.2 |
| B | 6 | 159 | 1779365 | 11456.5 | 815 | 792 | 155.2 |
| B | 4 | 80 | 147275 | 943.56 | 815 | 792 | 155.2 |
| B | 0 | 190 | 56894 | 361.38 | 815 | 792 | 155.2 |
| C | 3 | 233 | 1208682 | 6649.28 | 771 | 777 | 181.7 |
| C | 14 | 238 | 134695 | 737.19 | 771 | 777 | 181.7 |
| C | 0 | 10 | 71753 | 390.71 | 771 | 777 | 181.7 |
| D | 8 | 195 | 428436 | 2270.88 | 795 | 775 | 188.3 |
| D | 10 | 203 | 83585 | 439.72 | 795 | 775 | 188.3 |
| D | 2 | 250 | 73166 | 384.4 | 795 | 775 | 188.3 |
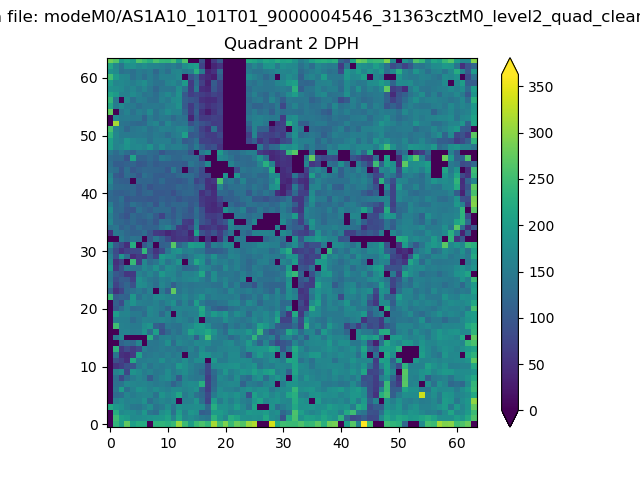
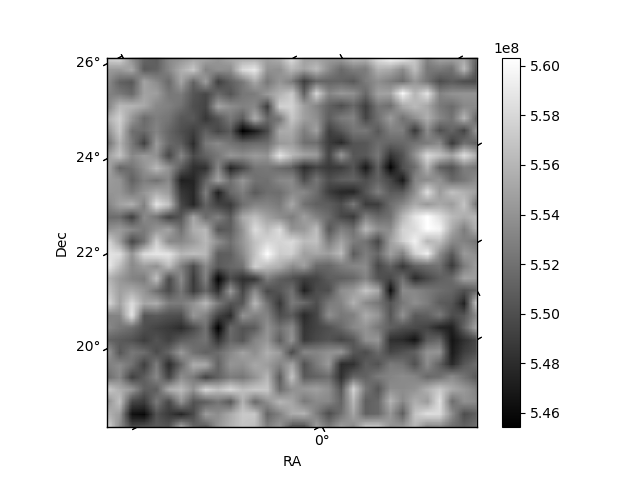
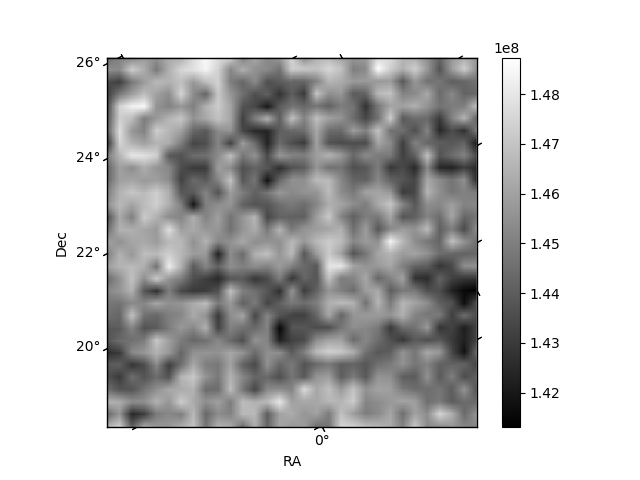
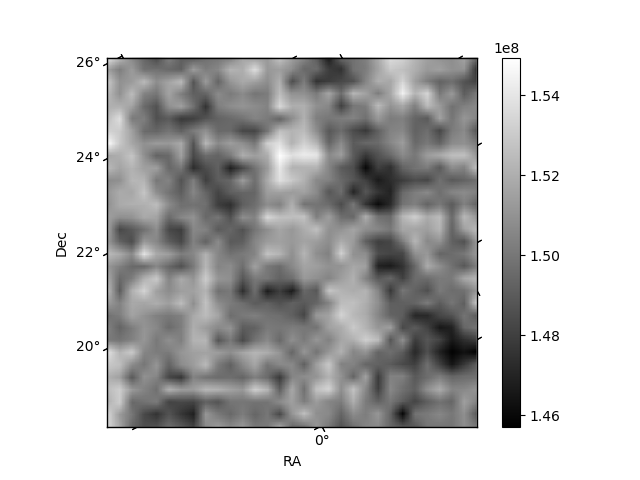
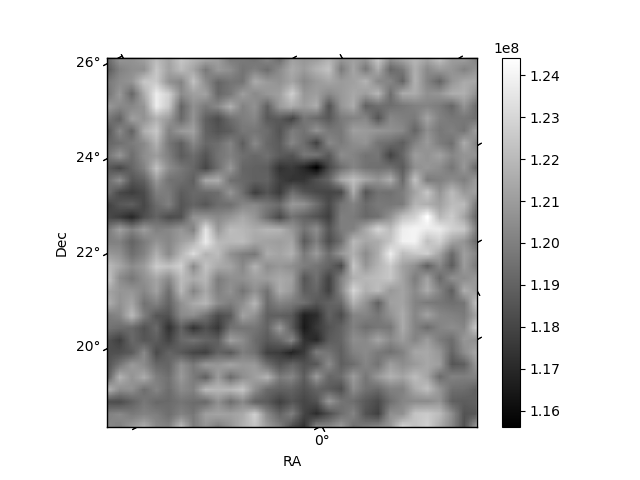
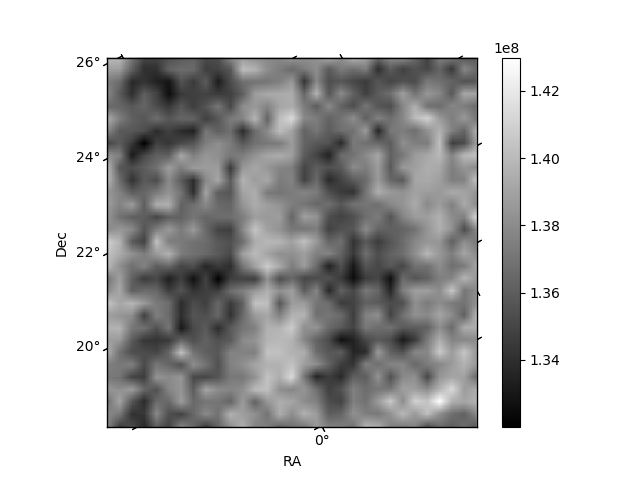
Histogram calculated using DETX and DETY for each event in the final _common_clean file
| Quadrant A | 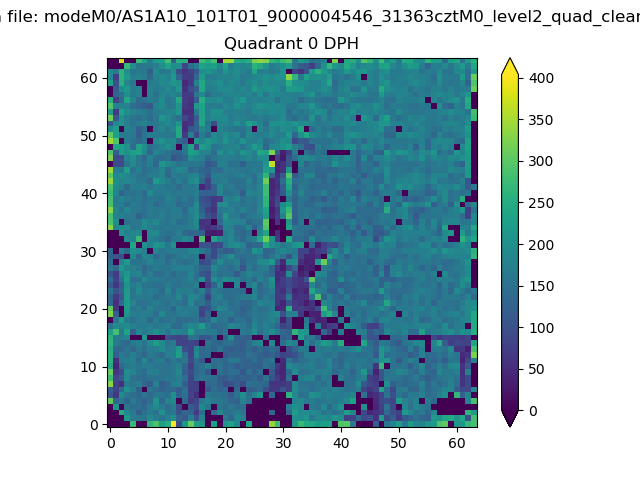 |
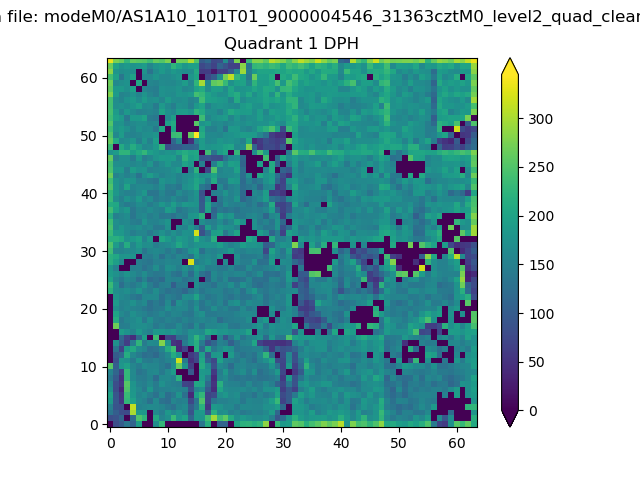 |
Quadrant B |
|---|---|---|---|
| Quadrant D | 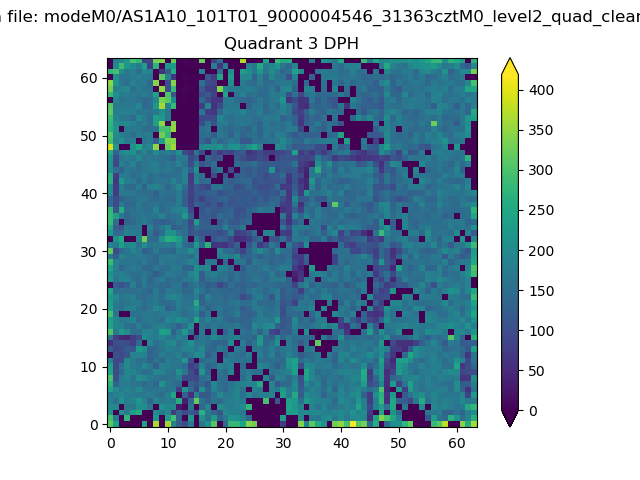 |
 |
Quadrant C |
| Plot type | Count rate plots | Images |
|---|---|---|
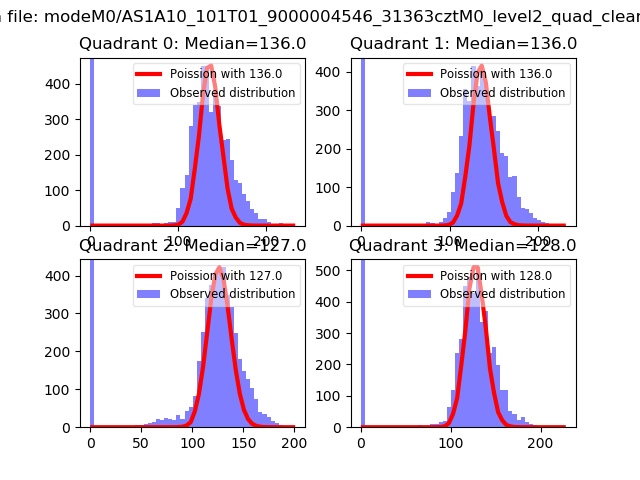
| Comparison with Poisson distribution Blue bars denote a histogram of data divided into 1 sec bins. Red curve is a Poisson curve with rate = median count rate of data. |
 |
 |
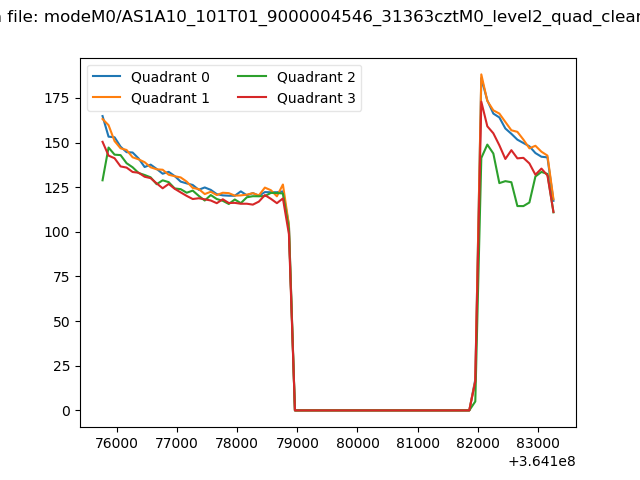
| Quadrant-wise count rates Data is divided into 100 sec bins |
 |
|
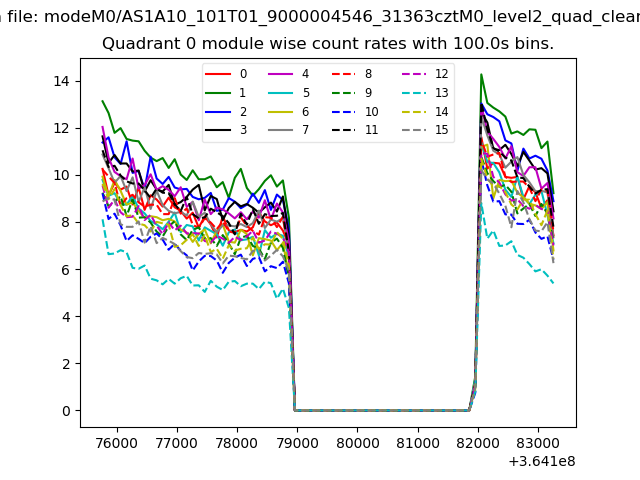
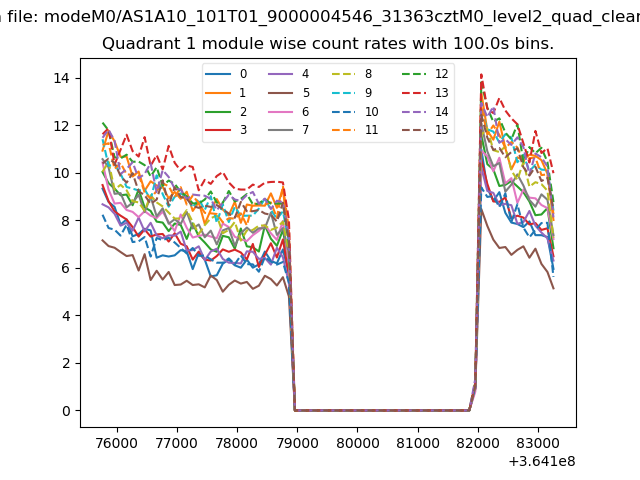
| Module-wise count rates for Quadrant A Data is divided into 100 sec bins |
 |
 |
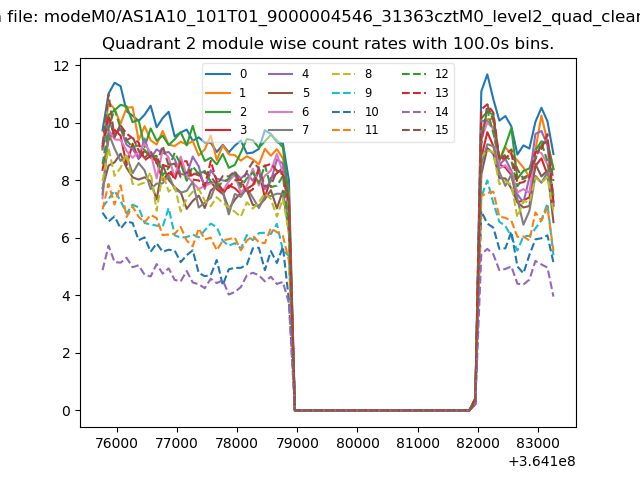
| Module-wise count rates for Quadrant B Data is divided into 100 sec bins |
 |
 |
| Module-wise count rates for Quadrant C Data is divided into 100 sec bins |
 |
 |
| Module-wise count rates for Quadrant D Data is divided into 100 sec bins |
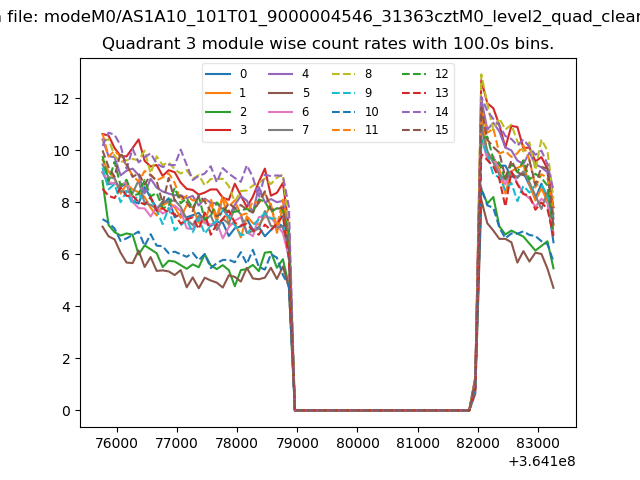 |
 |
| Parameter | Plot |
|---|---|
| CZT HV Monitor | 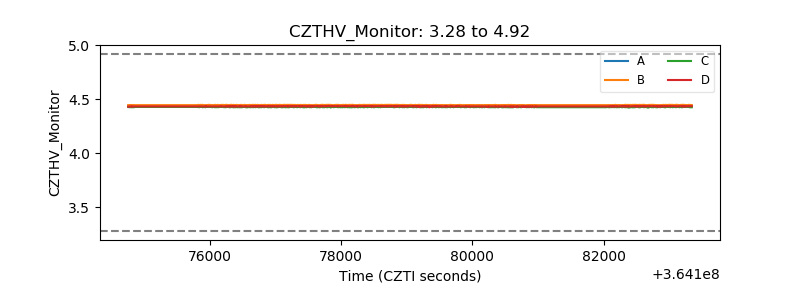 |
| D_VDD | 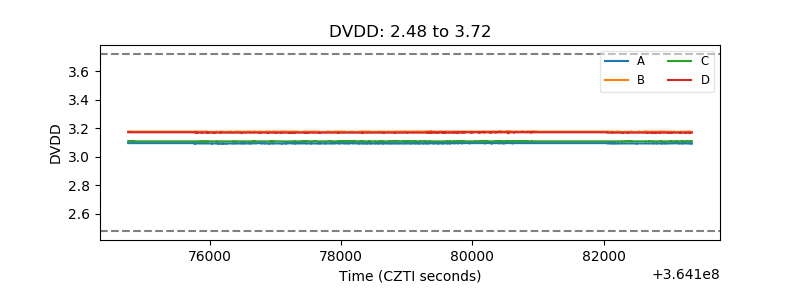 |
| Temperature 1 | 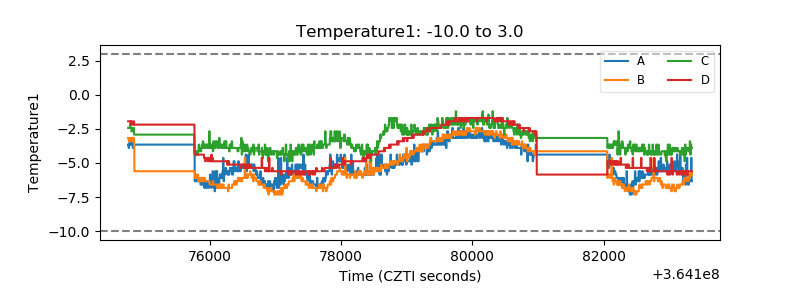 |
| Veto HV Monitor | 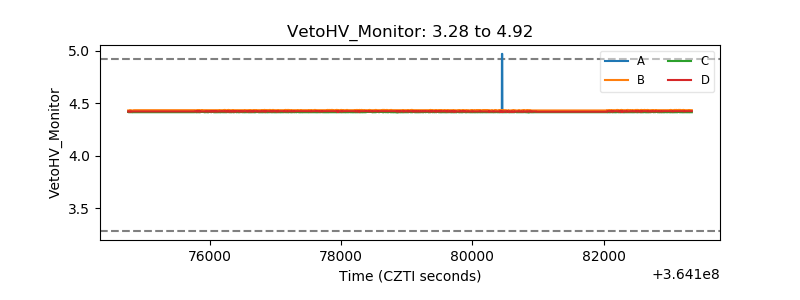 |
| Veto LLD | 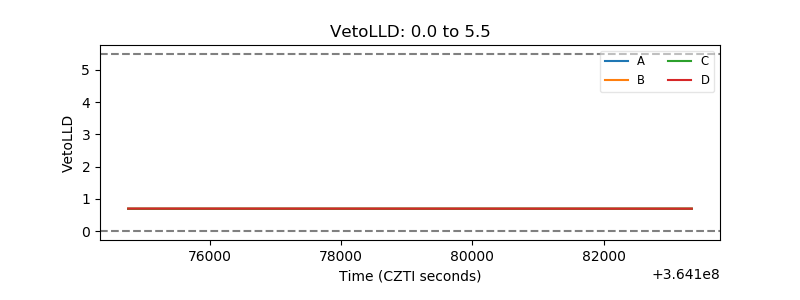 |
| Alpha Counter | 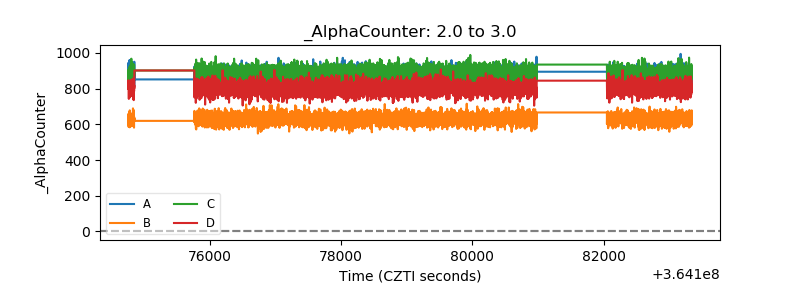 |
| _CPM_Rate | 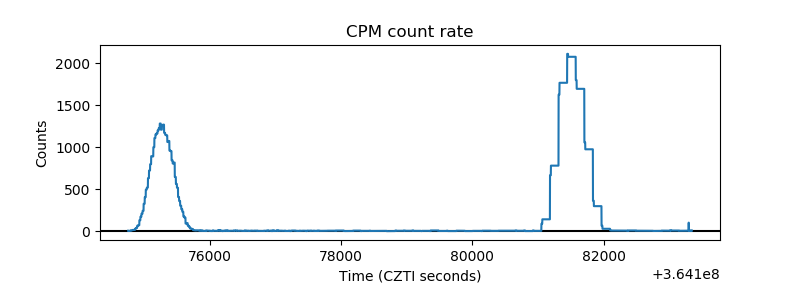 |
| CZT Counter | 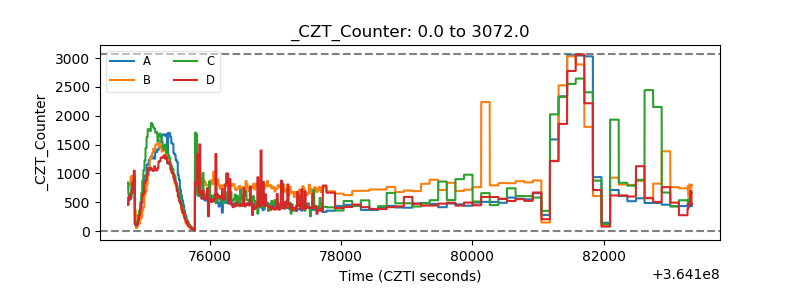 |
| +2.5 Volts monitor |  |
| +5 Volts monitor |  |
| _ROLL_ROT | 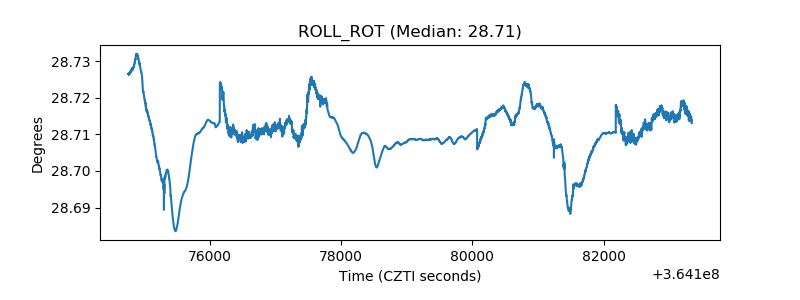 |
| _Roll_DEC | 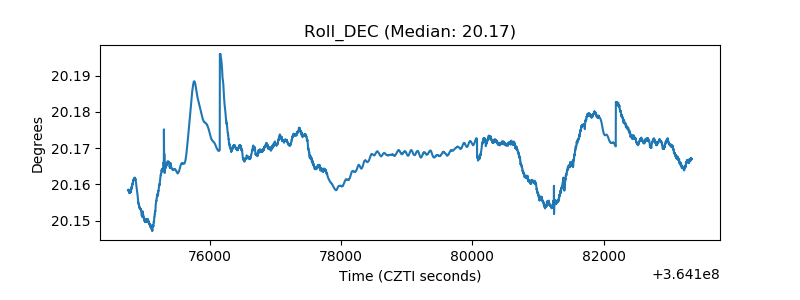 |
| _Roll_RA |  |
| Veto Counter | 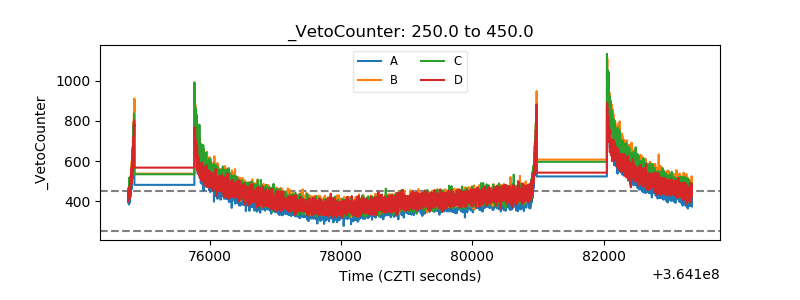 |