| Param | Original file | Final file |
|---|---|---|
| Filename | modeM0/AS1A10_101T01_9000004546_31367cztM0_level2.evt | modeM0/AS1A10_101T01_9000004546_31367cztM0_level2_quad_clean.evt |
| Size (bytes) | 521,280,000 | 94,014,720 |
| Size | 497.1 MB | 89.7 MB |
| Events in quadrant A | 3,251,244 | 630,660 |
| Events in quadrant B | 4,951,595 | 626,799 |
| Events in quadrant C | 3,825,162 | 581,464 |
| Events in quadrant D | 3,349,541 | 585,921 |
| Mode M0 | |||
|---|---|---|---|
| Quadrant | BADHDUFLAG | Total packets | Discarded packets |
| A | 0 | 12983 | 1 |
| B | 0 | 18644 | 1 |
| C | 0 | 15333 | 1 |
| D | 0 | 13604 | 1 |
| Mode SS | |||
|---|---|---|---|
| Quadrant | BADHDUFLAG | Total packets | Discarded packets |
| A | 0 | 124 | 0 |
| B | 0 | 124 | 0 |
| C | 0 | 124 | 0 |
| D | 0 | 124 | 0 |
| Mode M9 | |||
|---|---|---|---|
| Quadrant | BADHDUFLAG | Total packets | Discarded packets |
| A | 0 | 13 | 0 |
| B | 0 | 13 | 0 |
| C | 0 | 13 | 0 |
| D | 0 | 13 | 0 |
| Quadrant | Total seconds | Saturated seconds | Saturation percentage |
|---|---|---|---|
| A | 6042 | 70 | 1.158557% |
| B | 6042 | 132 | 2.184707% |
| C | 6042 | 227 | 3.757034% |
| D | 6042 | 76 | 1.257862% |
Noise dominated data is calculated using 1-second bins in cleaned event files. If a bin has >2000 counts, and if more than 50% of those come from <1% of pixels, then it is considered to be noise-dominated and hence unusable.
| Quadrant | # 1 sec bins | Bins with >0 counts | Bins with >2000 counts | High rate bins dominated by noise | Noise dominated (total time) | Noise dominated (detector-on time) | Marked lightcurve |
|---|---|---|---|---|---|---|---|
| A | 7352 | 6043 | 0 | 0 | 0.00% | 0.00% | 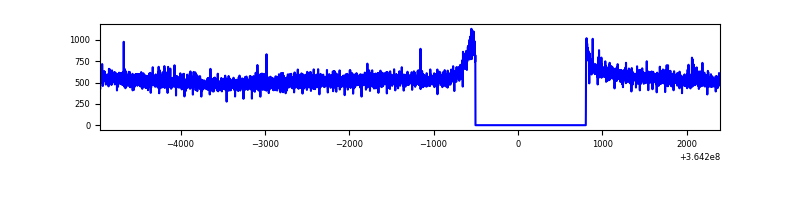 |
| B | 7352 | 6043 | 3 | 3 | 0.04% | 0.05% | 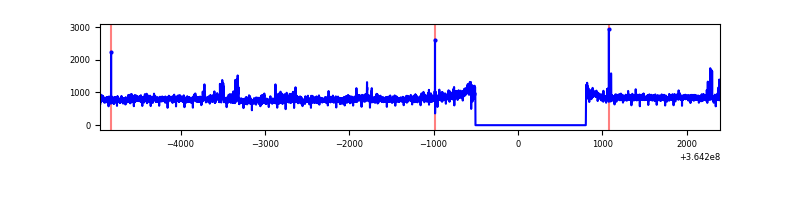 |
| C | 7352 | 6043 | 34 | 34 | 0.46% | 0.56% | 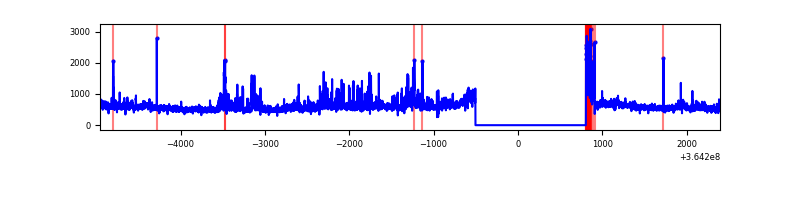 |
| D | 7352 | 6043 | 7 | 7 | 0.10% | 0.12% | 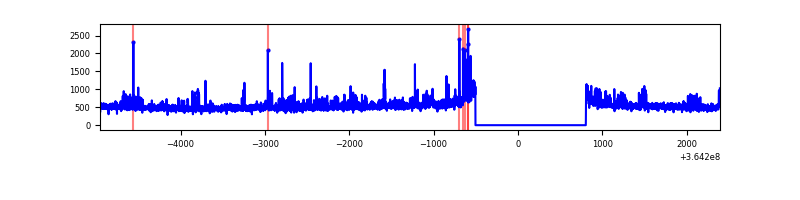 |
Top three noisy pixels from each quadrant. If the there are fewer than three noisy pixels in the level2.evt file, extra rows are filled as -1
| Pixel properties | Quadrant properties | ||||||
|---|---|---|---|---|---|---|---|
| Quadrant | DetID | PixID | Counts | Sigma | Mean | Median | Sigma |
| A | 13 | 254 | 11360 | 63.1 | 841 | 827 | 166.9 |
| A | 3 | 137 | 7817 | 41.87 | 841 | 827 | 166.9 |
| A | 0 | 226 | 7322 | 38.91 | 841 | 827 | 166.9 |
| B | 6 | 159 | 1612026 | 10482.8 | 815 | 796 | 153.7 |
| B | 4 | 80 | 71547 | 460.31 | 815 | 796 | 153.7 |
| B | 0 | 190 | 64869 | 416.86 | 815 | 796 | 153.7 |
| C | 3 | 233 | 450625 | 2517.8 | 775 | 783 | 178.7 |
| C | 14 | 238 | 140372 | 781.29 | 775 | 783 | 178.7 |
| C | 0 | 10 | 111341 | 618.8 | 775 | 783 | 178.7 |
| D | 8 | 195 | 191498 | 1028.37 | 799 | 784 | 185.5 |
| D | 10 | 203 | 57446 | 305.53 | 799 | 784 | 185.5 |
| D | 2 | 250 | 43101 | 228.18 | 799 | 784 | 185.5 |
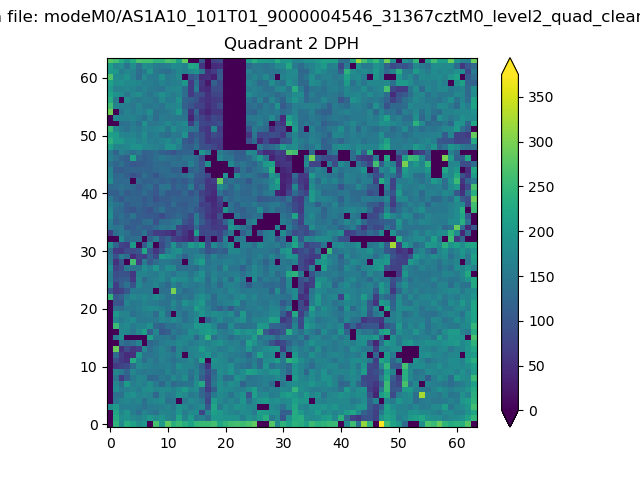
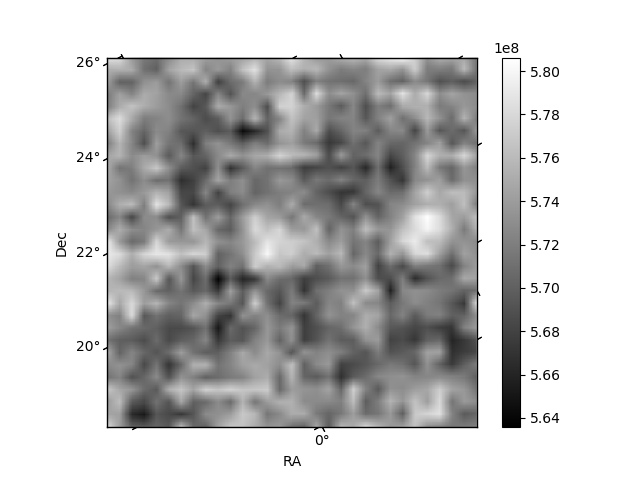
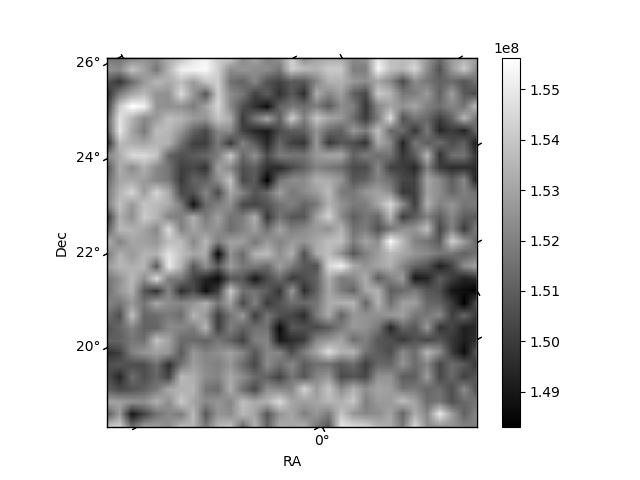
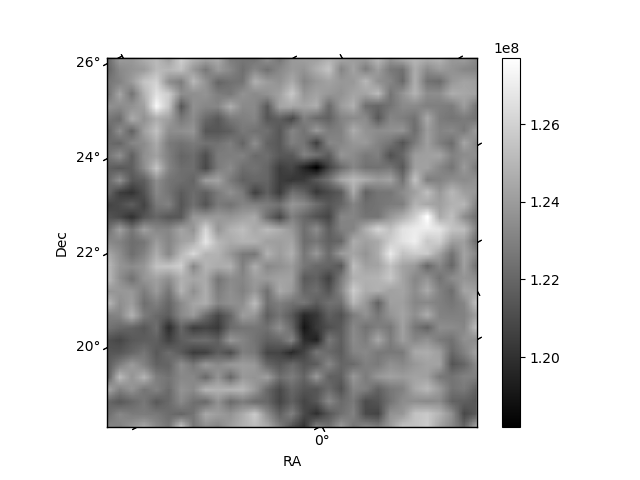
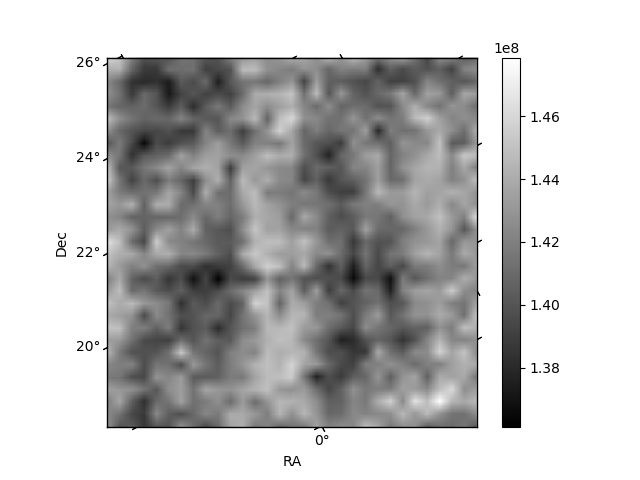
Histogram calculated using DETX and DETY for each event in the final _common_clean file
| Quadrant A | 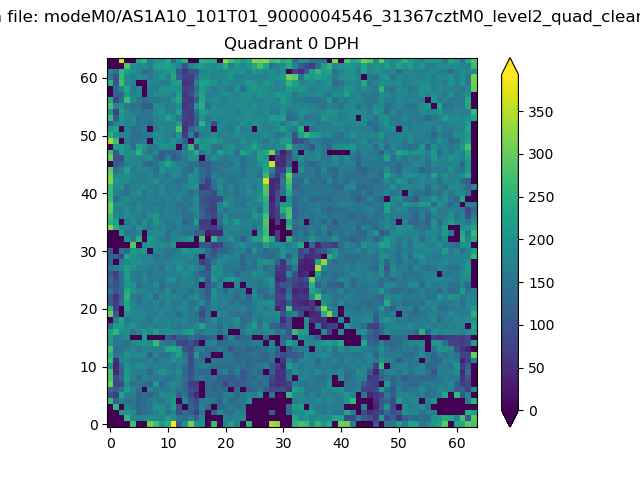 |
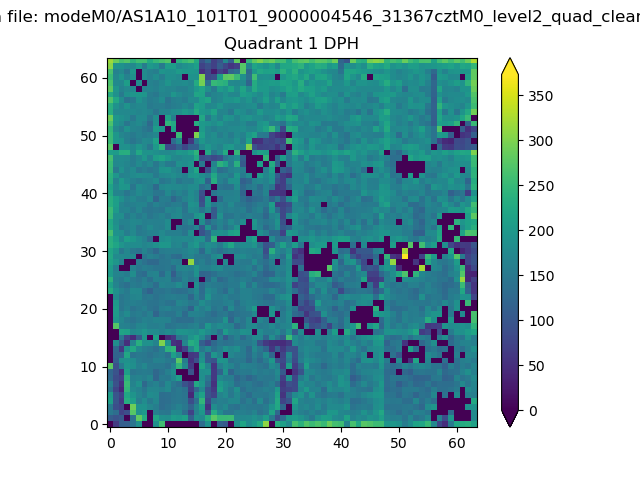 |
Quadrant B |
|---|---|---|---|
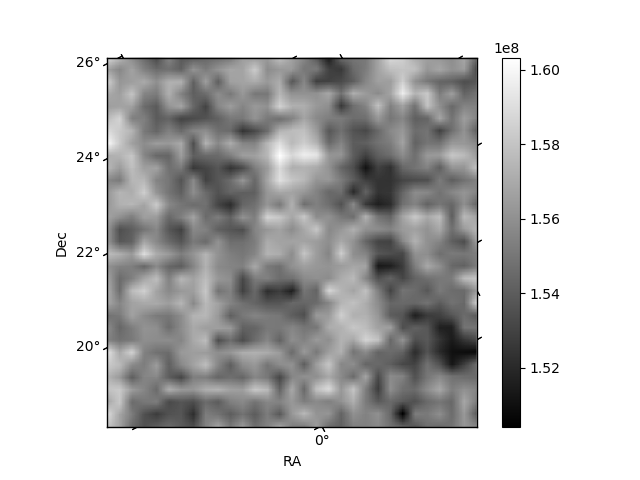
| Quadrant D | 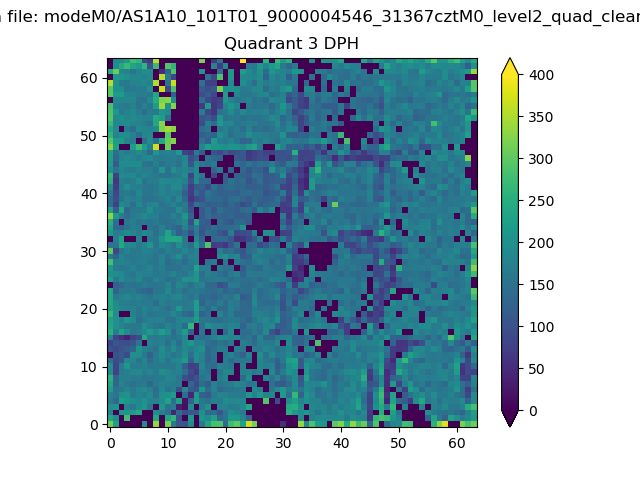 |
 |
Quadrant C |
| Plot type | Count rate plots | Images |
|---|---|---|
| Comparison with Poisson distribution Blue bars denote a histogram of data divided into 1 sec bins. Red curve is a Poisson curve with rate = median count rate of data. |
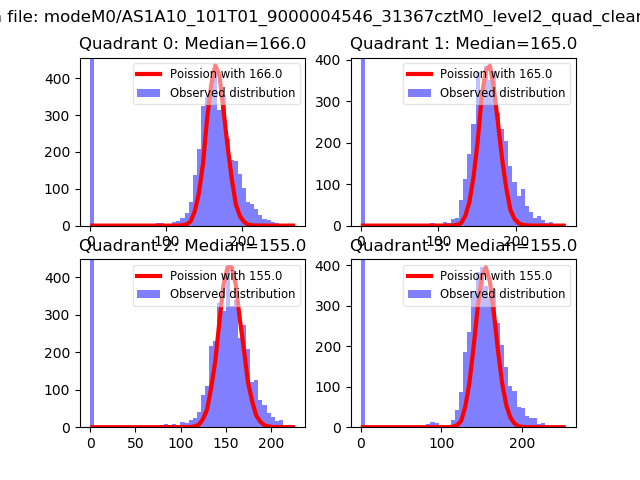 |
 |
| Quadrant-wise count rates Data is divided into 100 sec bins |
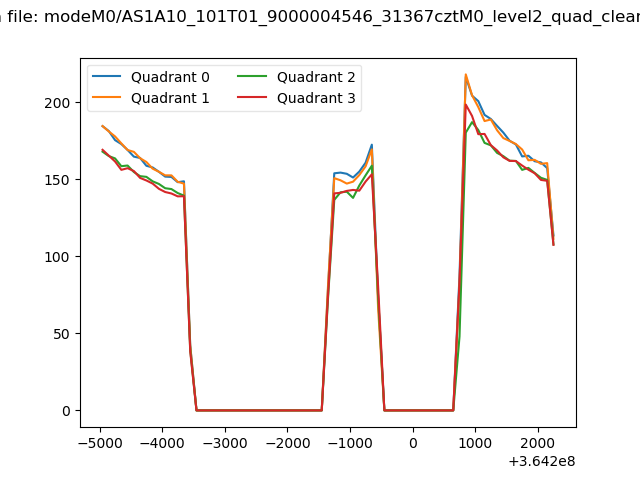 |
|
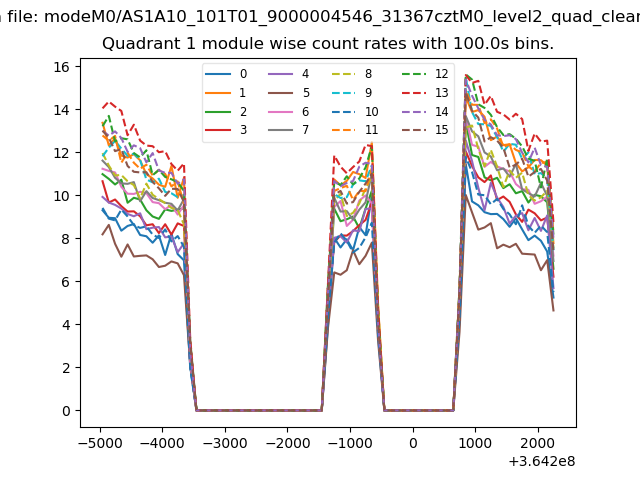
| Module-wise count rates for Quadrant A Data is divided into 100 sec bins |
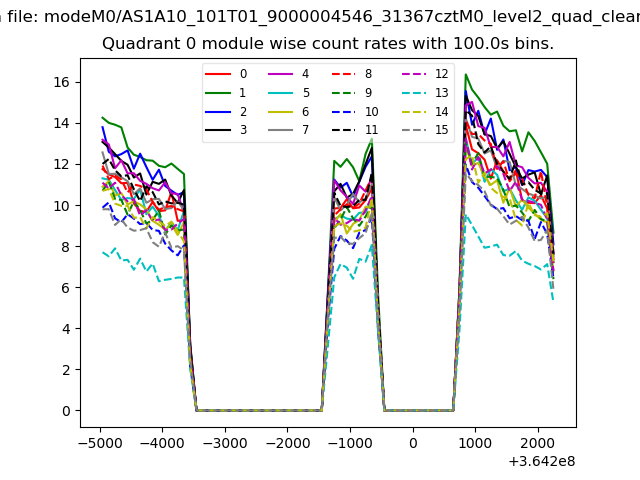 |
 |
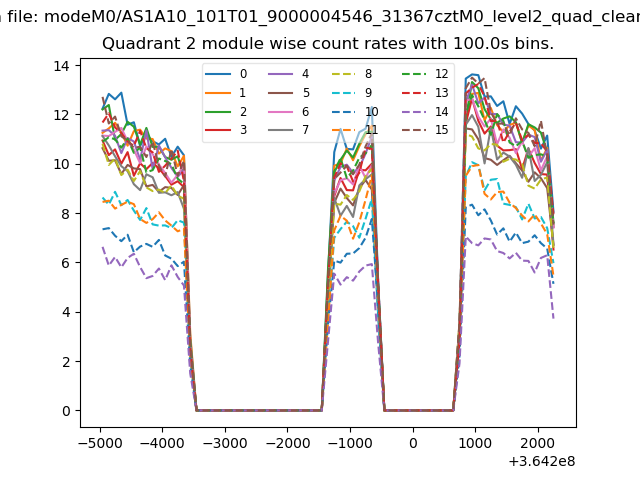
| Module-wise count rates for Quadrant B Data is divided into 100 sec bins |
 |
 |
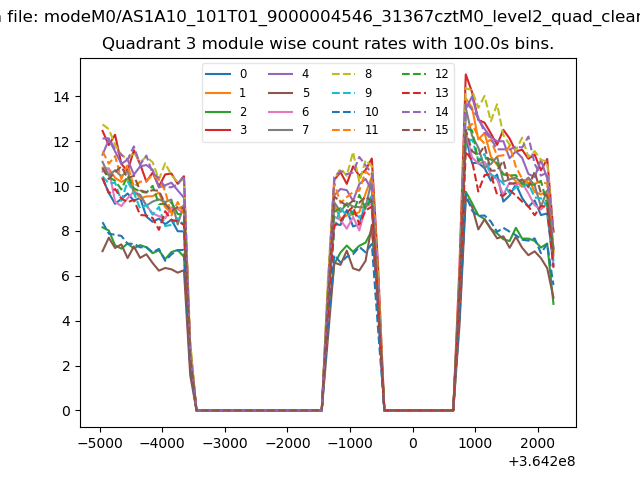
| Module-wise count rates for Quadrant C Data is divided into 100 sec bins |
 |
 |
| Module-wise count rates for Quadrant D Data is divided into 100 sec bins |
 |
 |
| Parameter | Plot |
|---|---|
| CZT HV Monitor | 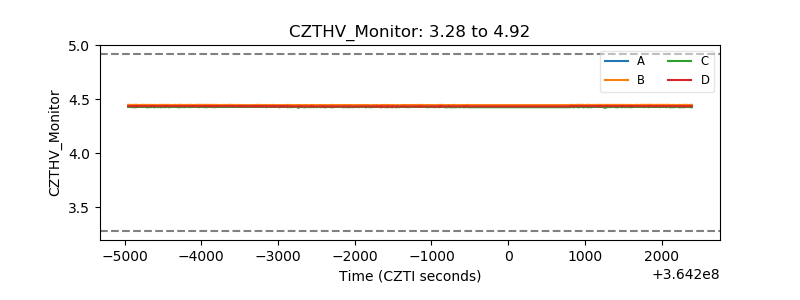 |
| D_VDD | 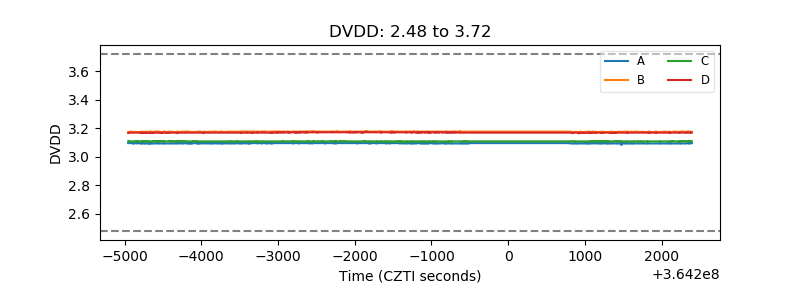 |
| Temperature 1 | 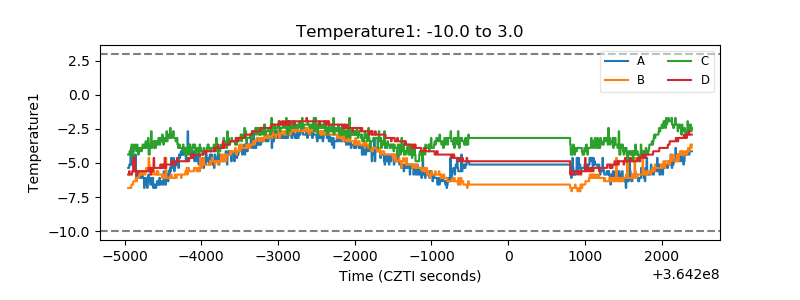 |
| Veto HV Monitor | 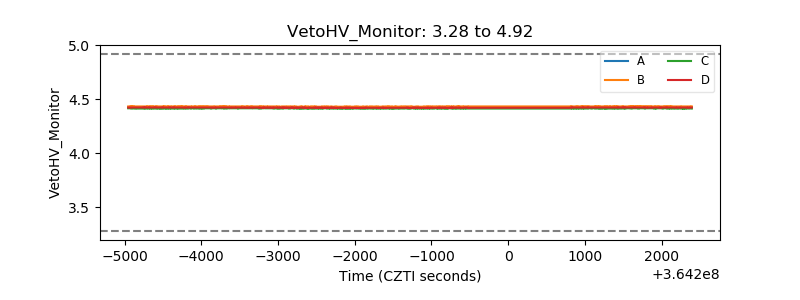 |
| Veto LLD | 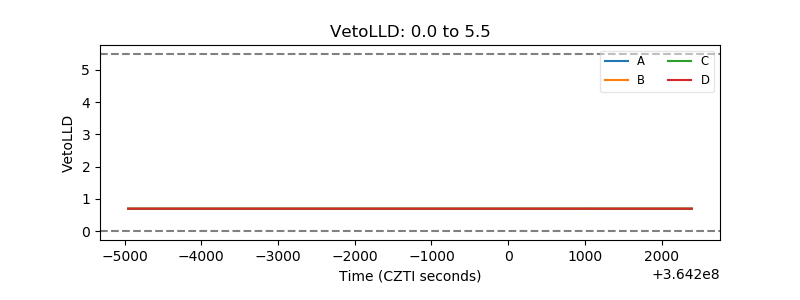 |
| Alpha Counter | 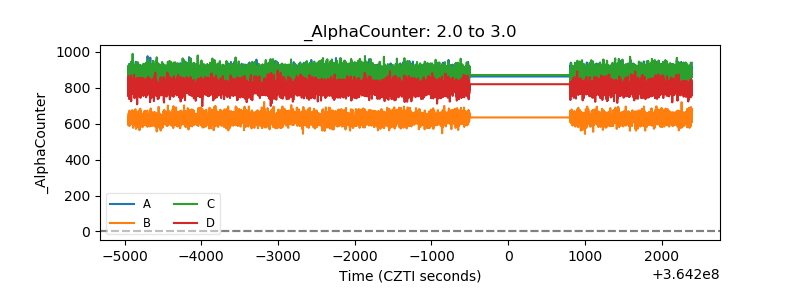 |
| _CPM_Rate | 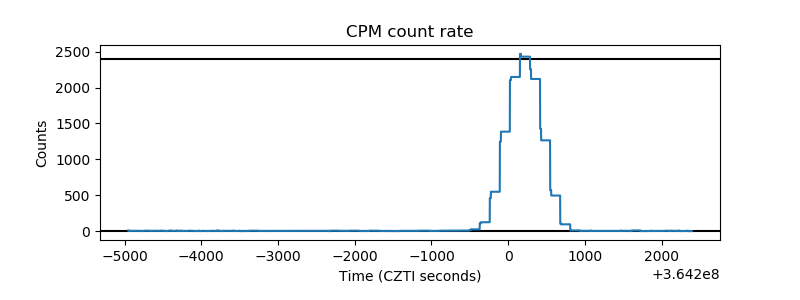 |
| CZT Counter | 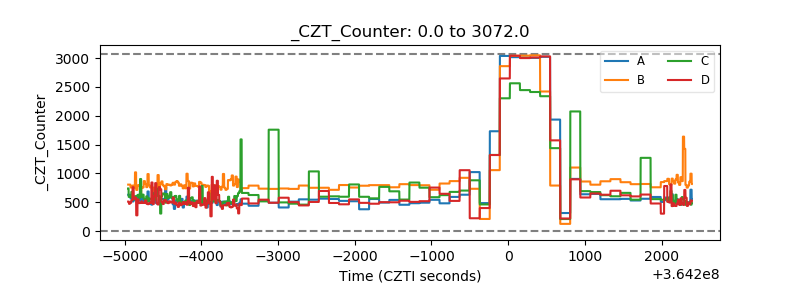 |
| +2.5 Volts monitor |  |
| +5 Volts monitor |  |
| _ROLL_ROT | 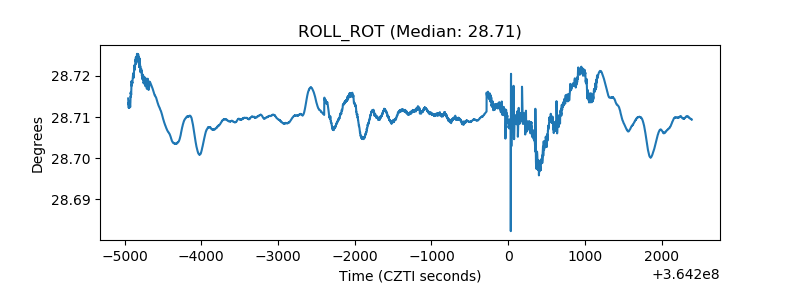 |
| _Roll_DEC | 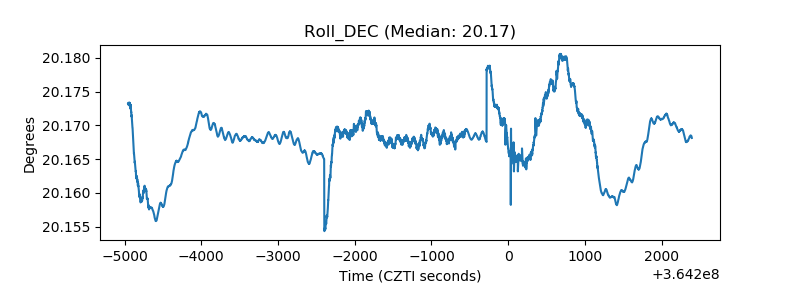 |
| _Roll_RA | 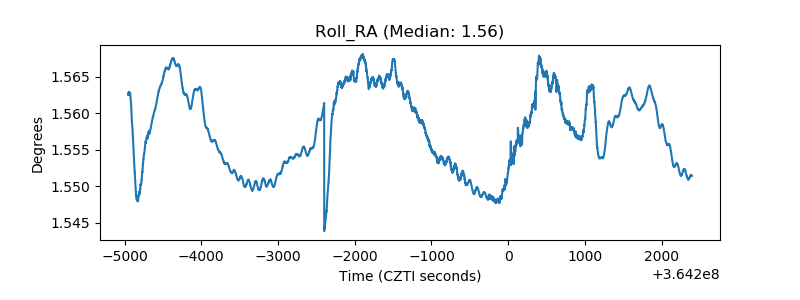 |
| Veto Counter | 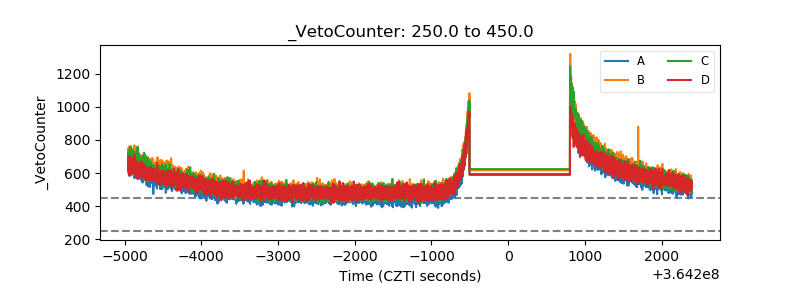 |