| Param | Original file | Final file |
|---|---|---|
| Filename | modeM0/AS1A10_101T01_9000004546_31369cztM0_level2.evt | modeM0/AS1A10_101T01_9000004546_31369cztM0_level2_quad_clean.evt |
| Size (bytes) | 558,587,520 | 82,598,400 |
| Size | 532.7 MB | 78.8 MB |
| Events in quadrant A | 3,426,951 | 529,994 |
| Events in quadrant B | 5,308,481 | 521,102 |
| Events in quadrant C | 3,905,365 | 493,805 |
| Events in quadrant D | 3,831,590 | 498,442 |
| Mode M0 | |||
|---|---|---|---|
| Quadrant | BADHDUFLAG | Total packets | Discarded packets |
| A | 0 | 13730 | 1 |
| B | 0 | 20107 | 1 |
| C | 0 | 15475 | 1 |
| D | 0 | 15258 | 1 |
| Mode SS | |||
|---|---|---|---|
| Quadrant | BADHDUFLAG | Total packets | Discarded packets |
| A | 0 | 134 | 0 |
| B | 0 | 134 | 0 |
| C | 0 | 134 | 0 |
| D | 0 | 134 | 0 |
| Mode M9 | |||
|---|---|---|---|
| Quadrant | BADHDUFLAG | Total packets | Discarded packets |
| A | 0 | 12 | 0 |
| B | 0 | 12 | 0 |
| C | 0 | 12 | 0 |
| D | 0 | 12 | 0 |
| Quadrant | Total seconds | Saturated seconds | Saturation percentage |
|---|---|---|---|
| A | 6561 | 120 | 1.828989% |
| B | 6562 | 195 | 2.971655% |
| C | 6561 | 208 | 3.170248% |
| D | 6561 | 97 | 1.478433% |
Noise dominated data is calculated using 1-second bins in cleaned event files. If a bin has >2000 counts, and if more than 50% of those come from <1% of pixels, then it is considered to be noise-dominated and hence unusable.
| Quadrant | # 1 sec bins | Bins with >0 counts | Bins with >2000 counts | High rate bins dominated by noise | Noise dominated (total time) | Noise dominated (detector-on time) | Marked lightcurve |
|---|---|---|---|---|---|---|---|
| A | 7736 | 6561 | 0 | 0 | 0.00% | 0.00% | 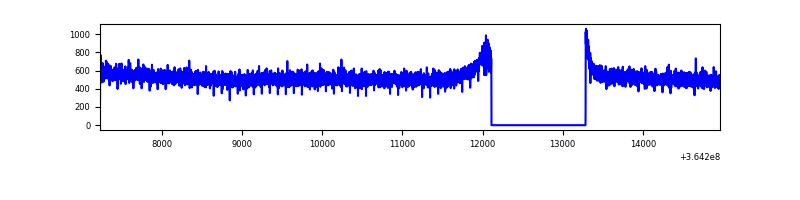 |
| B | 7737 | 6562 | 8 | 8 | 0.10% | 0.12% | 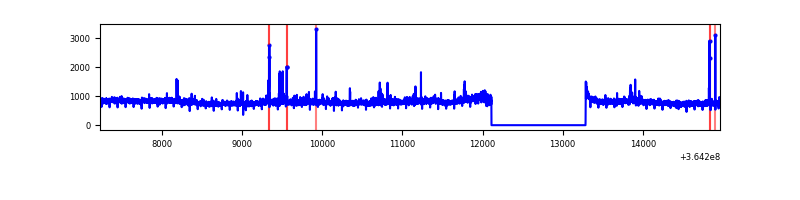 |
| C | 7736 | 6562 | 32 | 32 | 0.41% | 0.49% | 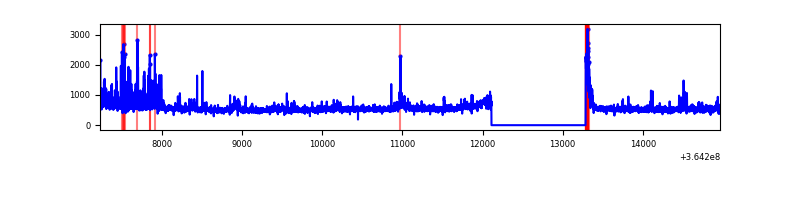 |
| D | 7736 | 6562 | 11 | 11 | 0.14% | 0.17% | 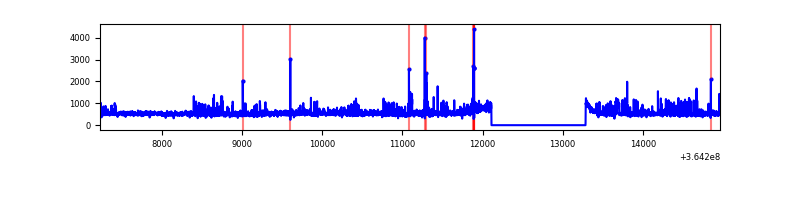 |
Top three noisy pixels from each quadrant. If the there are fewer than three noisy pixels in the level2.evt file, extra rows are filled as -1
| Pixel properties | Quadrant properties | ||||||
|---|---|---|---|---|---|---|---|
| Quadrant | DetID | PixID | Counts | Sigma | Mean | Median | Sigma |
| A | 13 | 254 | 11028 | 57.61 | 888 | 873 | 176.3 |
| A | 3 | 137 | 8310 | 42.19 | 888 | 873 | 176.3 |
| A | 0 | 226 | 7539 | 37.81 | 888 | 873 | 176.3 |
| B | 6 | 159 | 1768667 | 10764.38 | 861 | 839 | 164.2 |
| B | 4 | 80 | 55316 | 331.71 | 861 | 839 | 164.2 |
| B | 0 | 229 | 50101 | 299.96 | 861 | 839 | 164.2 |
| C | 3 | 233 | 404460 | 2127.23 | 823 | 829 | 189.7 |
| C | 14 | 238 | 141996 | 743.98 | 823 | 829 | 189.7 |
| C | 0 | 10 | 120517 | 630.78 | 823 | 829 | 189.7 |
| D | 8 | 195 | 423358 | 2109.13 | 853 | 831 | 200.3 |
| D | 10 | 203 | 95923 | 474.67 | 853 | 831 | 200.3 |
| D | 2 | 250 | 68743 | 339.0 | 853 | 831 | 200.3 |
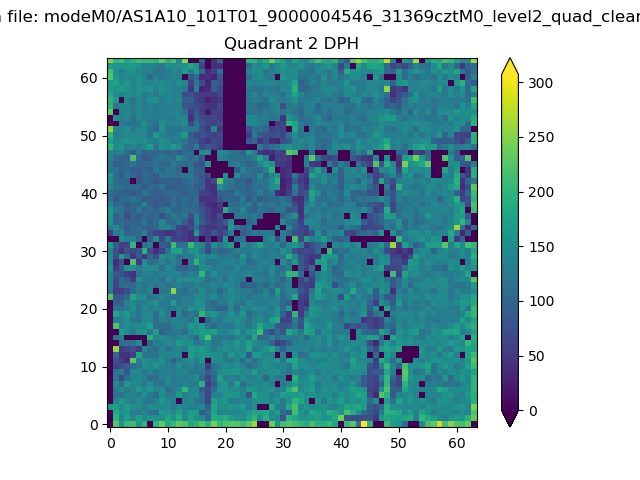
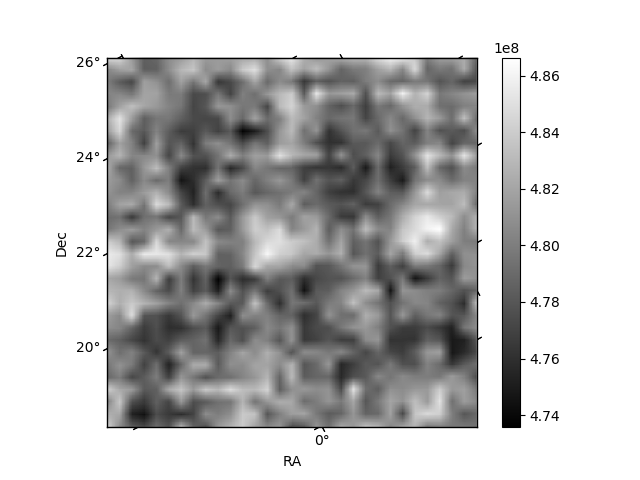
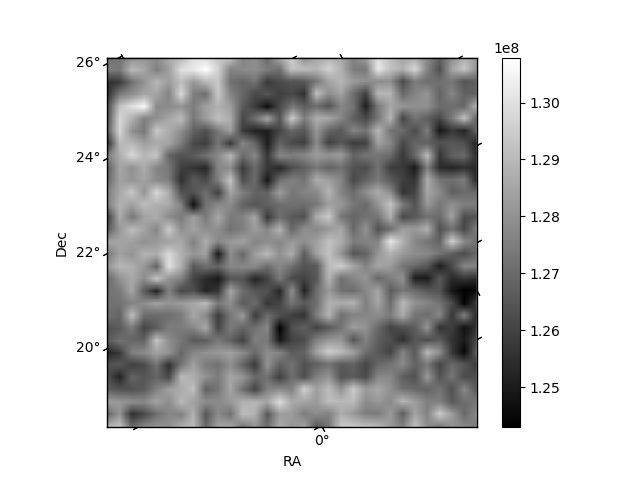
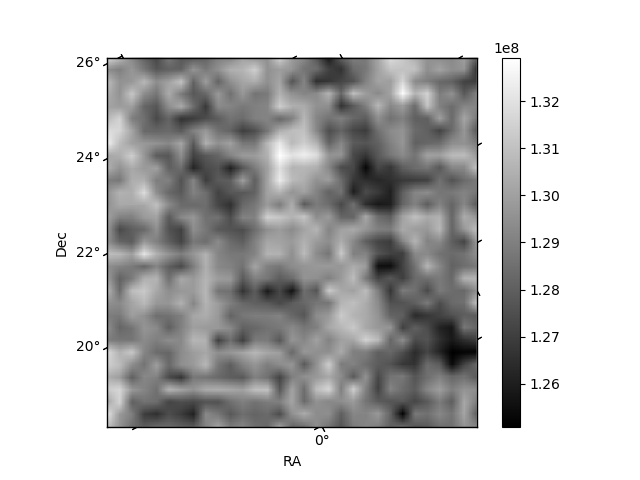
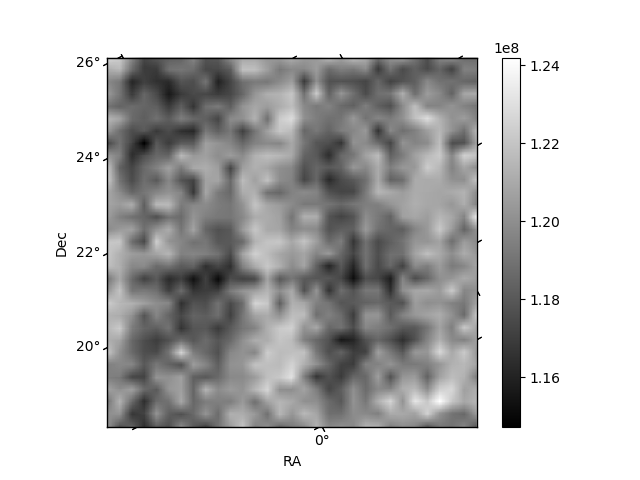
Histogram calculated using DETX and DETY for each event in the final _common_clean file
| Quadrant A | 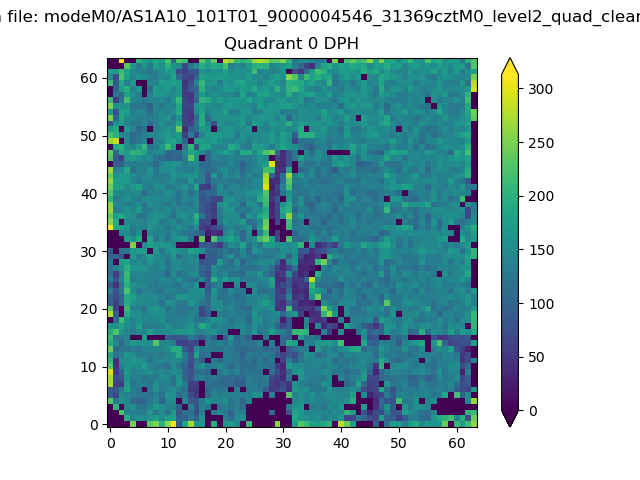 |
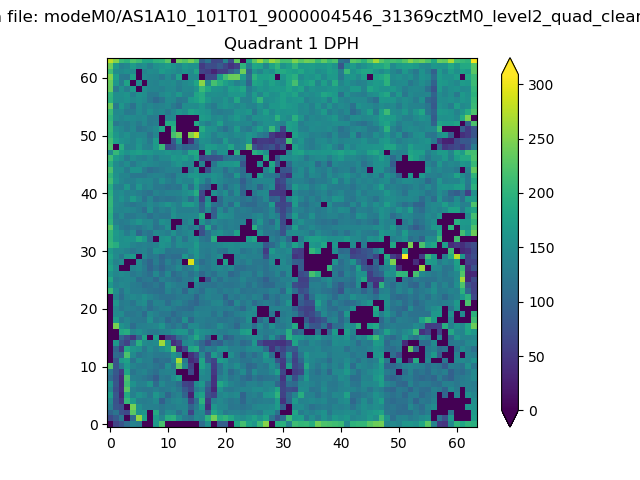 |
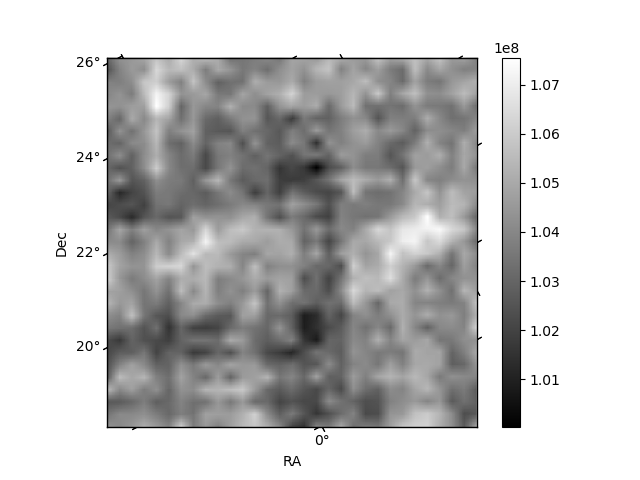
Quadrant B |
|---|---|---|---|
| Quadrant D | 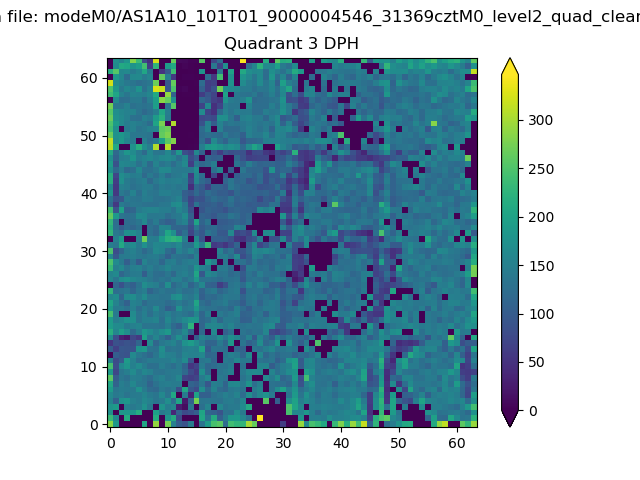 |
 |
Quadrant C |
| Plot type | Count rate plots | Images |
|---|---|---|
| Comparison with Poisson distribution Blue bars denote a histogram of data divided into 1 sec bins. Red curve is a Poisson curve with rate = median count rate of data. |
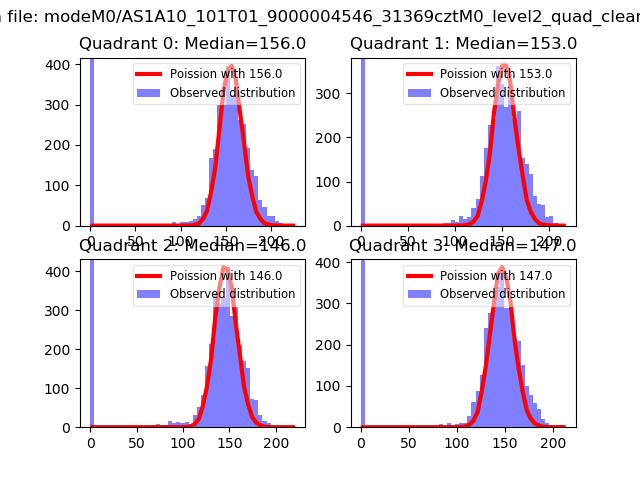 |
 |
| Quadrant-wise count rates Data is divided into 100 sec bins |
 |
|
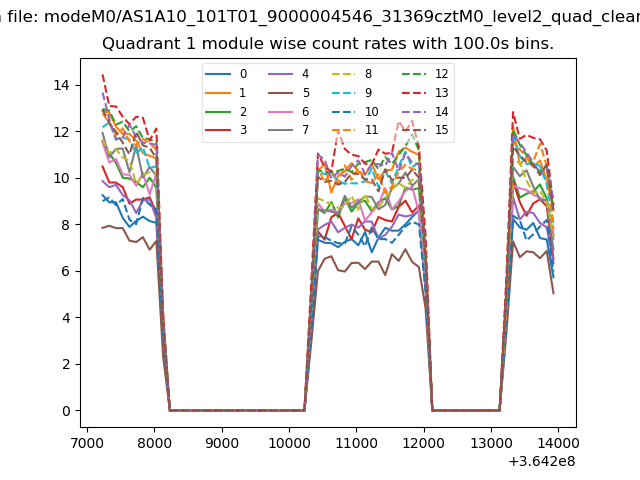
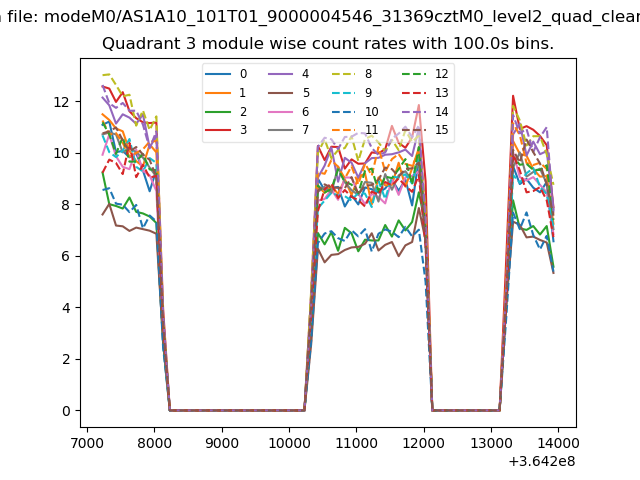
| Module-wise count rates for Quadrant A Data is divided into 100 sec bins |
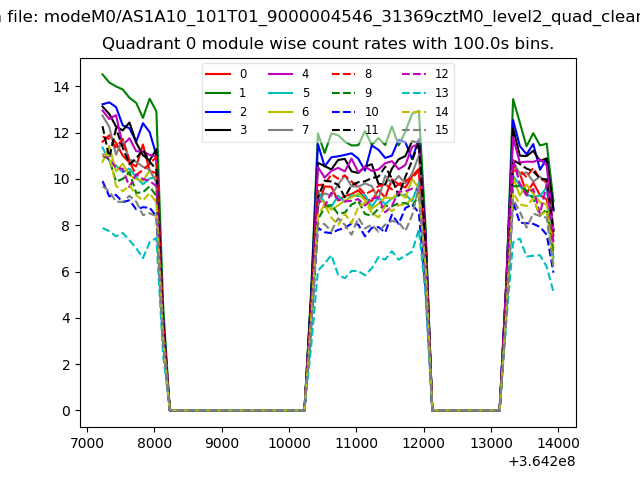 |
 |
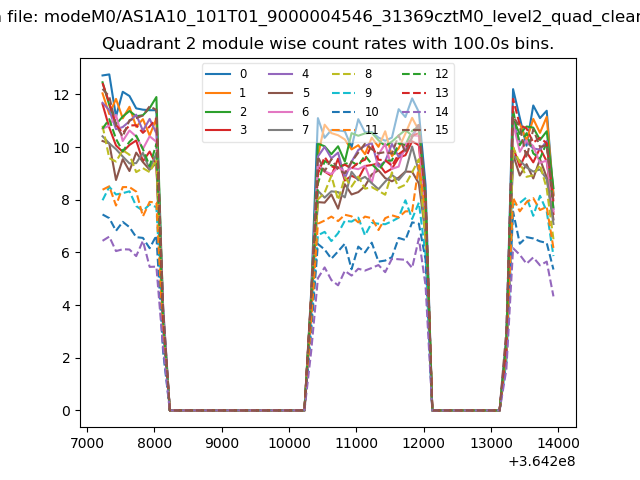
| Module-wise count rates for Quadrant B Data is divided into 100 sec bins |
 |
 |
| Module-wise count rates for Quadrant C Data is divided into 100 sec bins |
 |
 |
| Module-wise count rates for Quadrant D Data is divided into 100 sec bins |
 |
 |
| Parameter | Plot |
|---|---|
| CZT HV Monitor | 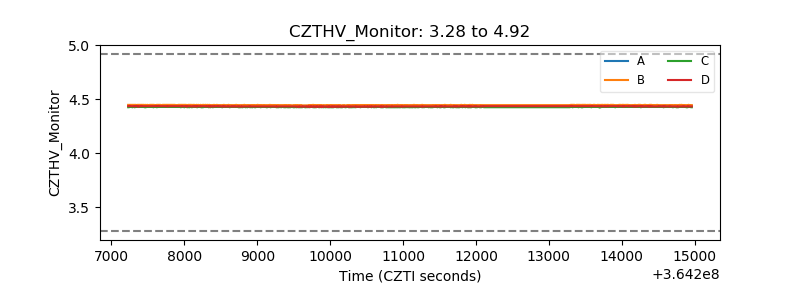 |
| D_VDD | 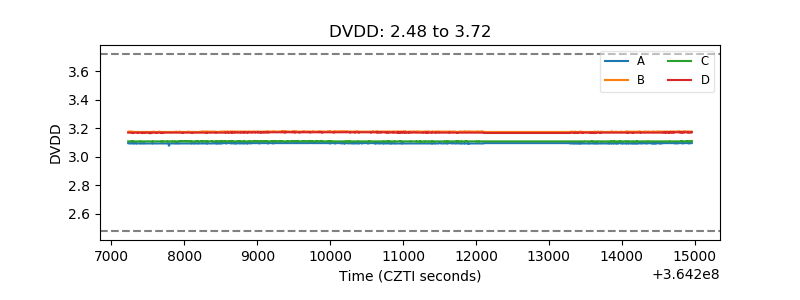 |
| Temperature 1 | 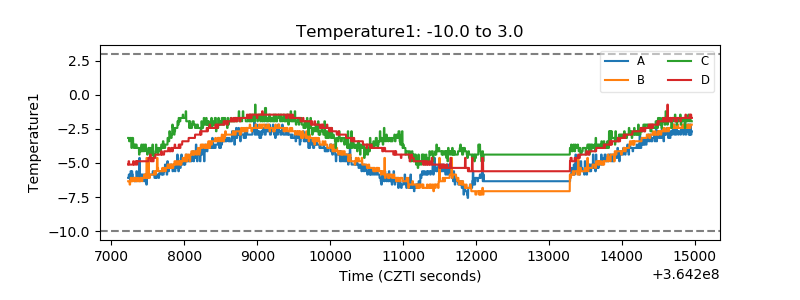 |
| Veto HV Monitor | 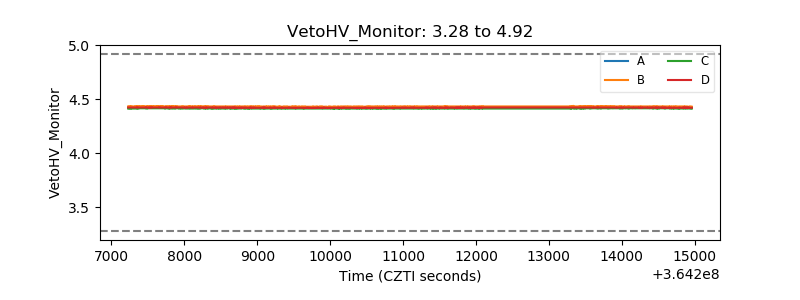 |
| Veto LLD | 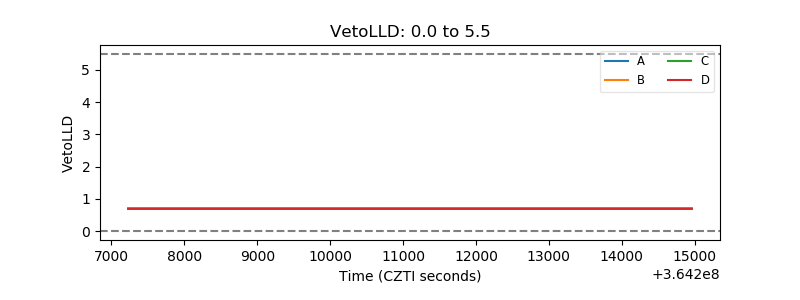 |
| Alpha Counter | 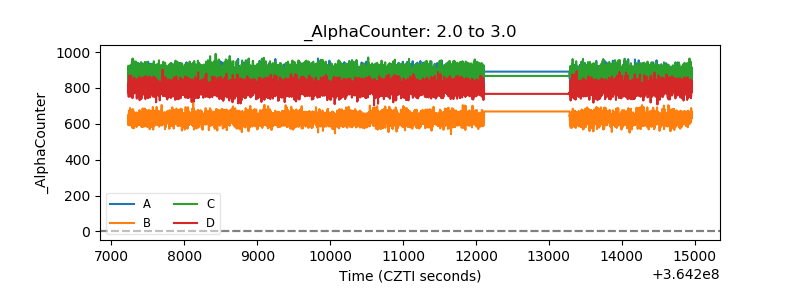 |
| _CPM_Rate |  |
| CZT Counter |  |
| +2.5 Volts monitor | 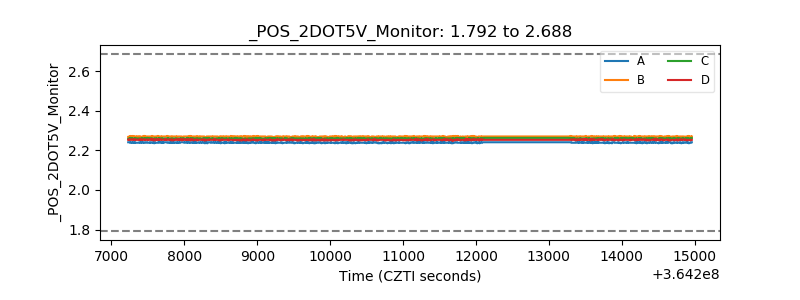 |
| +5 Volts monitor |  |
| _ROLL_ROT | 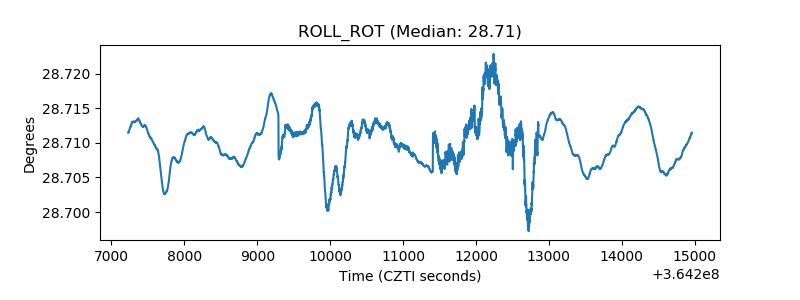 |
| _Roll_DEC | 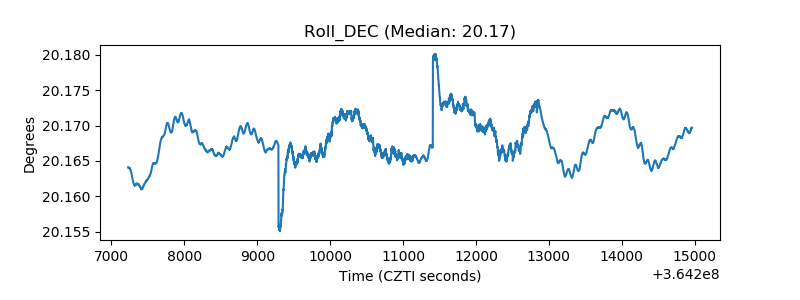 |
| _Roll_RA | 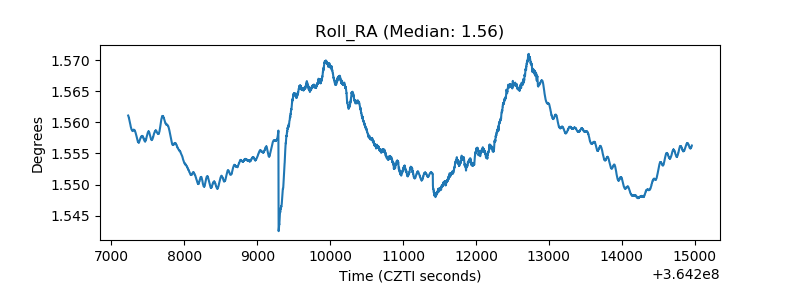 |
| Veto Counter | 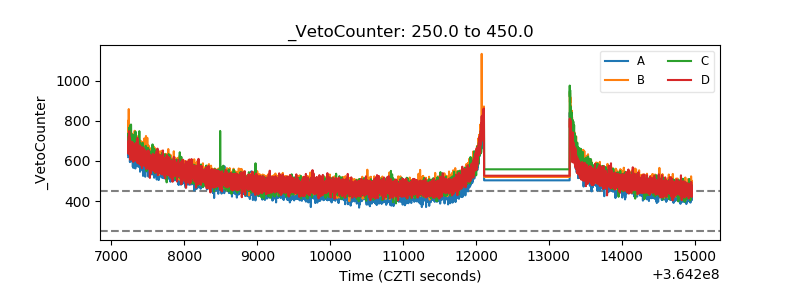 |