| Param | Original file | Final file |
|---|---|---|
| Filename | modeM0/AS1A10_101T01_9000004546_31370cztM0_level2.evt | modeM0/AS1A10_101T01_9000004546_31370cztM0_level2_quad_clean.evt |
| Size (bytes) | 581,261,760 | 80,487,360 |
| Size | 554.3 MB | 76.8 MB |
| Events in quadrant A | 3,528,691 | 502,940 |
| Events in quadrant B | 5,511,962 | 496,978 |
| Events in quadrant C | 3,886,257 | 471,131 |
| Events in quadrant D | 4,202,642 | 478,200 |
| Mode M0 | |||
|---|---|---|---|
| Quadrant | BADHDUFLAG | Total packets | Discarded packets |
| A | 0 | 14477 | 2 |
| B | 0 | 21386 | 3 |
| C | 0 | 15579 | 2 |
| D | 0 | 16821 | 2 |
| Mode SS | |||
|---|---|---|---|
| Quadrant | BADHDUFLAG | Total packets | Discarded packets |
| A | 0 | 142 | 0 |
| B | 0 | 142 | 0 |
| C | 0 | 142 | 0 |
| D | 0 | 142 | 0 |
| Mode M9 | |||
|---|---|---|---|
| Quadrant | BADHDUFLAG | Total packets | Discarded packets |
| A | 0 | 9 | 0 |
| B | 0 | 10 | 0 |
| C | 0 | 10 | 0 |
| D | 0 | 10 | 0 |
| Quadrant | Total seconds | Saturated seconds | Saturation percentage |
|---|---|---|---|
| A | 7005 | 100 | 1.427552% |
| B | 7003 | 166 | 2.370413% |
| C | 7004 | 196 | 2.798401% |
| D | 7004 | 73 | 1.042262% |
Noise dominated data is calculated using 1-second bins in cleaned event files. If a bin has >2000 counts, and if more than 50% of those come from <1% of pixels, then it is considered to be noise-dominated and hence unusable.
| Quadrant | # 1 sec bins | Bins with >0 counts | Bins with >2000 counts | High rate bins dominated by noise | Noise dominated (total time) | Noise dominated (detector-on time) | Marked lightcurve |
|---|---|---|---|---|---|---|---|
| A | 7895 | 7006 | 0 | 0 | 0.00% | 0.00% | 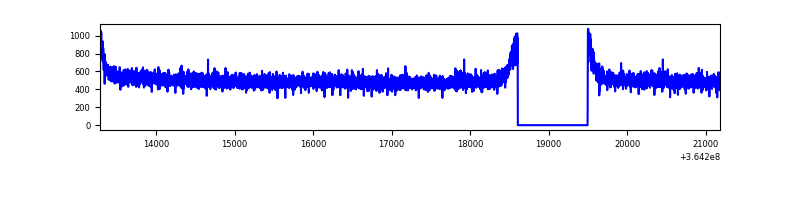 |
| B | 7894 | 7005 | 7 | 7 | 0.09% | 0.10% | 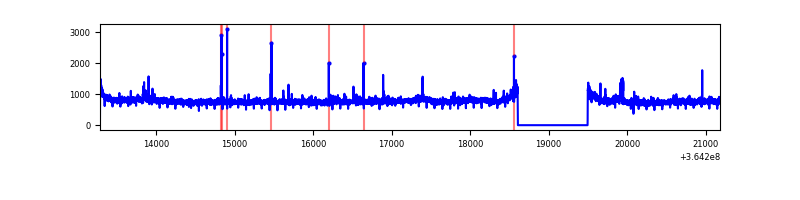 |
| C | 7894 | 7005 | 28 | 28 | 0.35% | 0.40% | 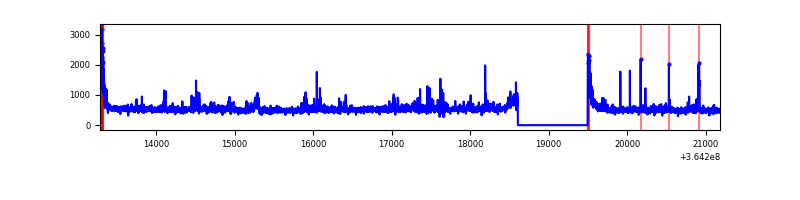 |
| D | 7894 | 7005 | 5 | 5 | 0.06% | 0.07% | 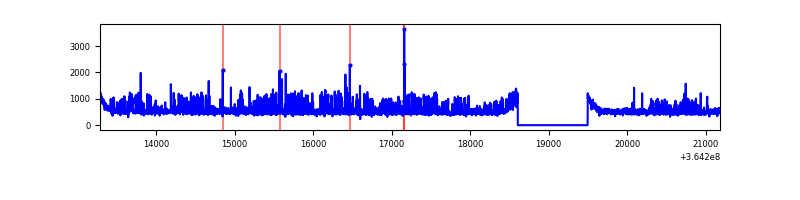 |
Top three noisy pixels from each quadrant. If the there are fewer than three noisy pixels in the level2.evt file, extra rows are filled as -1
| Pixel properties | Quadrant properties | ||||||
|---|---|---|---|---|---|---|---|
| Quadrant | DetID | PixID | Counts | Sigma | Mean | Median | Sigma |
| A | 13 | 254 | 12221 | 61.75 | 915 | 896 | 183.4 |
| A | 3 | 137 | 9202 | 45.29 | 915 | 896 | 183.4 |
| A | 0 | 226 | 7765 | 37.46 | 915 | 896 | 183.4 |
| B | 6 | 159 | 1858699 | 10823.69 | 891 | 869 | 171.6 |
| B | 0 | 190 | 65225 | 374.94 | 891 | 869 | 171.6 |
| B | 4 | 80 | 55711 | 319.51 | 891 | 869 | 171.6 |
| C | 3 | 233 | 218648 | 1100.89 | 851 | 856 | 197.8 |
| C | 0 | 10 | 172587 | 868.06 | 851 | 856 | 197.8 |
| C | 14 | 238 | 146251 | 734.94 | 851 | 856 | 197.8 |
| D | 8 | 195 | 634513 | 3049.46 | 878 | 855 | 207.8 |
| D | 10 | 203 | 145220 | 694.75 | 878 | 855 | 207.8 |
| D | 12 | 233 | 43272 | 204.13 | 878 | 855 | 207.8 |
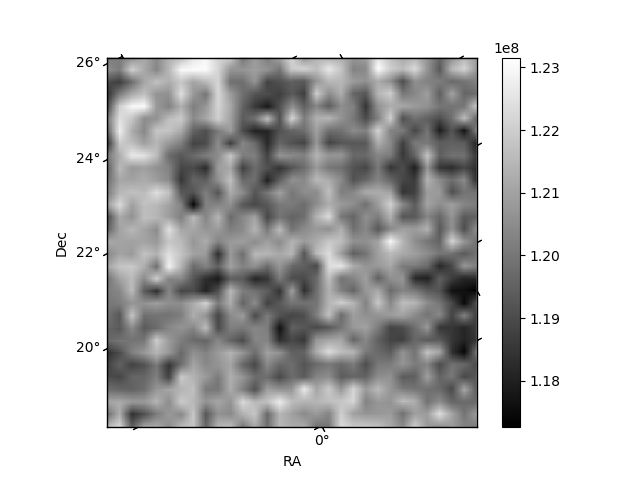
Histogram calculated using DETX and DETY for each event in the final _common_clean file
| Quadrant A | 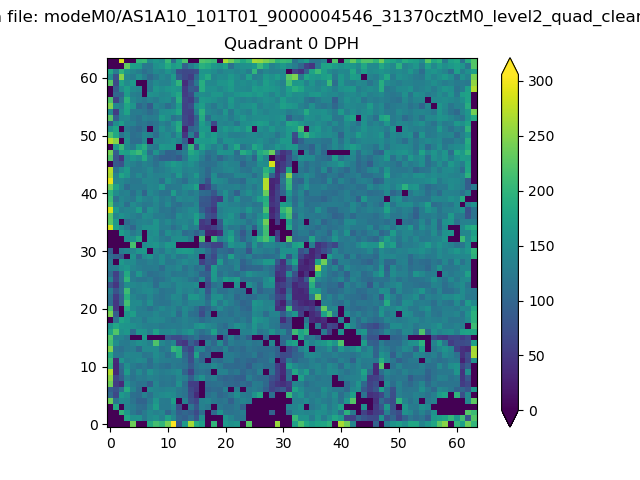 |
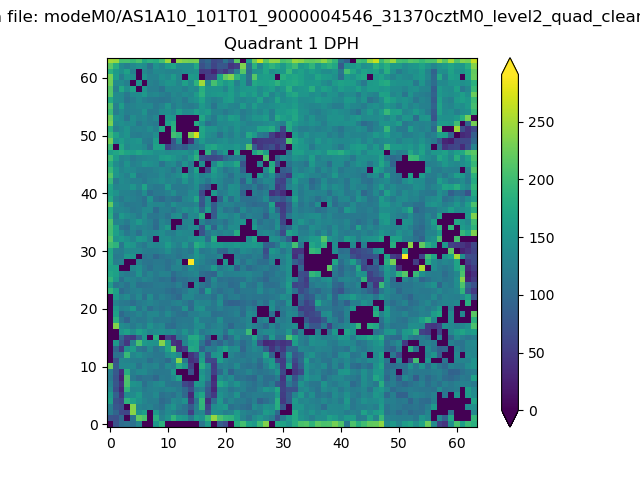 |
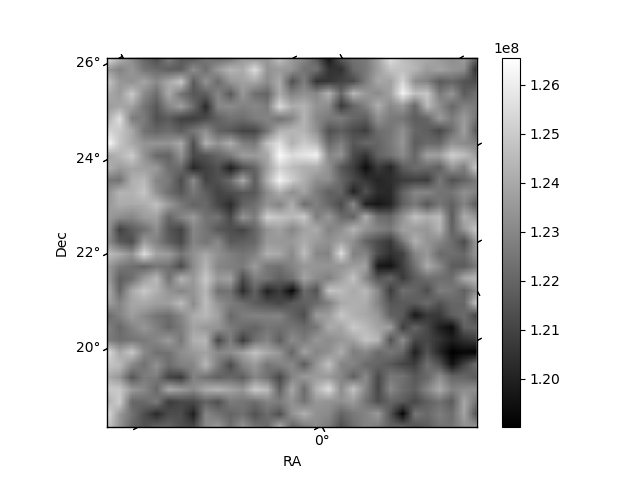
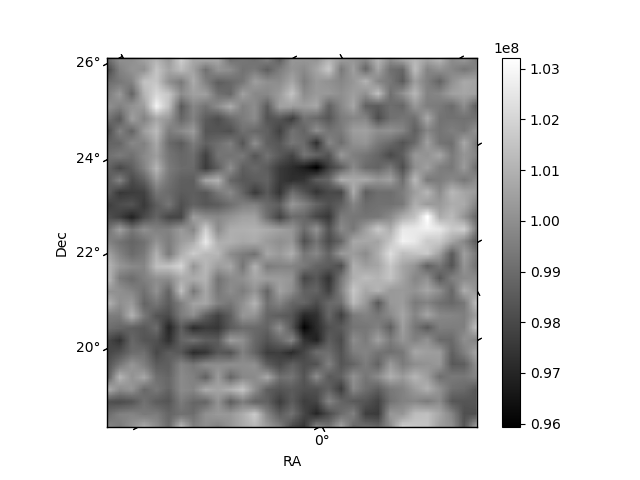
Quadrant B |
|---|---|---|---|
| Quadrant D | 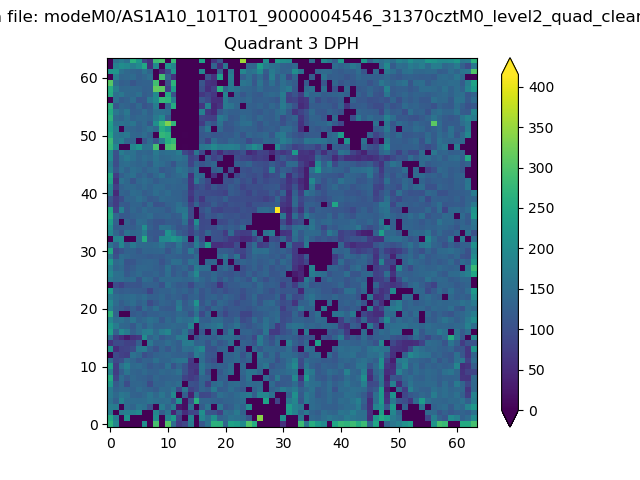 |
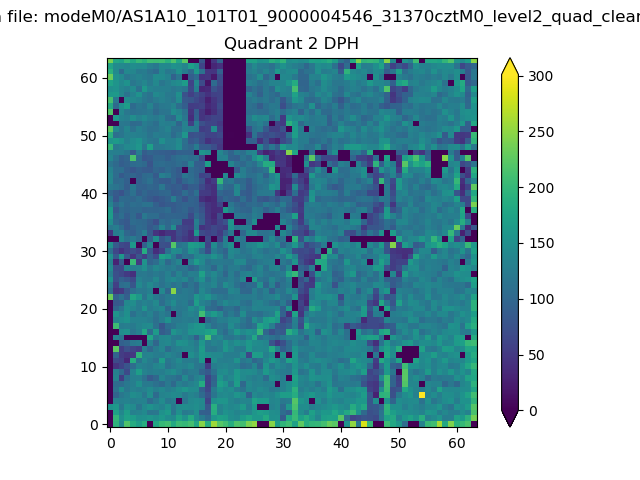 |
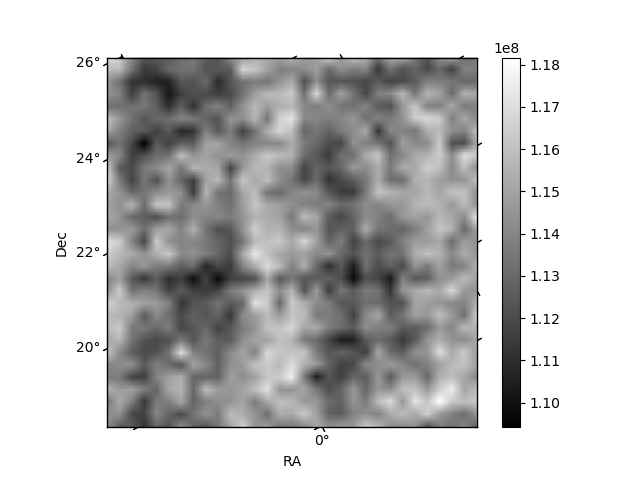
Quadrant C |
| Plot type | Count rate plots | Images |
|---|---|---|
| Comparison with Poisson distribution Blue bars denote a histogram of data divided into 1 sec bins. Red curve is a Poisson curve with rate = median count rate of data. |
 |
 |
| Quadrant-wise count rates Data is divided into 100 sec bins |
 |
|
| Module-wise count rates for Quadrant A Data is divided into 100 sec bins |
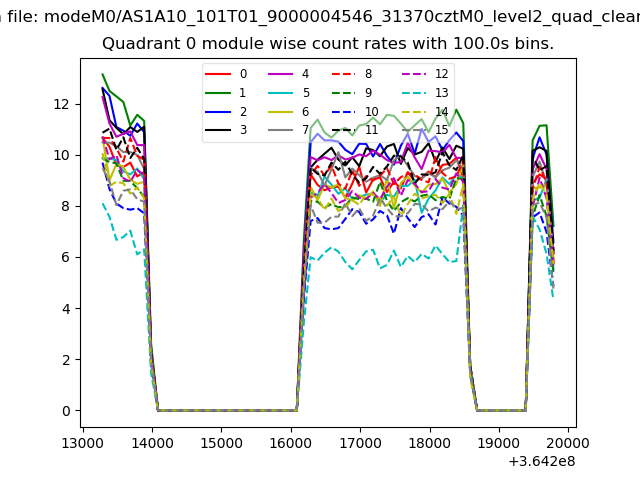 |
 |
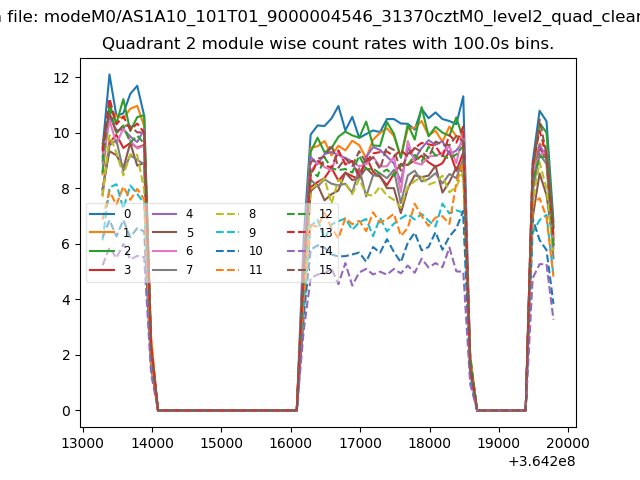
| Module-wise count rates for Quadrant B Data is divided into 100 sec bins |
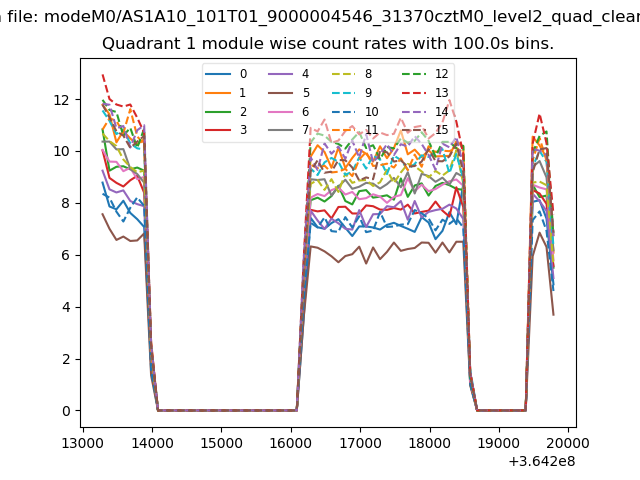 |
 |
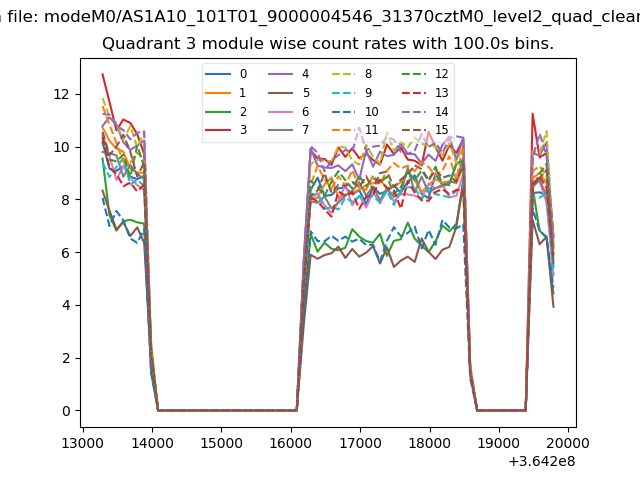
| Module-wise count rates for Quadrant C Data is divided into 100 sec bins |
 |
 |
| Module-wise count rates for Quadrant D Data is divided into 100 sec bins |
 |
 |
| Parameter | Plot |
|---|---|
| CZT HV Monitor | 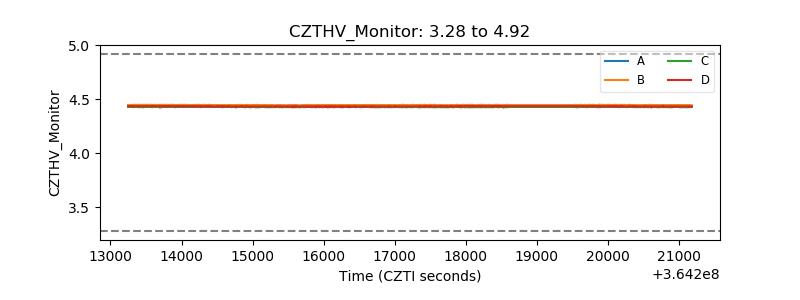 |
| D_VDD |  |
| Temperature 1 | 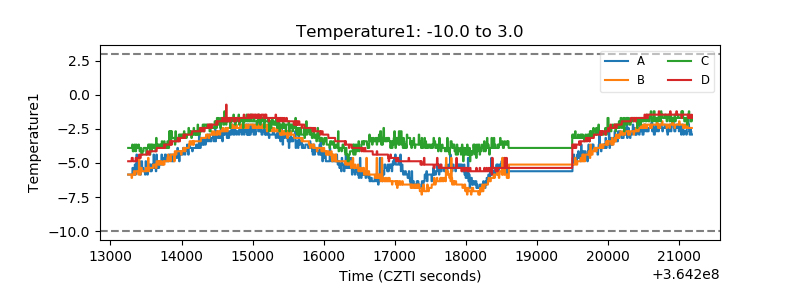 |
| Veto HV Monitor | 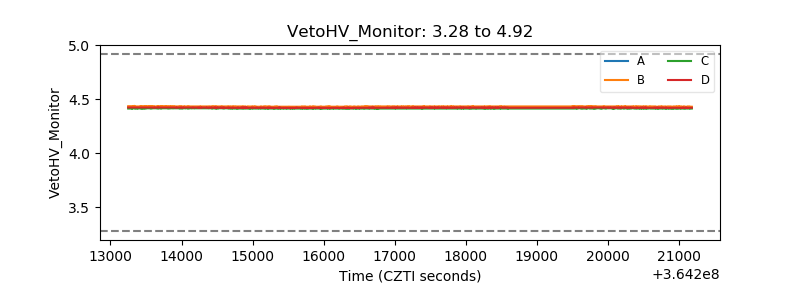 |
| Veto LLD | 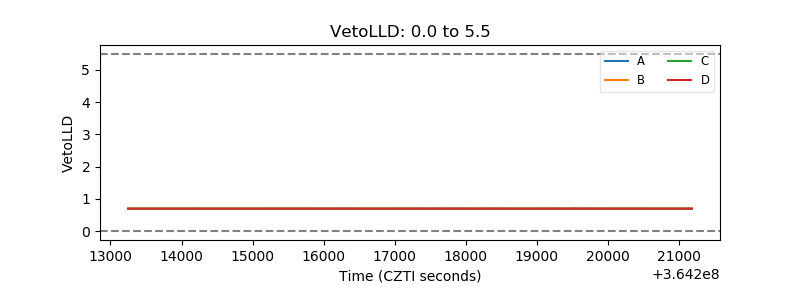 |
| Alpha Counter |  |
| _CPM_Rate |  |
| CZT Counter | 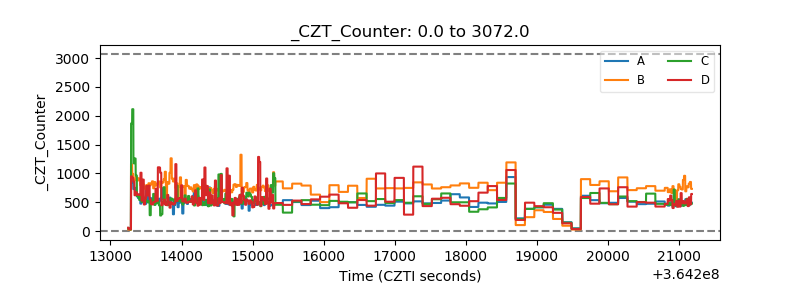 |
| +2.5 Volts monitor |  |
| +5 Volts monitor |  |
| _ROLL_ROT | 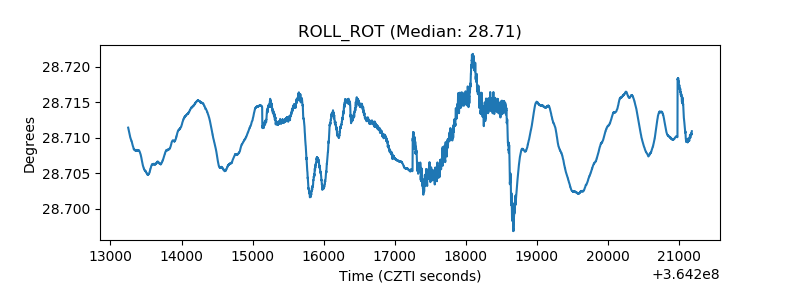 |
| _Roll_DEC | 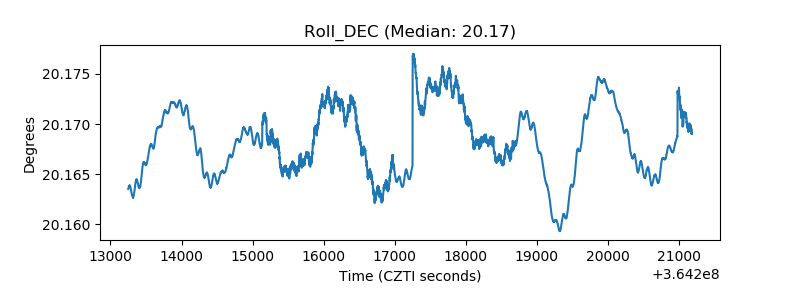 |
| _Roll_RA | 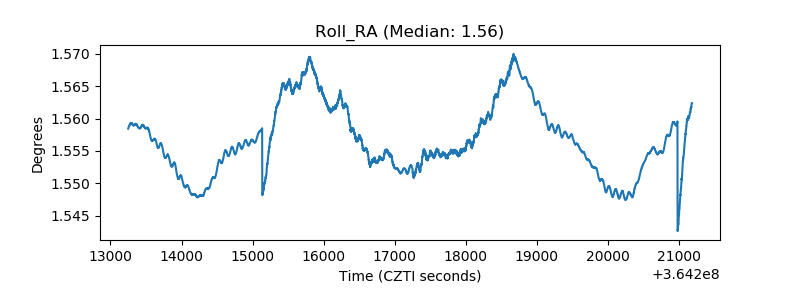 |
| Veto Counter | 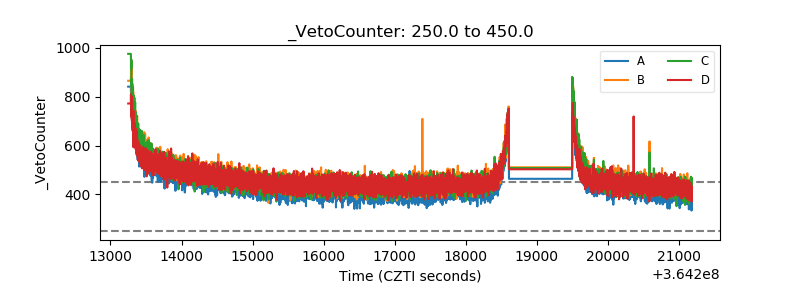 |