| Param | Original file | Final file |
|---|---|---|
| Filename | modeM0/AS1A10_101T01_9000004546_31371cztM0_level2.evt | modeM0/AS1A10_101T01_9000004546_31371cztM0_level2_quad_clean.evt |
| Size (bytes) | 227,116,800 | 23,889,600 |
| Size | 216.6 MB | 22.8 MB |
| Events in quadrant A | 1,400,903 | 132,092 |
| Events in quadrant B | 2,215,529 | 130,621 |
| Events in quadrant C | 1,460,394 | 123,794 |
| Events in quadrant D | 1,596,758 | 123,392 |
| Mode M0 | |||
|---|---|---|---|
| Quadrant | BADHDUFLAG | Total packets | Discarded packets |
| A | 0 | 5978 | 0 |
| B | 0 | 8944 | 0 |
| C | 0 | 6146 | 0 |
| D | 0 | 6549 | 0 |
| Mode SS | |||
|---|---|---|---|
| Quadrant | BADHDUFLAG | Total packets | Discarded packets |
| A | 0 | 60 | 0 |
| B | 0 | 60 | 0 |
| C | 0 | 60 | 0 |
| D | 0 | 60 | 0 |
| Quadrant | Total seconds | Saturated seconds | Saturation percentage |
|---|---|---|---|
| A | 2983 | 1 | 0.033523% |
| B | 2983 | 8 | 0.268186% |
| C | 2984 | 19 | 0.636729% |
| D | 2984 | 4 | 0.134048% |
Noise dominated data is calculated using 1-second bins in cleaned event files. If a bin has >2000 counts, and if more than 50% of those come from <1% of pixels, then it is considered to be noise-dominated and hence unusable.
| Quadrant | # 1 sec bins | Bins with >0 counts | Bins with >2000 counts | High rate bins dominated by noise | Noise dominated (total time) | Noise dominated (detector-on time) | Marked lightcurve |
|---|---|---|---|---|---|---|---|
| A | 2983 | 2983 | 0 | 0 | 0.00% | 0.00% | 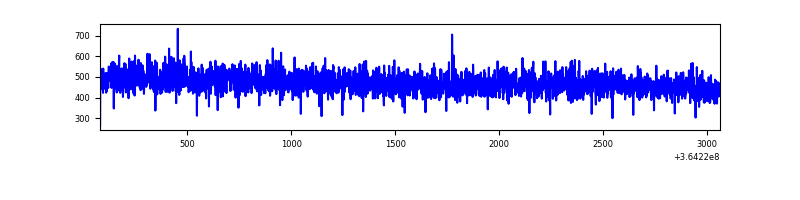 |
| B | 2983 | 2983 | 0 | 0 | 0.00% | 0.00% | 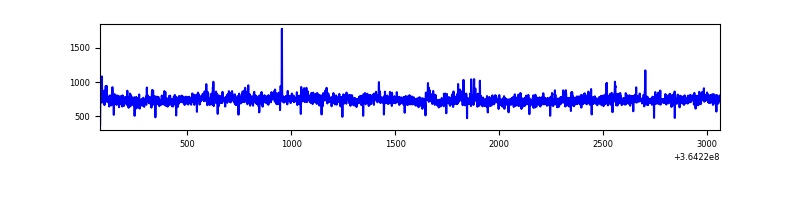 |
| C | 2984 | 2984 | 3 | 3 | 0.10% | 0.10% |  |
| D | 2984 | 2984 | 2 | 2 | 0.07% | 0.07% | 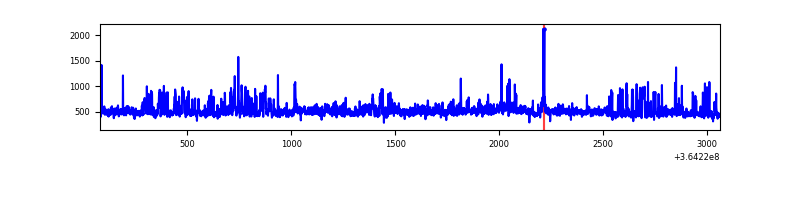 |
Top three noisy pixels from each quadrant. If the there are fewer than three noisy pixels in the level2.evt file, extra rows are filled as -1
| Pixel properties | Quadrant properties | ||||||
|---|---|---|---|---|---|---|---|
| Quadrant | DetID | PixID | Counts | Sigma | Mean | Median | Sigma |
| A | 13 | 254 | 5648 | 72.02 | 362 | 355 | 73.5 |
| A | 3 | 137 | 3602 | 44.18 | 362 | 355 | 73.5 |
| A | 0 | 226 | 3016 | 36.21 | 362 | 355 | 73.5 |
| B | 6 | 159 | 778978 | 11160.5 | 354 | 345 | 69.8 |
| B | 4 | 80 | 23104 | 326.22 | 354 | 345 | 69.8 |
| B | 0 | 190 | 8537 | 117.42 | 354 | 345 | 69.8 |
| C | 14 | 238 | 60348 | 736.29 | 341 | 342 | 81.5 |
| C | 3 | 233 | 49429 | 602.31 | 341 | 342 | 81.5 |
| C | 14 | 254 | 8106 | 95.27 | 341 | 342 | 81.5 |
| D | 8 | 195 | 175868 | 2054.03 | 350 | 341 | 85.5 |
| D | 2 | 250 | 48664 | 565.48 | 350 | 341 | 85.5 |
| D | 10 | 203 | 33664 | 389.95 | 350 | 341 | 85.5 |
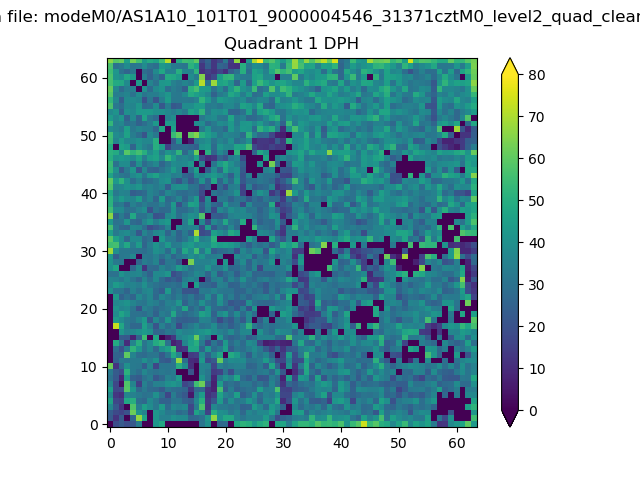
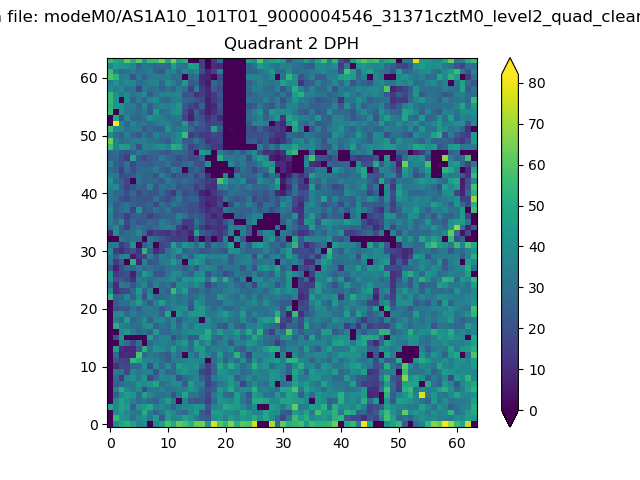
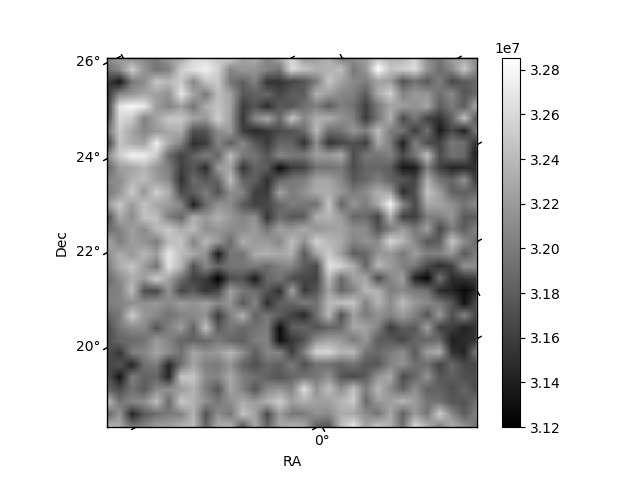
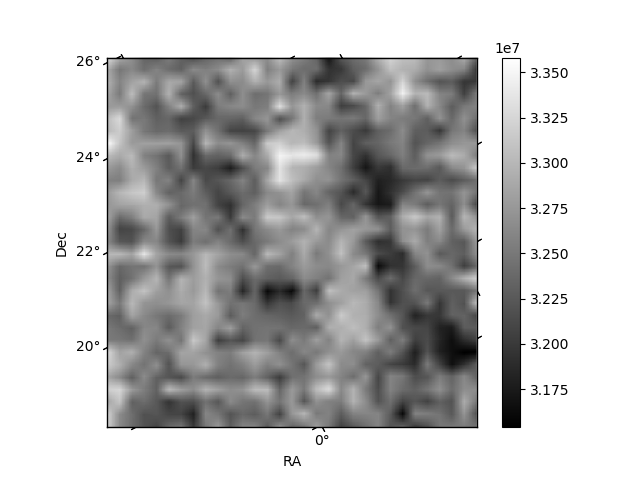
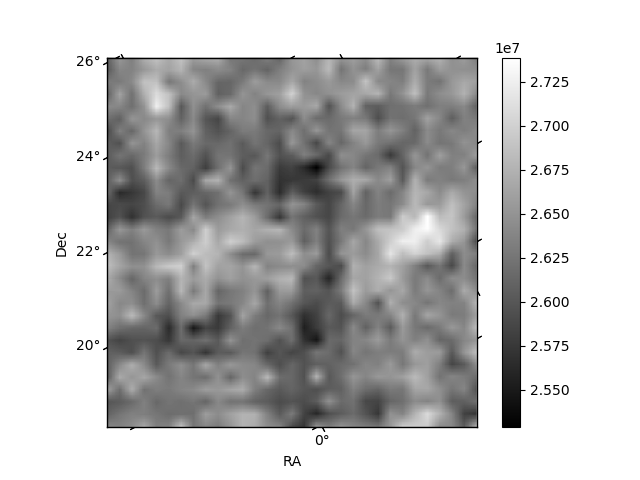
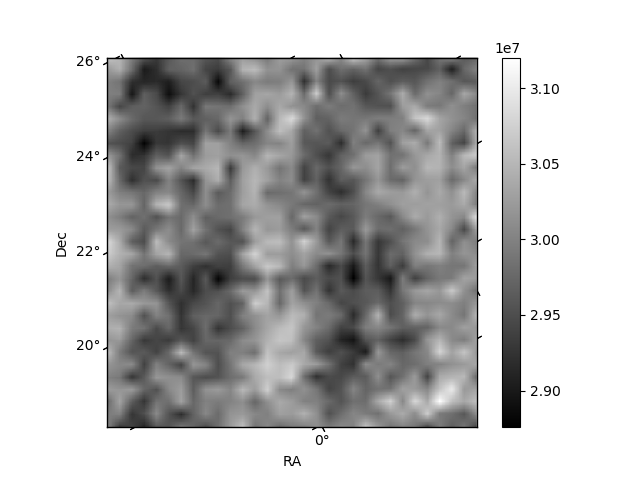
Histogram calculated using DETX and DETY for each event in the final _common_clean file
| Quadrant A | 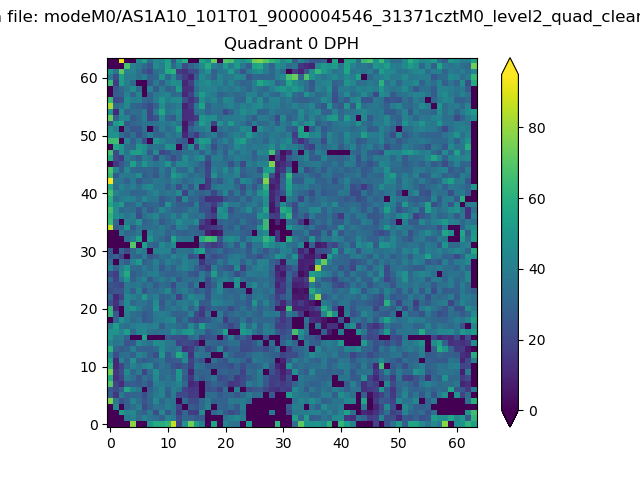 |
 |
Quadrant B |
|---|---|---|---|
| Quadrant D | 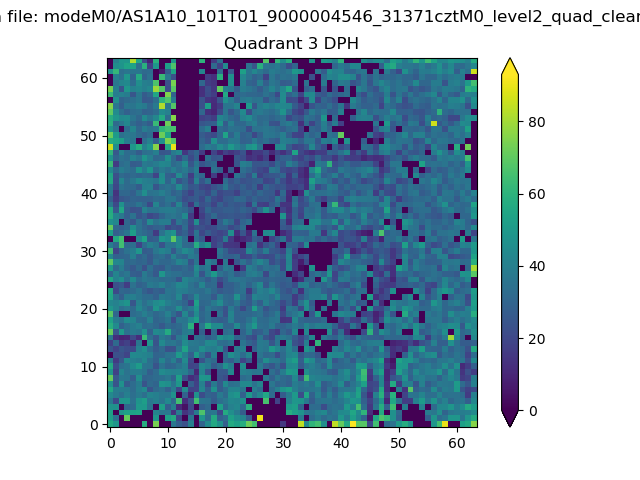 |
 |
Quadrant C |
| Plot type | Count rate plots | Images |
|---|---|---|
| Comparison with Poisson distribution Blue bars denote a histogram of data divided into 1 sec bins. Red curve is a Poisson curve with rate = median count rate of data. |
 |
 |
| Quadrant-wise count rates Data is divided into 100 sec bins |
 |
|
| Module-wise count rates for Quadrant A Data is divided into 100 sec bins |
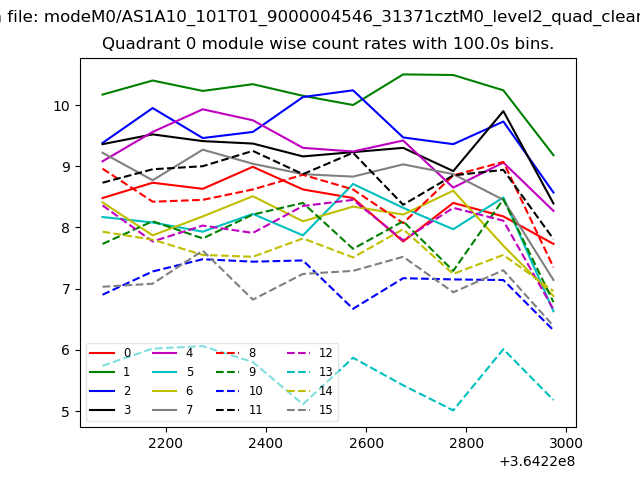 |
 |
| Module-wise count rates for Quadrant B Data is divided into 100 sec bins |
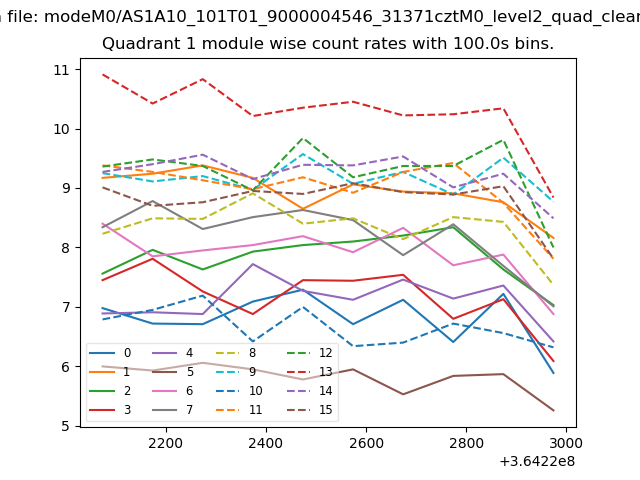 |
 |
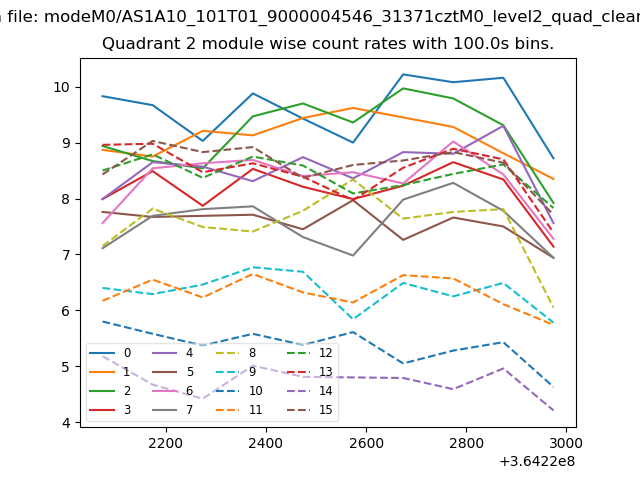
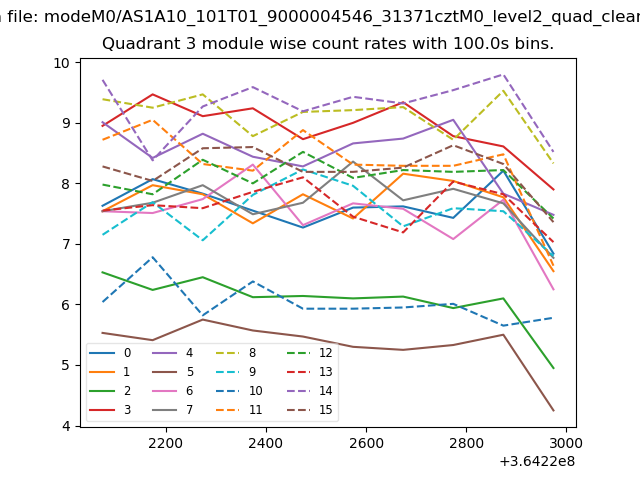
| Module-wise count rates for Quadrant C Data is divided into 100 sec bins |
 |
 |
| Module-wise count rates for Quadrant D Data is divided into 100 sec bins |
 |
 |
| Parameter | Plot |
|---|---|
| CZT HV Monitor | 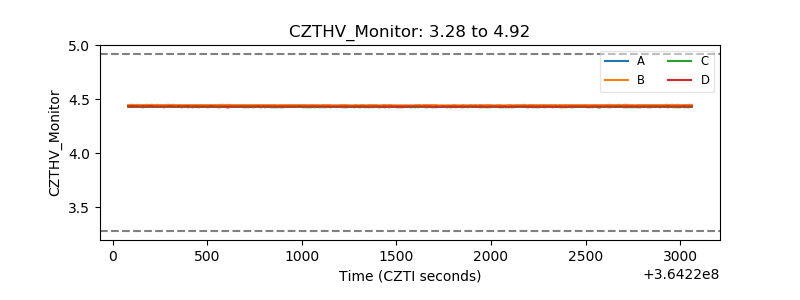 |
| D_VDD |  |
| Temperature 1 | 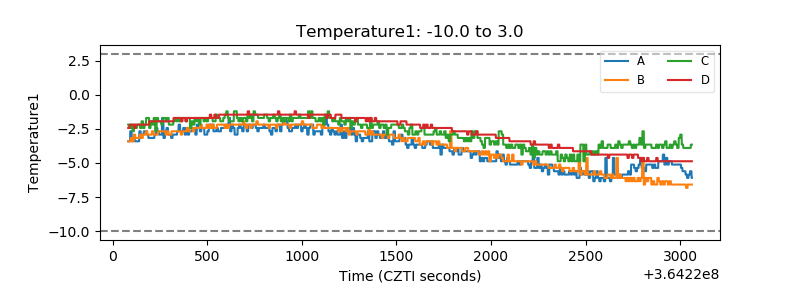 |
| Veto HV Monitor | 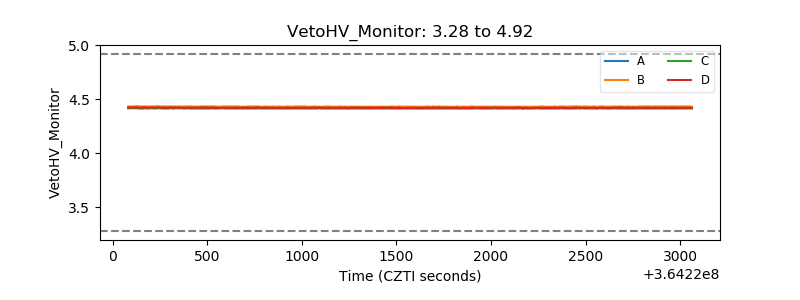 |
| Veto LLD | 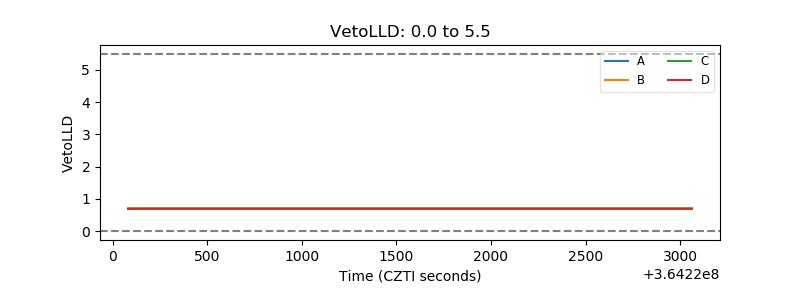 |
| Alpha Counter |  |
| _CPM_Rate | 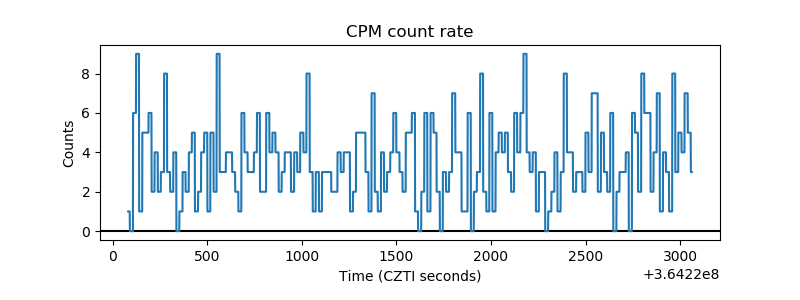 |
| CZT Counter | 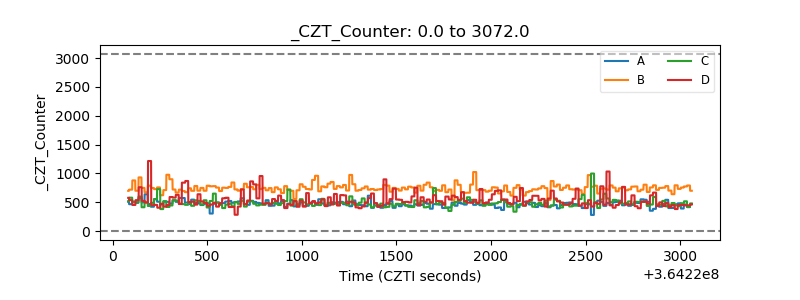 |
| +2.5 Volts monitor |  |
| +5 Volts monitor |  |
| _ROLL_ROT | 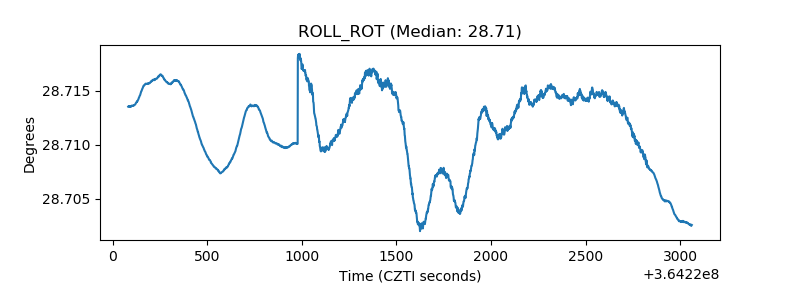 |
| _Roll_DEC | 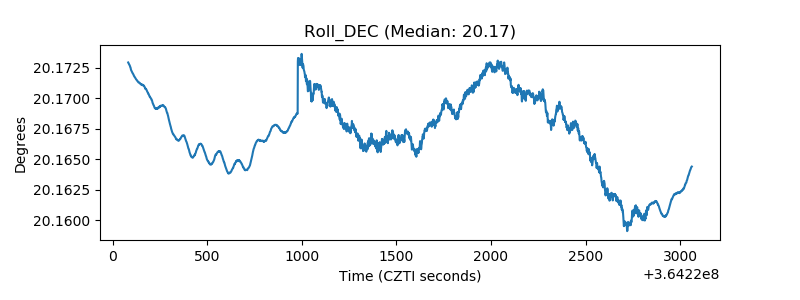 |
| _Roll_RA | 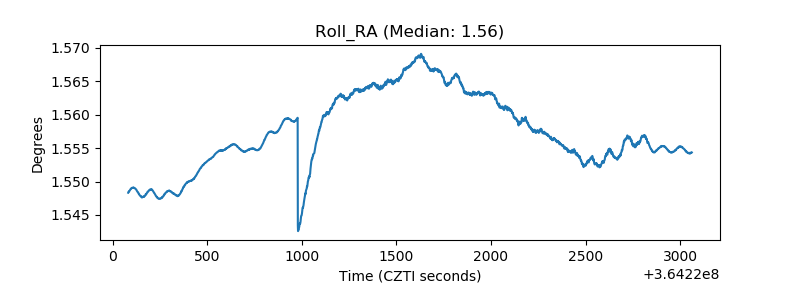 |
| Veto Counter | 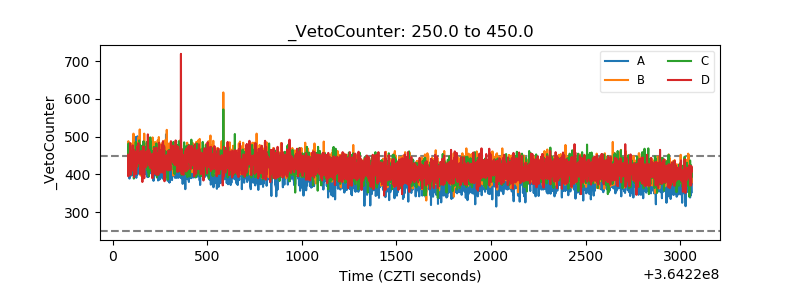 |