| Param | Original file | Final file |
|---|---|---|
| Filename | modeM0/AS1A10_101T01_9000004546_31530cztM0_level2.evt | modeM0/AS1A10_101T01_9000004546_31530cztM0_level2_quad_clean.evt |
| Size (bytes) | 78,485,760 | 18,898,560 |
| Size | 74.8 MB | 18.0 MB |
| Events in quadrant A | 640,630 | 119,295 |
| Events in quadrant B | 753,972 | 126,981 |
| Events in quadrant C | 468,486 | 123,897 |
| Events in quadrant D | 440,968 | 122,927 |
| Mode M0 | |||
|---|---|---|---|
| Quadrant | BADHDUFLAG | Total packets | Discarded packets |
| A | 0 | 2636 | 28 |
| B | 0 | 3106 | 54 |
| C | 0 | 2095 | 43 |
| D | 0 | 2074 | 27 |
| Mode SS | |||
|---|---|---|---|
| Quadrant | BADHDUFLAG | Total packets | Discarded packets |
| A | 0 | 22 | 0 |
| B | 0 | 22 | 0 |
| C | 0 | 22 | 0 |
| D | 0 | 22 | 0 |
| Mode M9 | |||
|---|---|---|---|
| Quadrant | BADHDUFLAG | Total packets | Discarded packets |
| A | 1 | 139931184962344 | 46 |
| B | 1 | -1 | -1 |
| C | 1 | -1 | -1 |
| D | 1 | -1 | -1 |
| Quadrant | Total seconds | Saturated seconds | Saturation percentage |
|---|---|---|---|
| A | 1021 | 76 | 7.443683% |
| B | 1020 | 4 | 0.392157% |
| C | 1015 | 2 | 0.197044% |
| D | 1023 | 0 | 0.000000% |
Noise dominated data is calculated using 1-second bins in cleaned event files. If a bin has >2000 counts, and if more than 50% of those come from <1% of pixels, then it is considered to be noise-dominated and hence unusable.
| Quadrant | # 1 sec bins | Bins with >0 counts | Bins with >2000 counts | High rate bins dominated by noise | Noise dominated (total time) | Noise dominated (detector-on time) | Marked lightcurve |
|---|---|---|---|---|---|---|---|
| A | 1031 | 1029 | 52 | 52 | 5.04% | 5.05% |  |
| B | 1025 | 1024 | 0 | 0 | 0.00% | 0.00% | 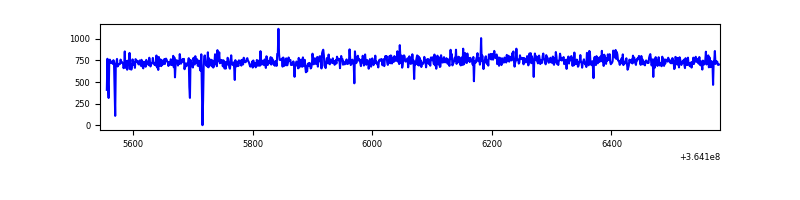 |
| C | 1030 | 1024 | 0 | 0 | 0.00% | 0.00% | 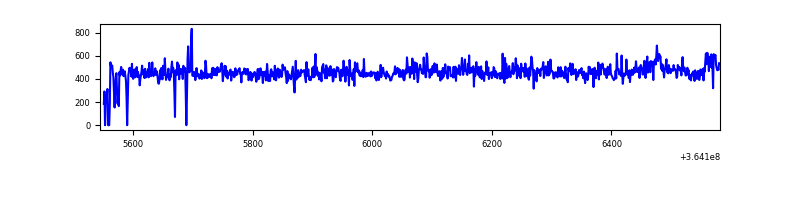 |
| D | 1037 | 1033 | 0 | 0 | 0.00% | 0.00% | 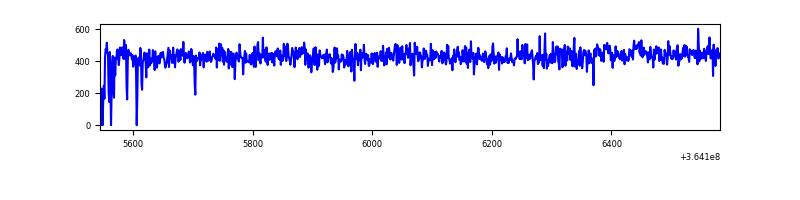 |
Top three noisy pixels from each quadrant. If the there are fewer than three noisy pixels in the level2.evt file, extra rows are filled as -1
| Pixel properties | Quadrant properties | ||||||
|---|---|---|---|---|---|---|---|
| Quadrant | DetID | PixID | Counts | Sigma | Mean | Median | Sigma |
| A | 0 | 13 | 213932 | 8726.53 | 110 | 108 | 24.5 |
| A | 13 | 254 | 1951 | 75.22 | 110 | 108 | 24.5 |
| A | 3 | 137 | 1128 | 41.63 | 110 | 108 | 24.5 |
| B | 6 | 159 | 300274 | 12513.62 | 113 | 110 | 24.0 |
| B | 4 | 80 | 5370 | 219.29 | 113 | 110 | 24.0 |
| B | 12 | 111 | 2835 | 113.6 | 113 | 110 | 24.0 |
| C | 3 | 233 | 19522 | 723.52 | 107 | 107 | 26.8 |
| C | 14 | 238 | 17982 | 666.13 | 107 | 107 | 26.8 |
| C | 10 | 22 | 5269 | 192.37 | 107 | 107 | 26.8 |
| D | 8 | 195 | 30857 | 1104.67 | 109 | 105 | 27.8 |
| D | 2 | 234 | 3442 | 119.87 | 109 | 105 | 27.8 |
| D | 14 | 226 | 987 | 31.68 | 109 | 105 | 27.8 |
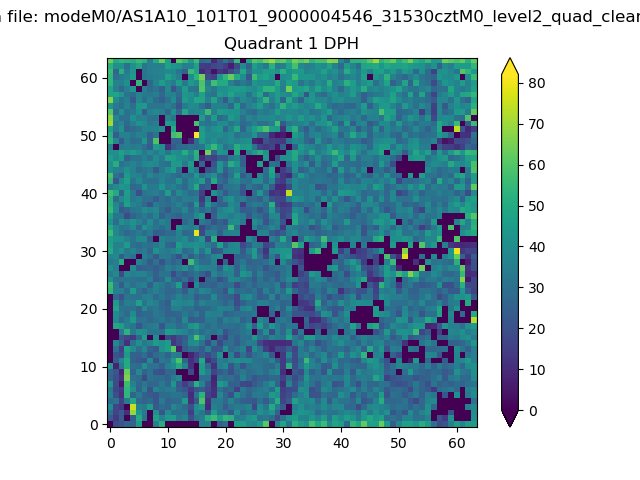
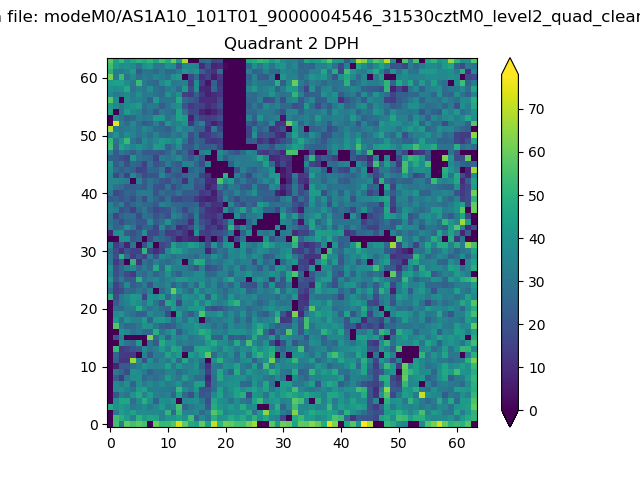
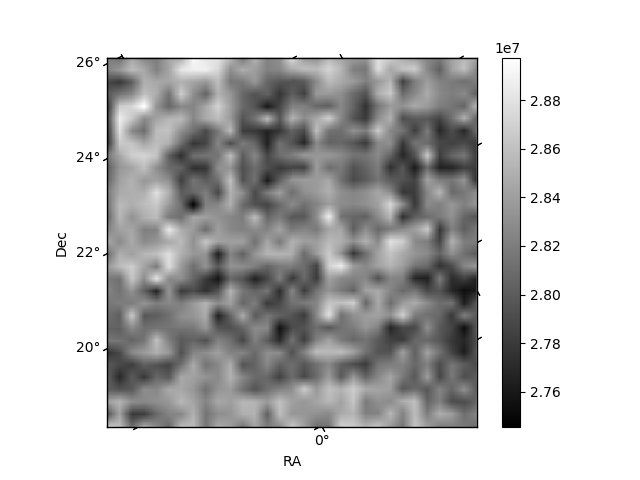
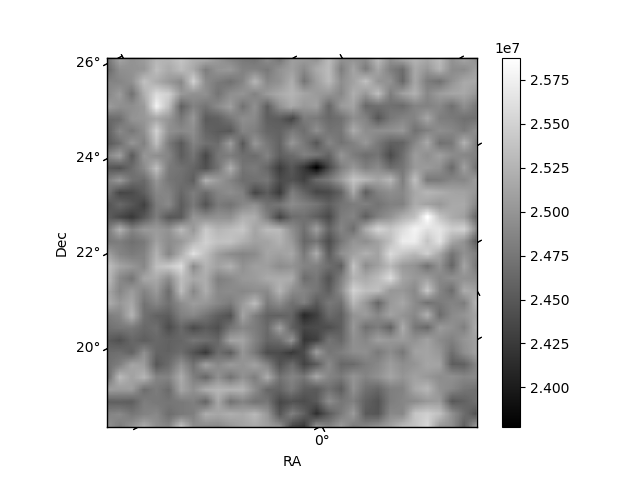
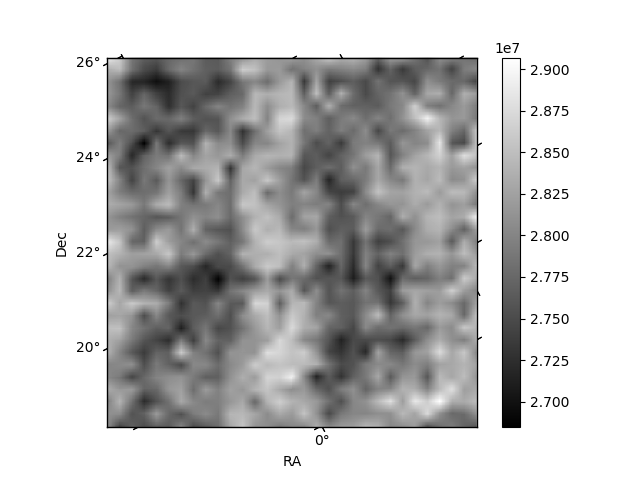
Histogram calculated using DETX and DETY for each event in the final _common_clean file
| Quadrant A | 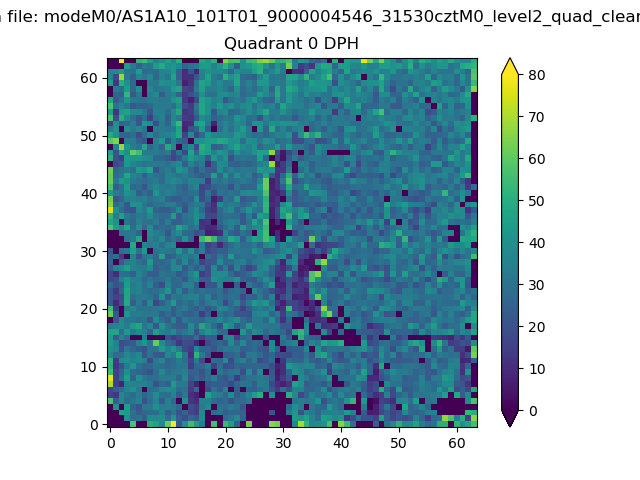 |
 |
Quadrant B |
|---|---|---|---|
| Quadrant D | 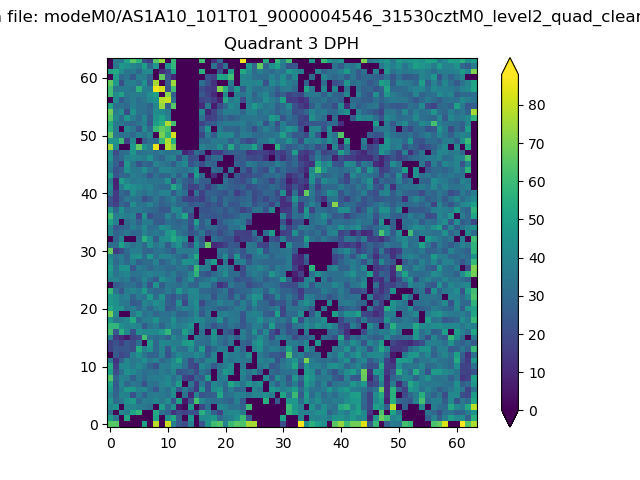 |
 |
Quadrant C |
| Plot type | Count rate plots | Images |
|---|---|---|
| Comparison with Poisson distribution Blue bars denote a histogram of data divided into 1 sec bins. Red curve is a Poisson curve with rate = median count rate of data. |
 |
 |
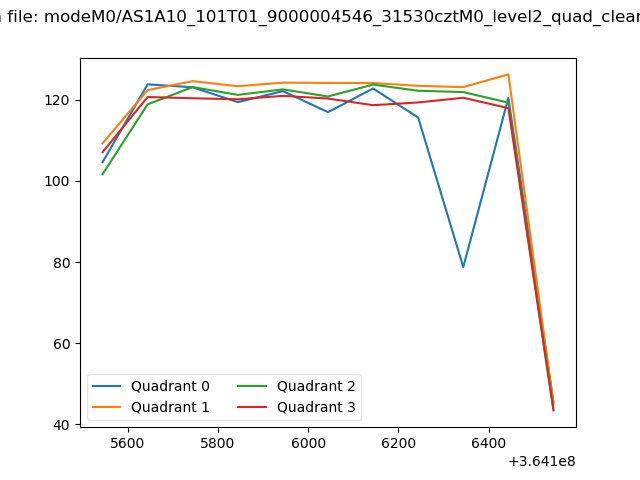
| Quadrant-wise count rates Data is divided into 100 sec bins |
 |
|
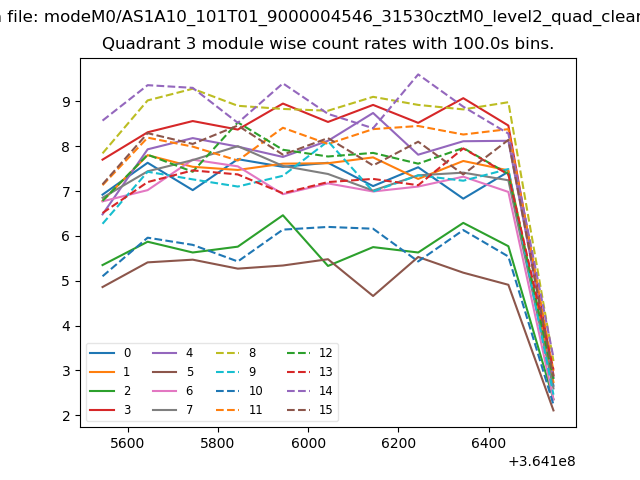
| Module-wise count rates for Quadrant A Data is divided into 100 sec bins |
 |
 |
| Module-wise count rates for Quadrant B Data is divided into 100 sec bins |
 |
 |
| Module-wise count rates for Quadrant C Data is divided into 100 sec bins |
 |
 |
| Module-wise count rates for Quadrant D Data is divided into 100 sec bins |
 |
 |
| Parameter | Plot |
|---|---|
| CZT HV Monitor |  |
| D_VDD | 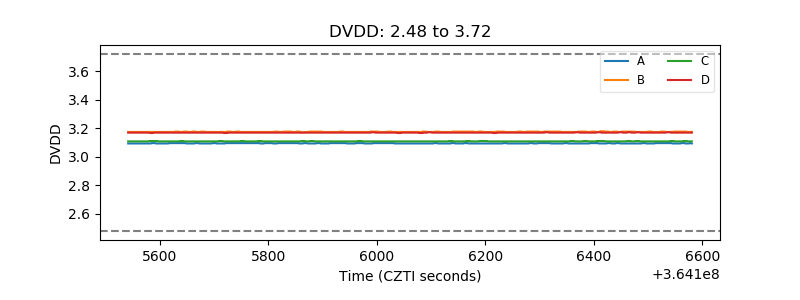 |
| Temperature 1 | 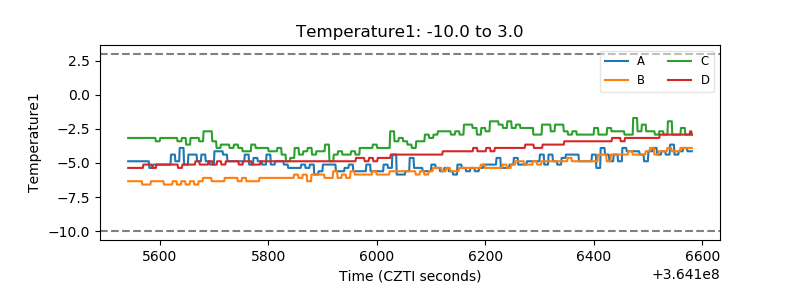 |
| Veto HV Monitor | 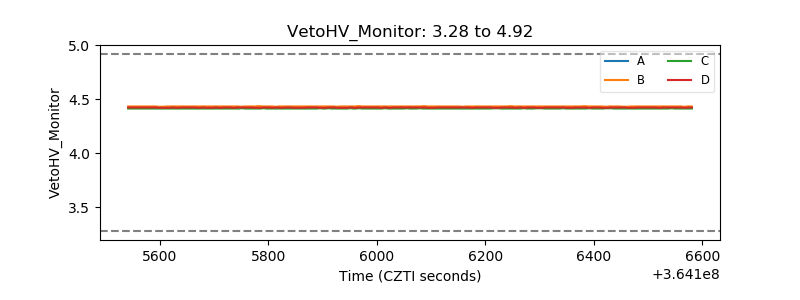 |
| Veto LLD | 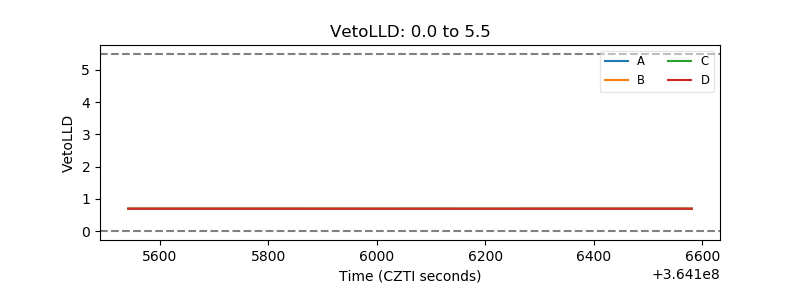 |
| Alpha Counter |  |
| _CPM_Rate | 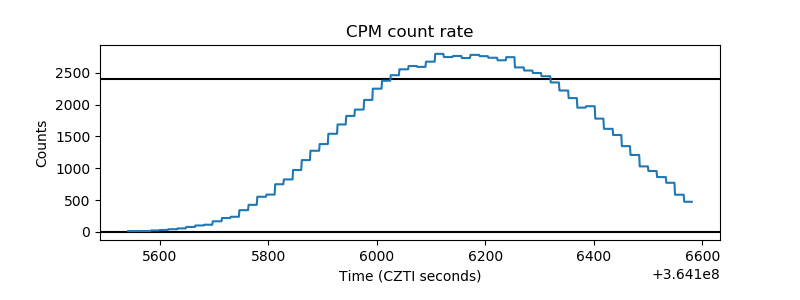 |
| CZT Counter | 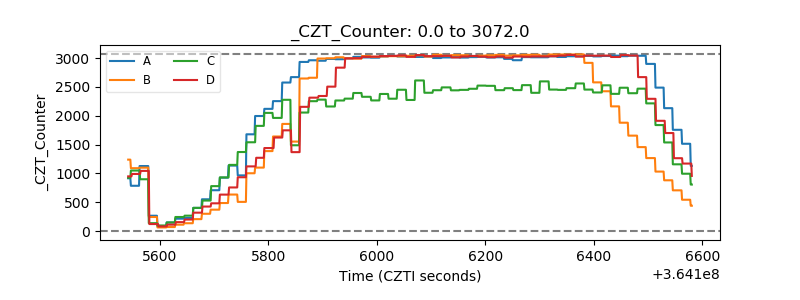 |
| +2.5 Volts monitor |  |
| +5 Volts monitor |  |
| _ROLL_ROT | 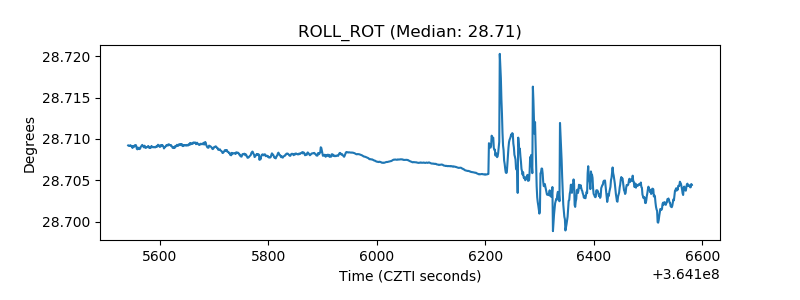 |
| _Roll_DEC | 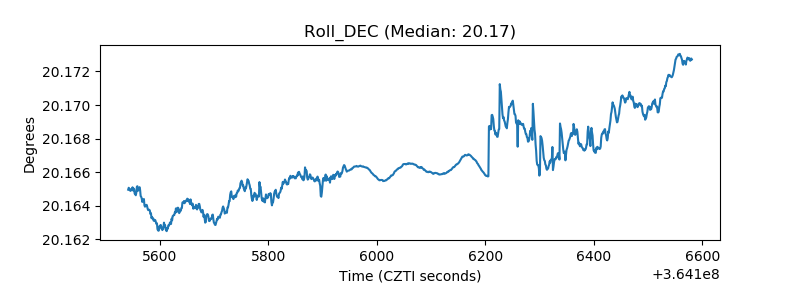 |
| _Roll_RA | 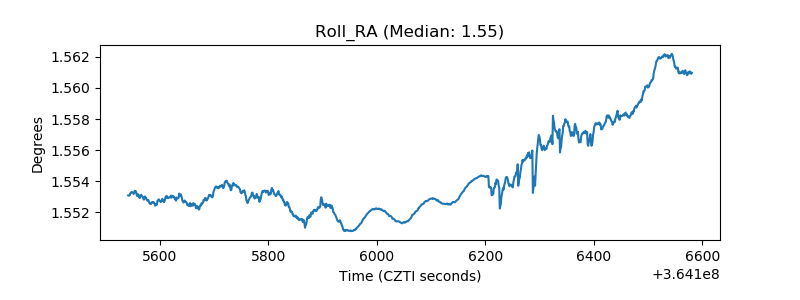 |
| Veto Counter | 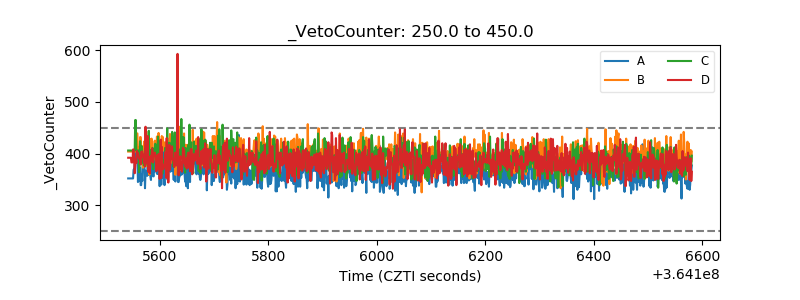 |