| Param | Original file | Final file |
|---|---|---|
| Filename | modeM0/AS1A10_064T05_9000004548_31373cztM0_level2.evt | modeM0/AS1A10_064T05_9000004548_31373cztM0_level2_quad_clean.evt |
| Size (bytes) | 673,004,160 | 81,783,360 |
| Size | 641.8 MB | 78.0 MB |
| Events in quadrant A | 3,621,405 | 507,223 |
| Events in quadrant B | 5,932,182 | 499,998 |
| Events in quadrant C | 5,324,263 | 464,127 |
| Events in quadrant D | 4,993,182 | 479,088 |
| Mode M9 | |||
|---|---|---|---|
| Quadrant | BADHDUFLAG | Total packets | Discarded packets |
| A | 0 | 3 | 0 |
| B | 0 | 3 | 0 |
| C | 0 | 3 | 0 |
| D | 0 | 3 | 0 |
| Mode M0 | |||
|---|---|---|---|
| Quadrant | BADHDUFLAG | Total packets | Discarded packets |
| A | 0 | 15521 | 1 |
| B | 0 | 22982 | 1 |
| C | 0 | 20667 | 1 |
| D | 0 | 19678 | 1 |
| Mode SS | |||
|---|---|---|---|
| Quadrant | BADHDUFLAG | Total packets | Discarded packets |
| A | 0 | 154 | 0 |
| B | 0 | 154 | 0 |
| C | 0 | 154 | 0 |
| D | 0 | 154 | 0 |
| Quadrant | Total seconds | Saturated seconds | Saturation percentage |
|---|---|---|---|
| A | 7556 | 59 | 0.780836% |
| B | 7556 | 151 | 1.998412% |
| C | 7556 | 465 | 6.154050% |
| D | 7557 | 239 | 3.162631% |
Noise dominated data is calculated using 1-second bins in cleaned event files. If a bin has >2000 counts, and if more than 50% of those come from <1% of pixels, then it is considered to be noise-dominated and hence unusable.
| Quadrant | # 1 sec bins | Bins with >0 counts | Bins with >2000 counts | High rate bins dominated by noise | Noise dominated (total time) | Noise dominated (detector-on time) | Marked lightcurve |
|---|---|---|---|---|---|---|---|
| A | 7866 | 7557 | 0 | 0 | 0.00% | 0.00% | 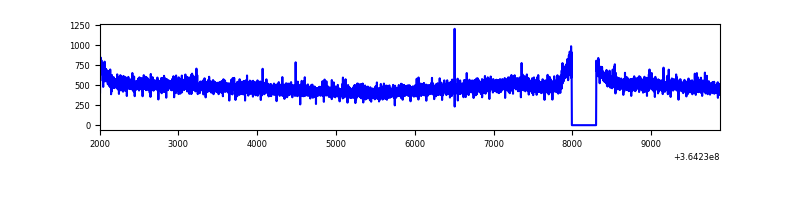 |
| B | 7866 | 7557 | 5 | 5 | 0.06% | 0.07% | 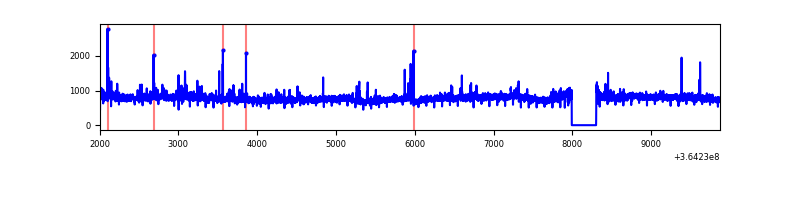 |
| C | 7866 | 7557 | 219 | 219 | 2.78% | 2.90% |  |
| D | 7867 | 7558 | 157 | 157 | 2.00% | 2.08% | 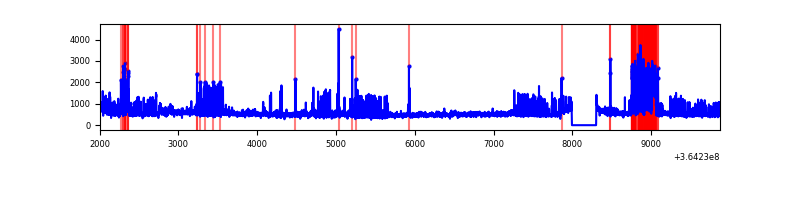 |
Top three noisy pixels from each quadrant. If the there are fewer than three noisy pixels in the level2.evt file, extra rows are filled as -1
| Pixel properties | Quadrant properties | ||||||
|---|---|---|---|---|---|---|---|
| Quadrant | DetID | PixID | Counts | Sigma | Mean | Median | Sigma |
| A | 13 | 254 | 14085 | 69.79 | 937 | 918 | 188.7 |
| A | 3 | 137 | 9703 | 46.56 | 937 | 918 | 188.7 |
| A | 0 | 226 | 7842 | 36.7 | 937 | 918 | 188.7 |
| B | 6 | 159 | 2116992 | 11846.28 | 921 | 897 | 178.6 |
| B | 0 | 190 | 54417 | 299.61 | 921 | 897 | 178.6 |
| B | 0 | 229 | 32990 | 179.66 | 921 | 897 | 178.6 |
| C | 3 | 233 | 1719809 | 8353.45 | 873 | 877 | 205.8 |
| C | 14 | 238 | 143570 | 693.44 | 873 | 877 | 205.8 |
| C | 0 | 10 | 23523 | 110.05 | 873 | 877 | 205.8 |
| D | 8 | 195 | 1069165 | 4943.42 | 898 | 872 | 216.1 |
| D | 1 | 52 | 345234 | 1593.5 | 898 | 872 | 216.1 |
| D | 2 | 250 | 79092 | 361.96 | 898 | 872 | 216.1 |
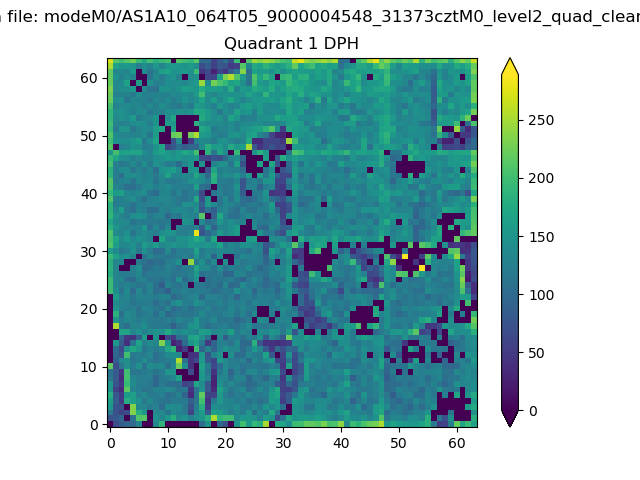
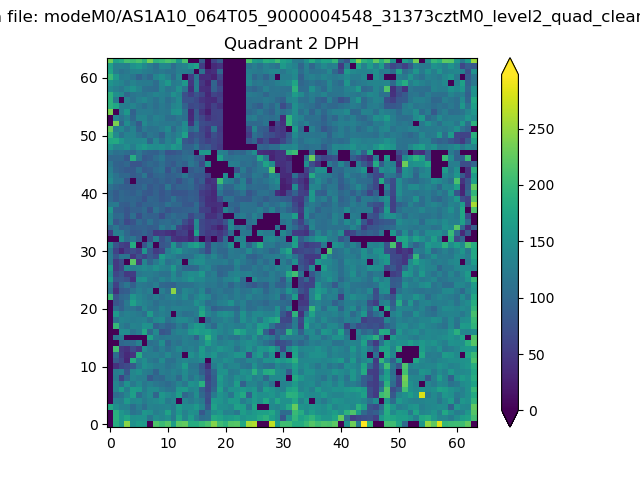
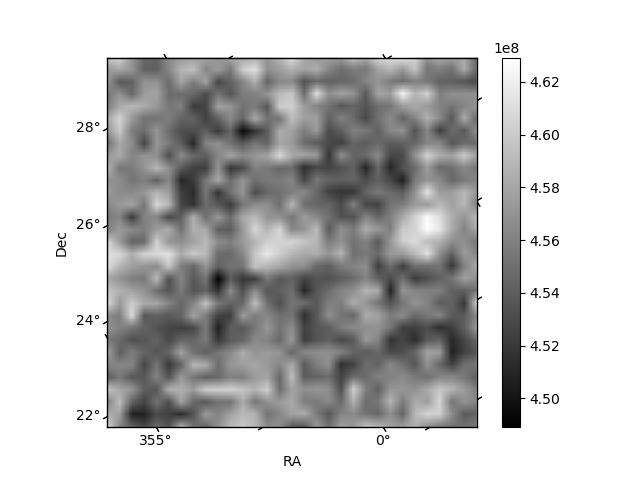
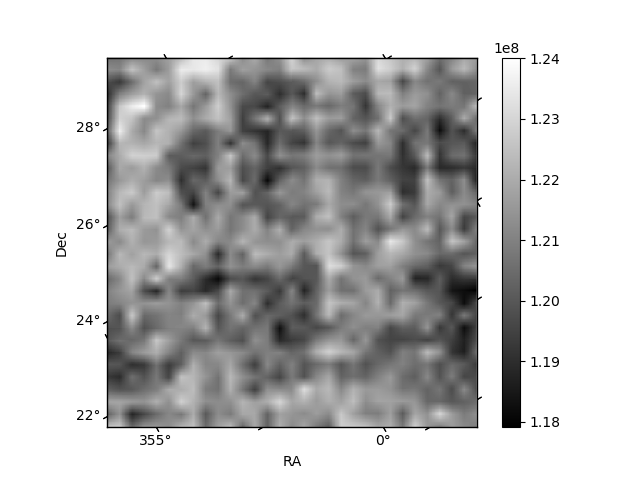
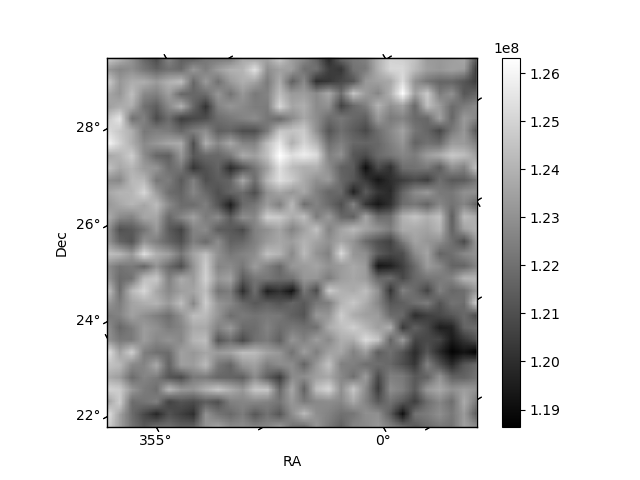
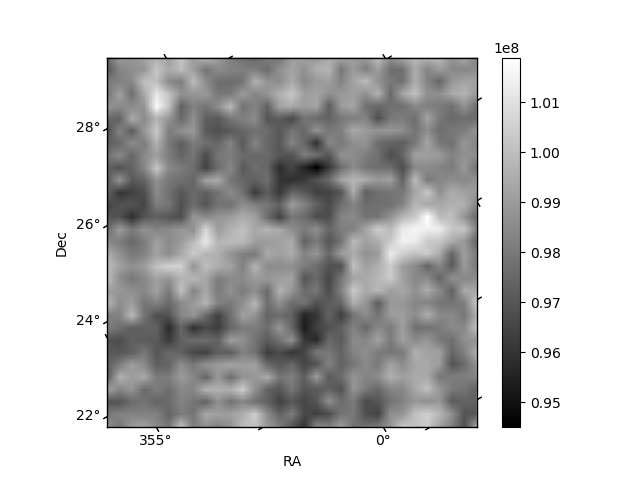
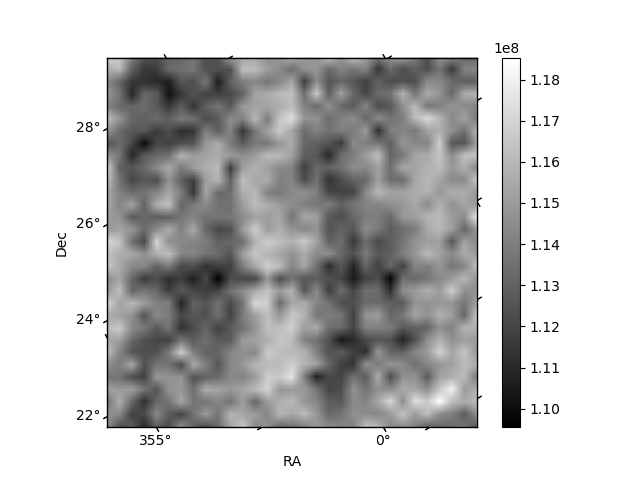
Histogram calculated using DETX and DETY for each event in the final _common_clean file
| Quadrant A | 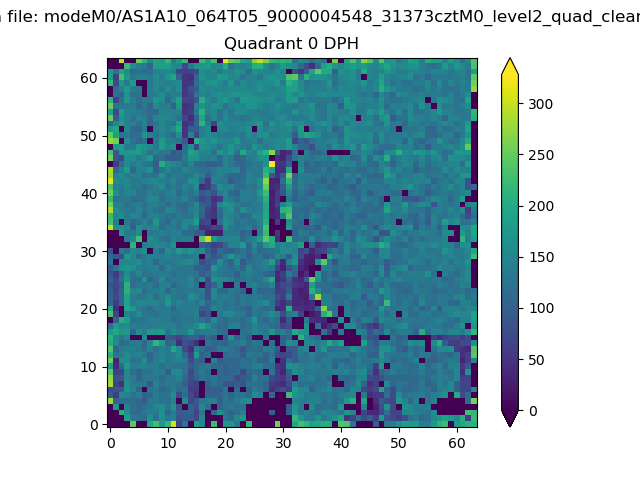 |
 |
Quadrant B |
|---|---|---|---|
| Quadrant D | 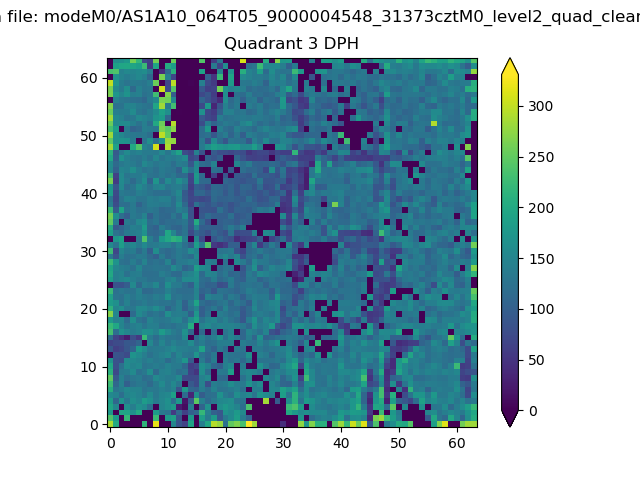 |
 |
Quadrant C |
| Plot type | Count rate plots | Images |
|---|---|---|
| Comparison with Poisson distribution Blue bars denote a histogram of data divided into 1 sec bins. Red curve is a Poisson curve with rate = median count rate of data. |
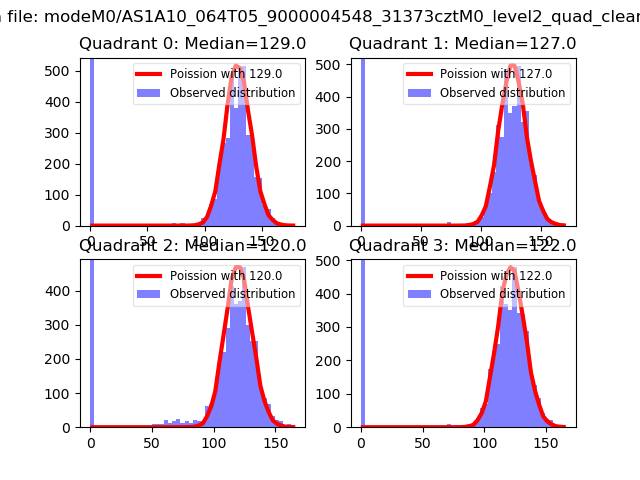 |
 |
| Quadrant-wise count rates Data is divided into 100 sec bins |
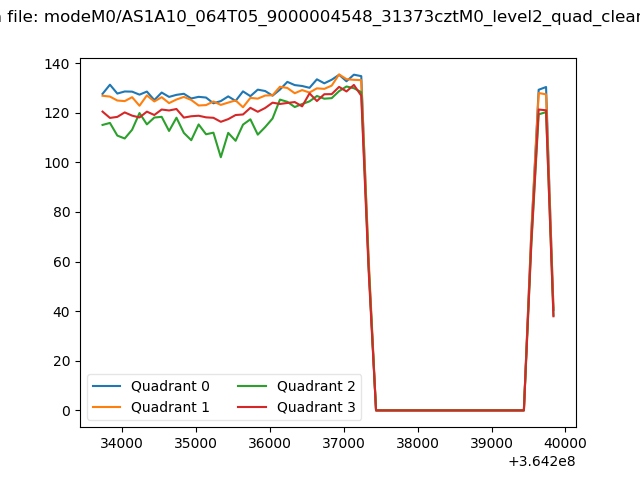 |
|
| Module-wise count rates for Quadrant A Data is divided into 100 sec bins |
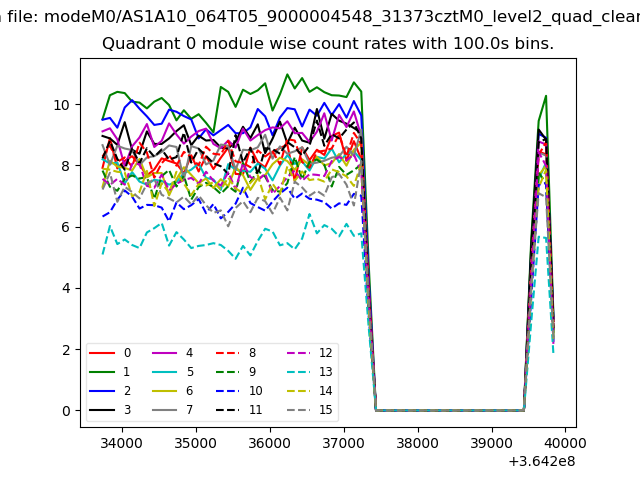 |
 |
| Module-wise count rates for Quadrant B Data is divided into 100 sec bins |
 |
 |
| Module-wise count rates for Quadrant C Data is divided into 100 sec bins |
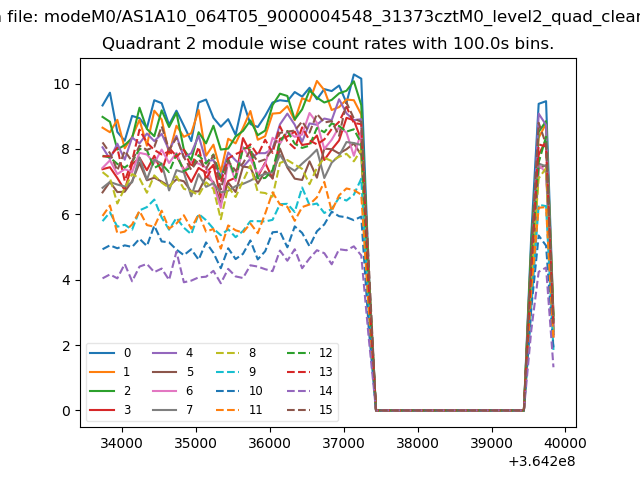 |
 |
| Module-wise count rates for Quadrant D Data is divided into 100 sec bins |
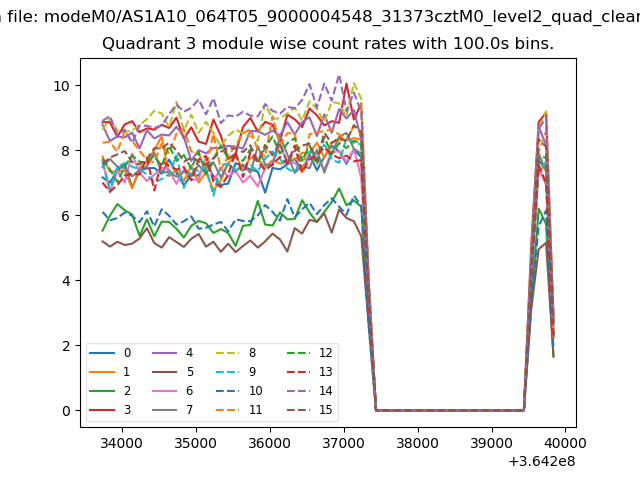 |
 |
| Parameter | Plot |
|---|---|
| CZT HV Monitor | 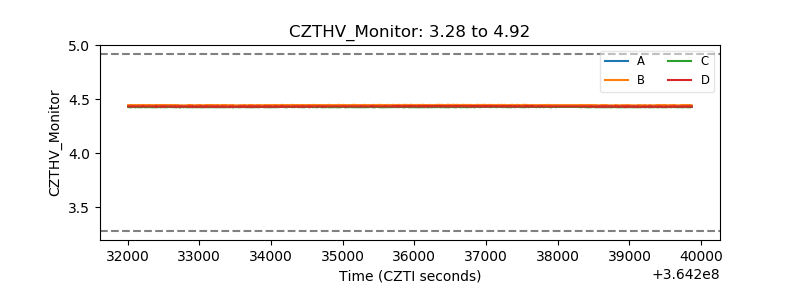 |
| D_VDD | 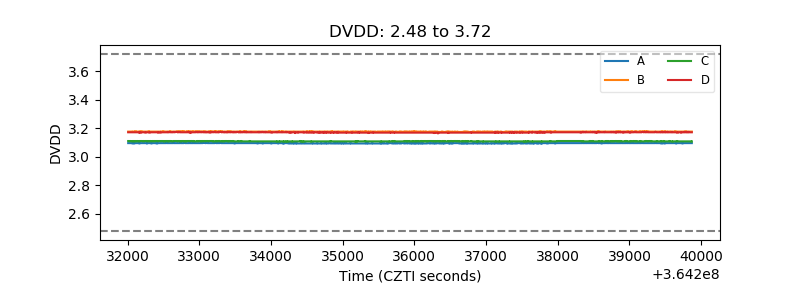 |
| Temperature 1 |  |
| Veto HV Monitor | 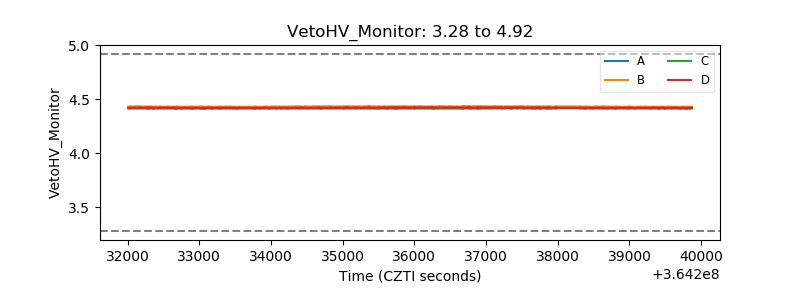 |
| Veto LLD | 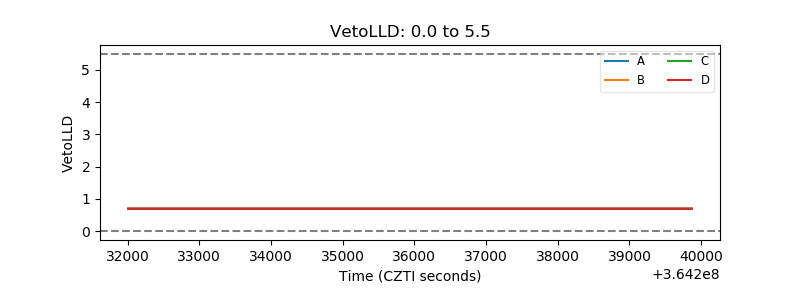 |
| Alpha Counter |  |
| _CPM_Rate | 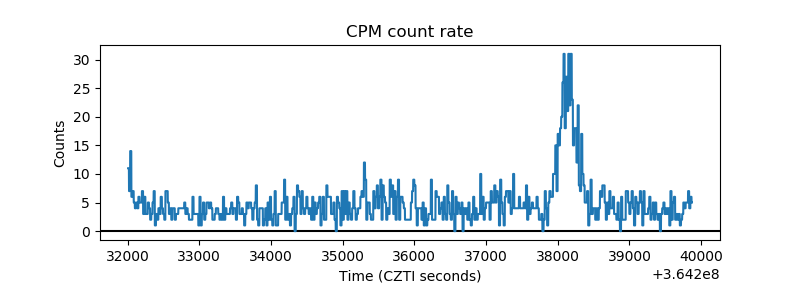 |
| CZT Counter | 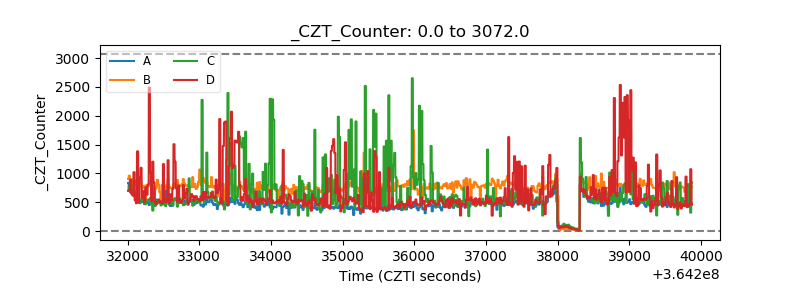 |
| +2.5 Volts monitor |  |
| +5 Volts monitor |  |
| _ROLL_ROT | 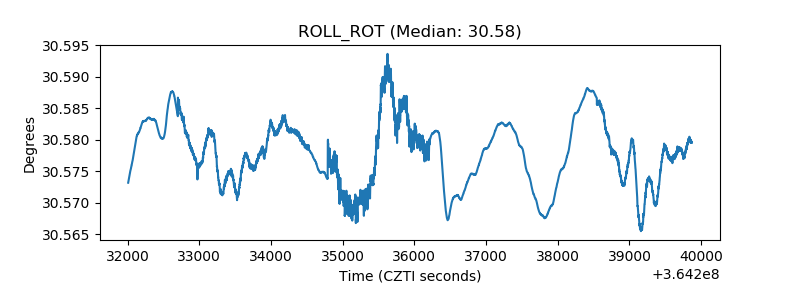 |
| _Roll_DEC |  |
| _Roll_RA | 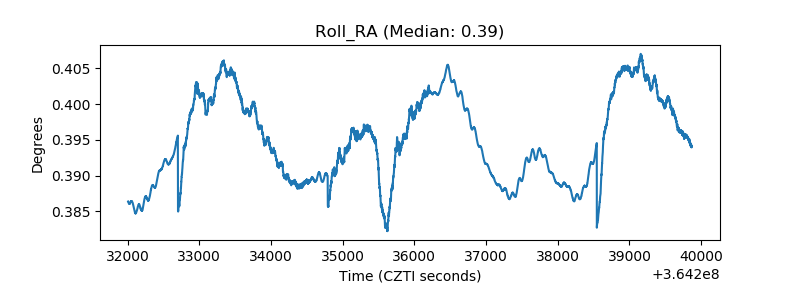 |
| Veto Counter | 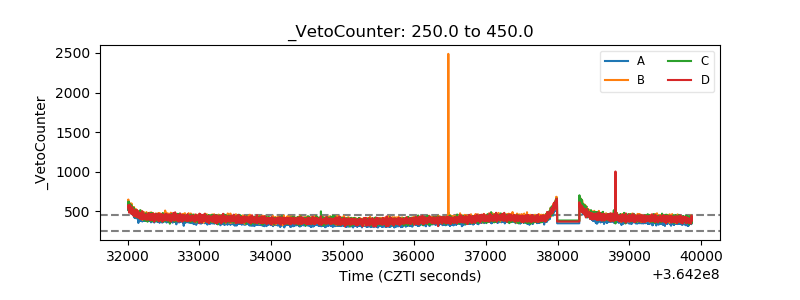 |