| Param | Original file | Final file |
|---|---|---|
| Filename | modeM0/AS1A10_064T05_9000004548_31375cztM0_level2.evt | modeM0/AS1A10_064T05_9000004548_31375cztM0_level2_quad_clean.evt |
| Size (bytes) | 379,742,400 | 60,367,680 |
| Size | 362.2 MB | 57.6 MB |
| Events in quadrant A | 2,157,963 | 386,688 |
| Events in quadrant B | 3,508,778 | 382,369 |
| Events in quadrant C | 2,638,131 | 362,006 |
| Events in quadrant D | 2,877,071 | 367,700 |
| Mode M9 | |||
|---|---|---|---|
| Quadrant | BADHDUFLAG | Total packets | Discarded packets |
| A | 0 | 3 | 0 |
| B | 0 | 3 | 0 |
| C | 0 | 3 | 0 |
| D | 0 | 3 | 0 |
| Mode M0 | |||
|---|---|---|---|
| Quadrant | BADHDUFLAG | Total packets | Discarded packets |
| A | 0 | 9626 | 1 |
| B | 0 | 14100 | 1 |
| C | 0 | 10882 | 1 |
| D | 0 | 11783 | 1 |
| Mode SS | |||
|---|---|---|---|
| Quadrant | BADHDUFLAG | Total packets | Discarded packets |
| A | 0 | 96 | 0 |
| B | 0 | 96 | 0 |
| C | 0 | 96 | 0 |
| D | 0 | 96 | 0 |
| Quadrant | Total seconds | Saturated seconds | Saturation percentage |
|---|---|---|---|
| A | 4680 | 51 | 1.089744% |
| B | 4681 | 109 | 2.328562% |
| C | 4681 | 272 | 5.810724% |
| D | 4681 | 203 | 4.336680% |
Noise dominated data is calculated using 1-second bins in cleaned event files. If a bin has >2000 counts, and if more than 50% of those come from <1% of pixels, then it is considered to be noise-dominated and hence unusable.
| Quadrant | # 1 sec bins | Bins with >0 counts | Bins with >2000 counts | High rate bins dominated by noise | Noise dominated (total time) | Noise dominated (detector-on time) | Marked lightcurve |
|---|---|---|---|---|---|---|---|
| A | 4990 | 4681 | 0 | 0 | 0.00% | 0.00% | 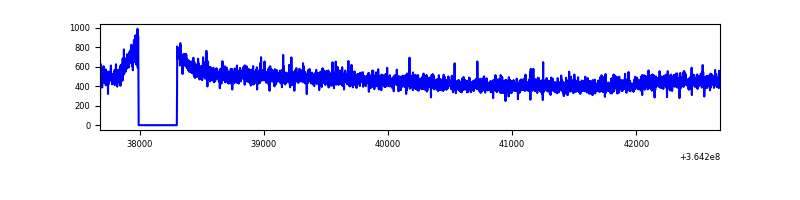 |
| B | 4991 | 4682 | 0 | 0 | 0.00% | 0.00% | 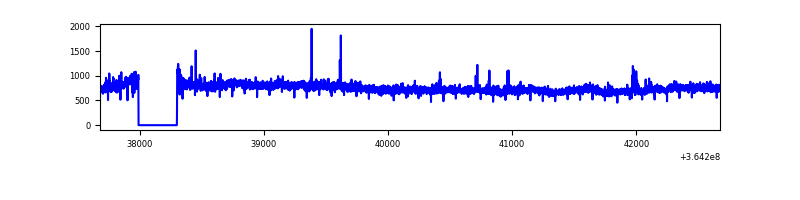 |
| C | 4991 | 4682 | 14 | 14 | 0.28% | 0.30% | 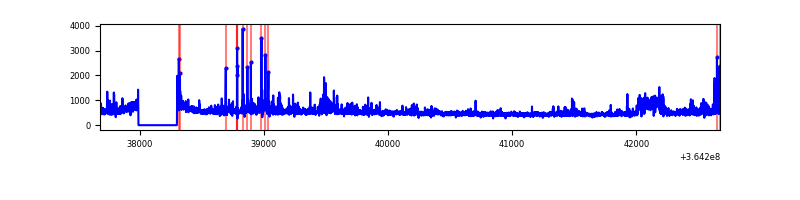 |
| D | 4991 | 4682 | 137 | 137 | 2.74% | 2.93% | 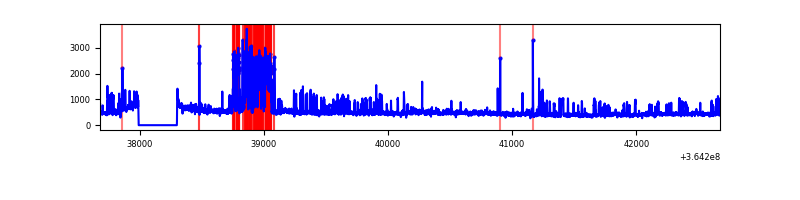 |
Top three noisy pixels from each quadrant. If the there are fewer than three noisy pixels in the level2.evt file, extra rows are filled as -1
| Pixel properties | Quadrant properties | ||||||
|---|---|---|---|---|---|---|---|
| Quadrant | DetID | PixID | Counts | Sigma | Mean | Median | Sigma |
| A | 13 | 254 | 7728 | 63.0 | 559 | 547 | 114.0 |
| A | 3 | 137 | 5991 | 47.76 | 559 | 547 | 114.0 |
| A | 0 | 226 | 4640 | 35.91 | 559 | 547 | 114.0 |
| B | 6 | 159 | 1264075 | 11769.35 | 551 | 535 | 107.4 |
| B | 0 | 190 | 26244 | 239.47 | 551 | 535 | 107.4 |
| B | 4 | 80 | 16770 | 151.22 | 551 | 535 | 107.4 |
| C | 3 | 233 | 357801 | 2842.25 | 529 | 531 | 125.7 |
| C | 14 | 238 | 127332 | 1008.76 | 529 | 531 | 125.7 |
| C | 14 | 254 | 58608 | 462.03 | 529 | 531 | 125.7 |
| D | 8 | 195 | 436615 | 3395.15 | 537 | 522 | 128.4 |
| D | 1 | 52 | 341802 | 2656.99 | 537 | 522 | 128.4 |
| D | 2 | 250 | 27905 | 213.19 | 537 | 522 | 128.4 |
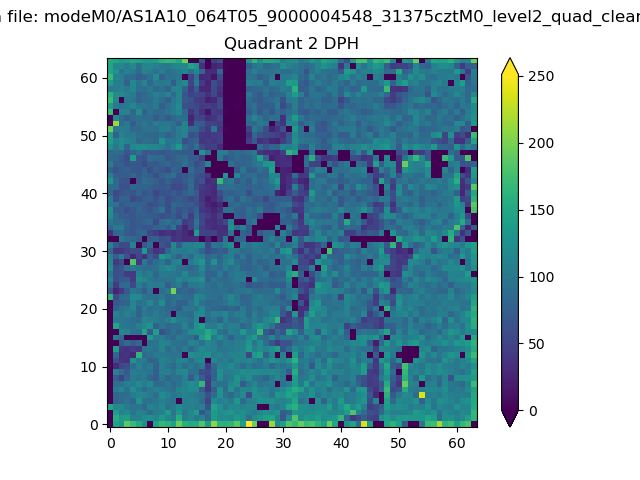
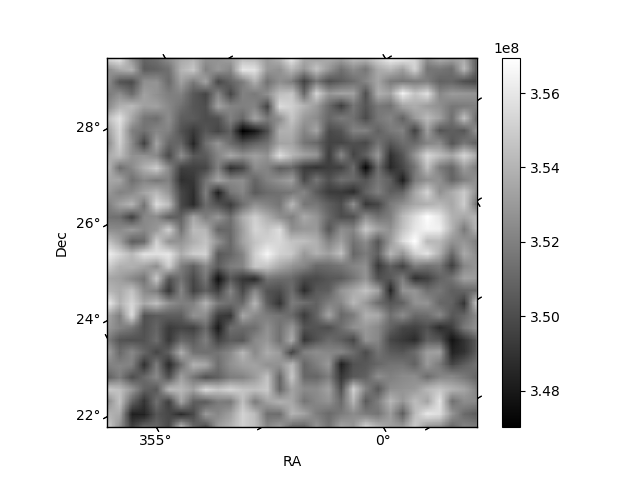
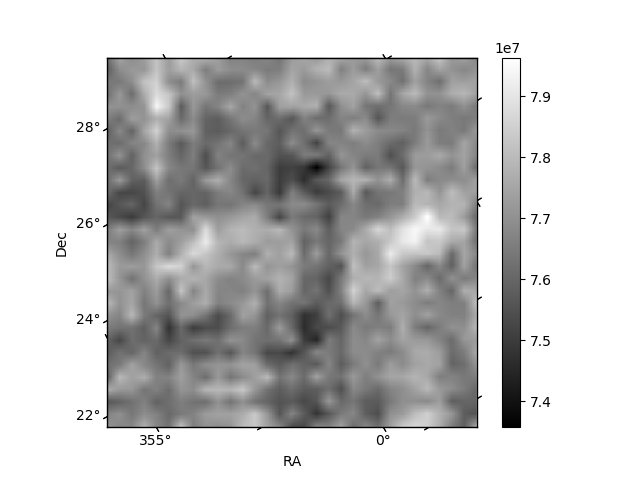
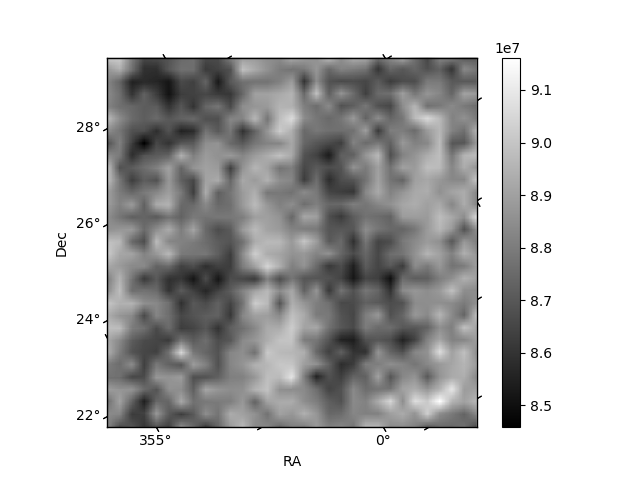
Histogram calculated using DETX and DETY for each event in the final _common_clean file
| Quadrant A | 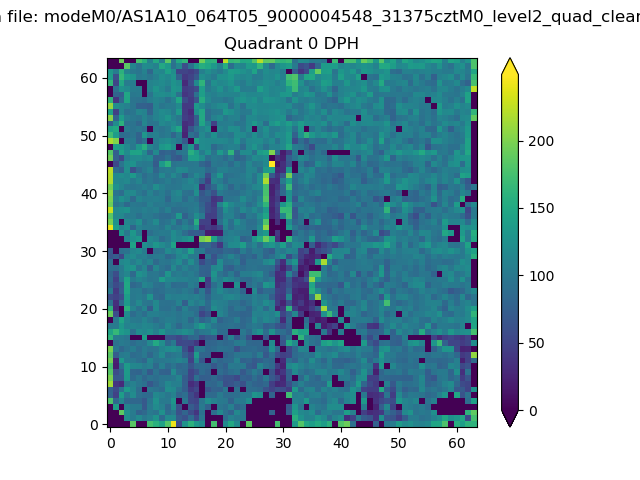 |
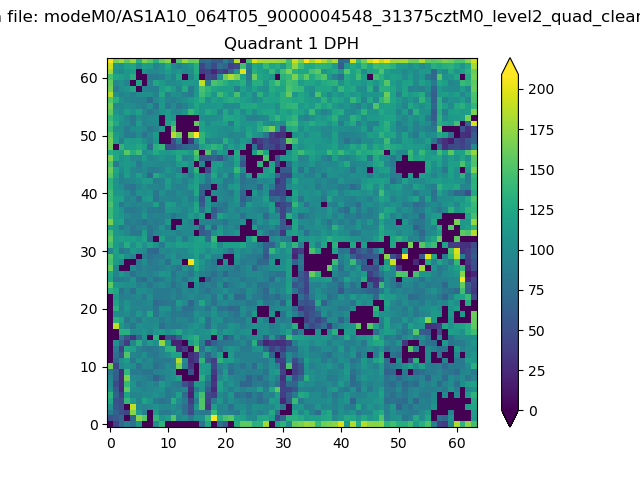 |
Quadrant B |
|---|---|---|---|
| Quadrant D | 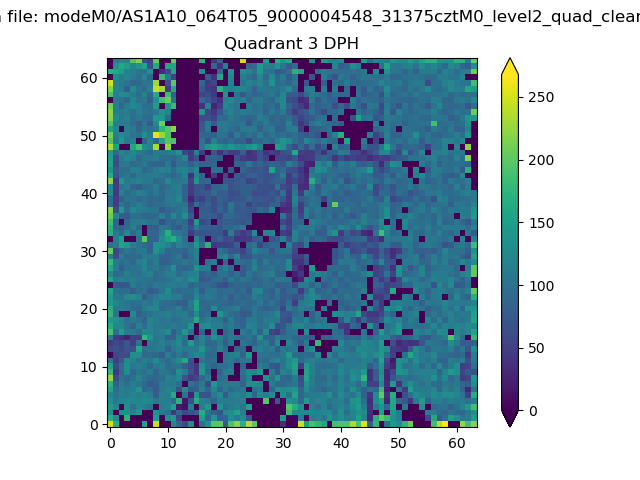 |
 |
Quadrant C |
| Plot type | Count rate plots | Images |
|---|---|---|
| Comparison with Poisson distribution Blue bars denote a histogram of data divided into 1 sec bins. Red curve is a Poisson curve with rate = median count rate of data. |
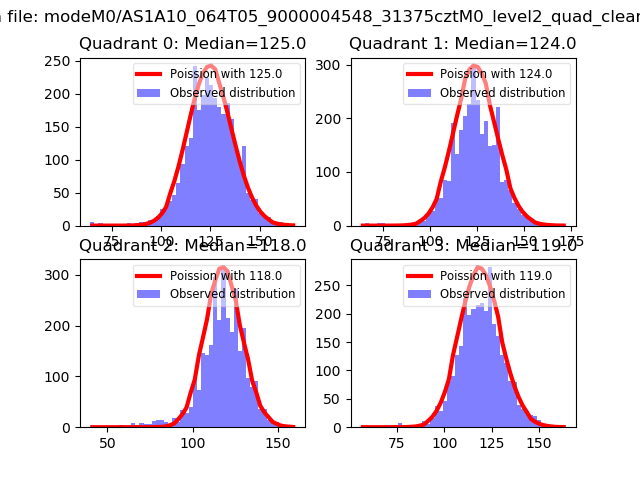 |
 |
| Quadrant-wise count rates Data is divided into 100 sec bins |
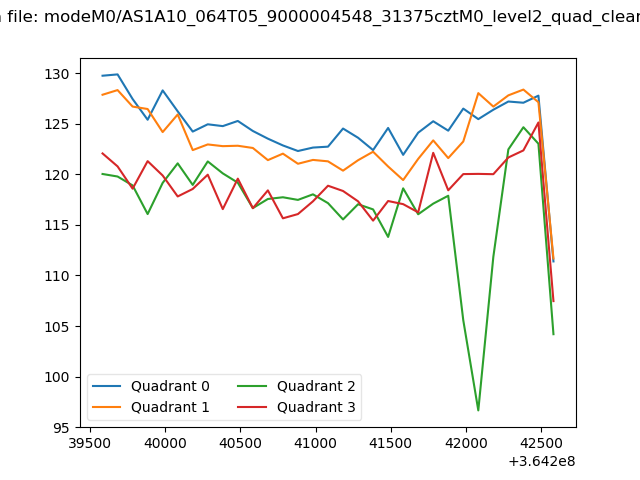 |
|
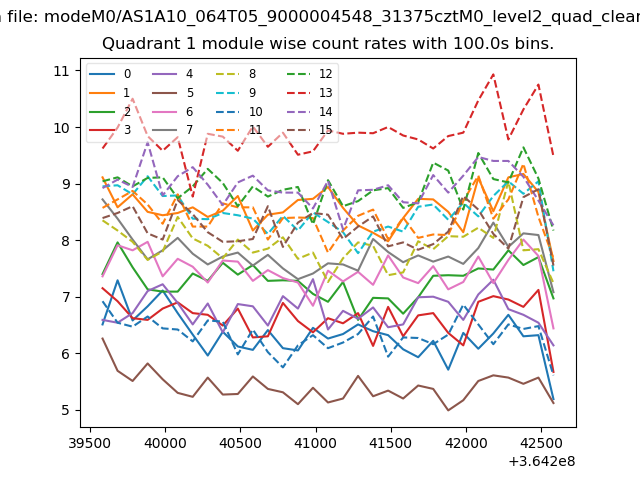
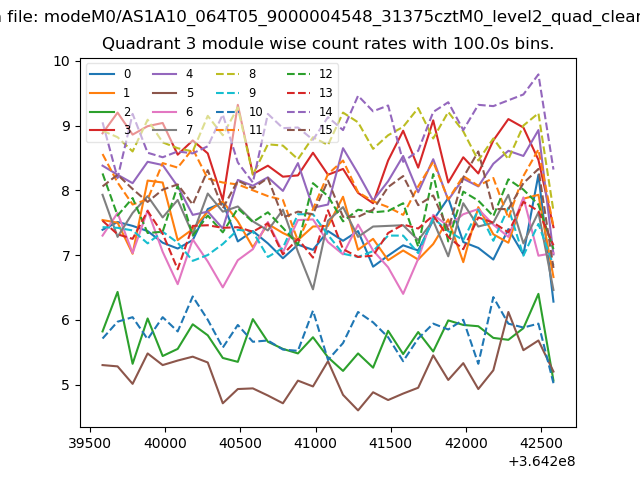
| Module-wise count rates for Quadrant A Data is divided into 100 sec bins |
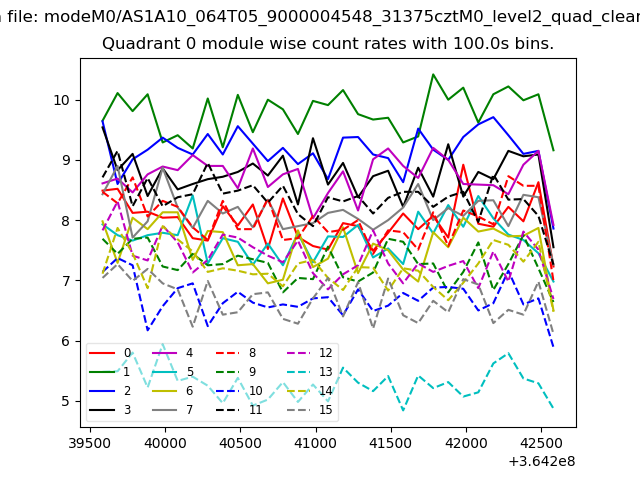 |
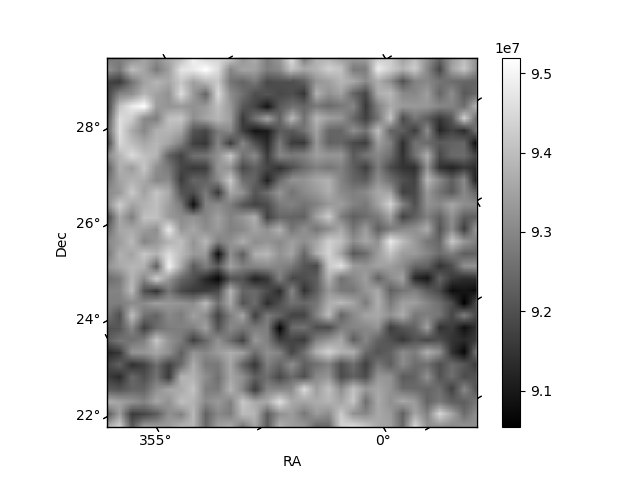 |
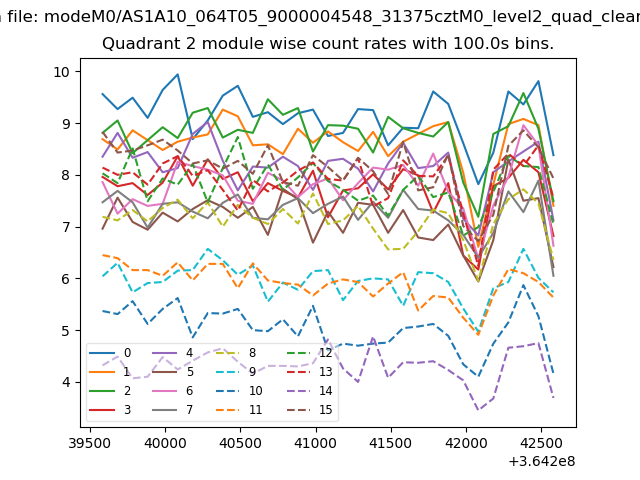
| Module-wise count rates for Quadrant B Data is divided into 100 sec bins |
 |
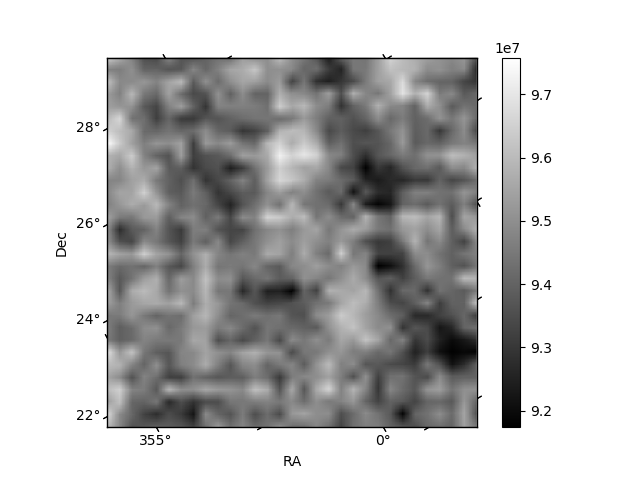 |
| Module-wise count rates for Quadrant C Data is divided into 100 sec bins |
 |
 |
| Module-wise count rates for Quadrant D Data is divided into 100 sec bins |
 |
 |
| Parameter | Plot |
|---|---|
| CZT HV Monitor | 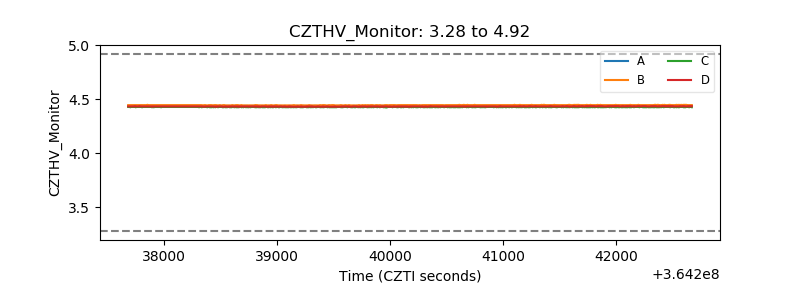 |
| D_VDD | 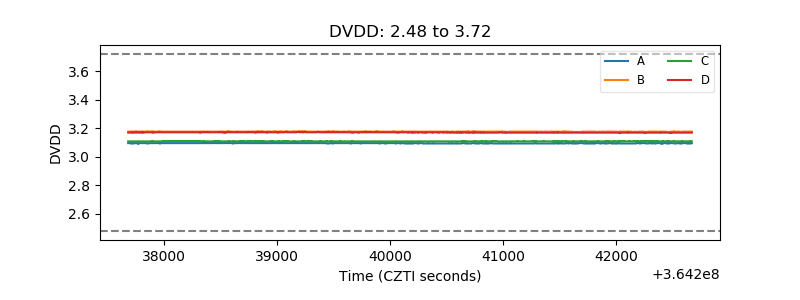 |
| Temperature 1 | 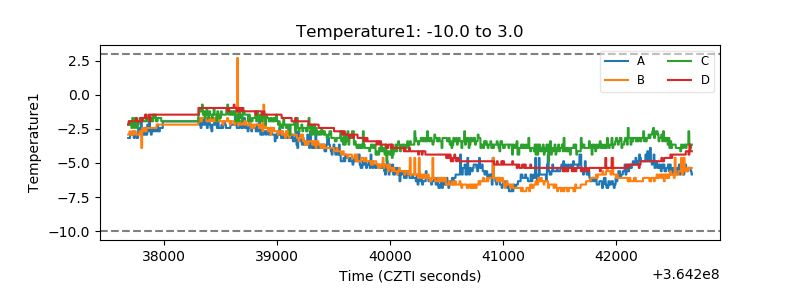 |
| Veto HV Monitor |  |
| Veto LLD | 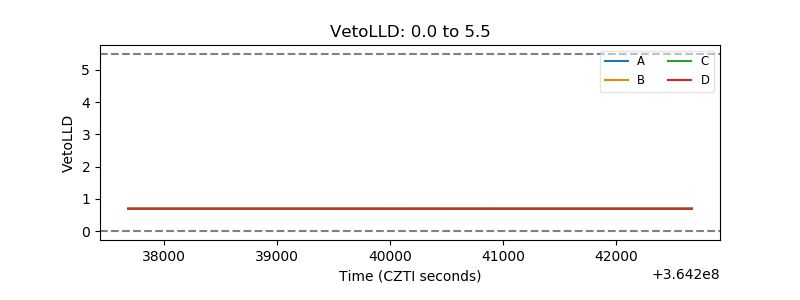 |
| Alpha Counter | 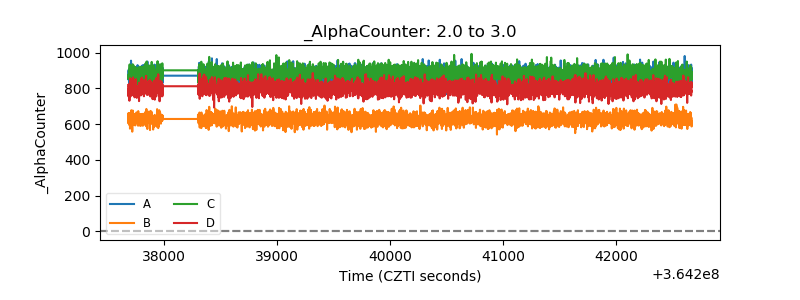 |
| _CPM_Rate | 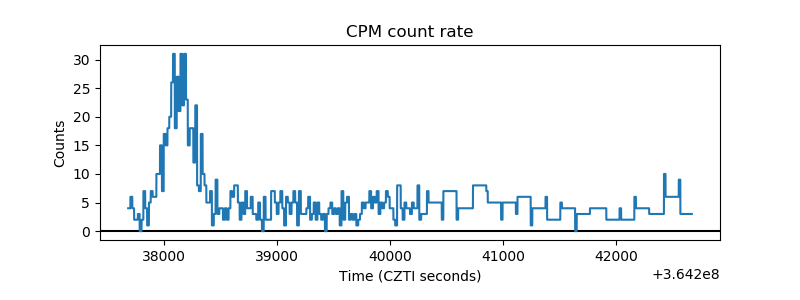 |
| CZT Counter | 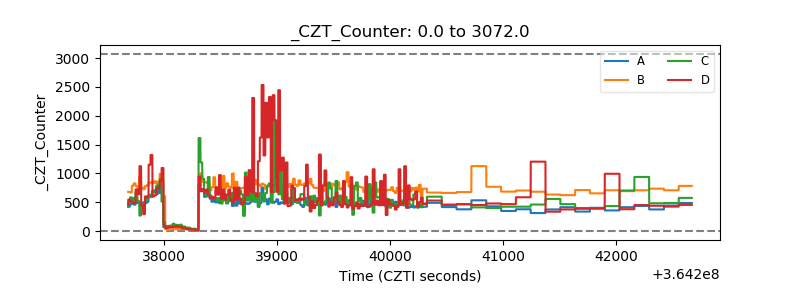 |
| +2.5 Volts monitor |  |
| +5 Volts monitor |  |
| _ROLL_ROT | 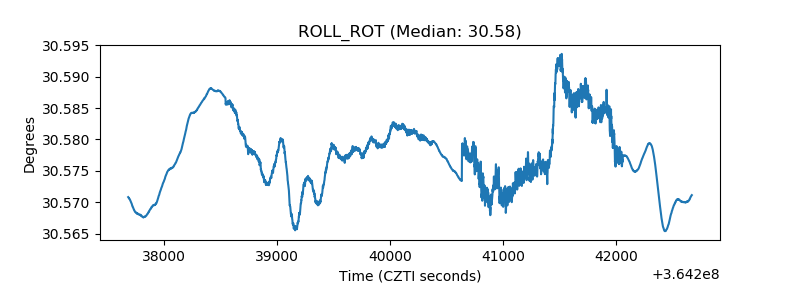 |
| _Roll_DEC | 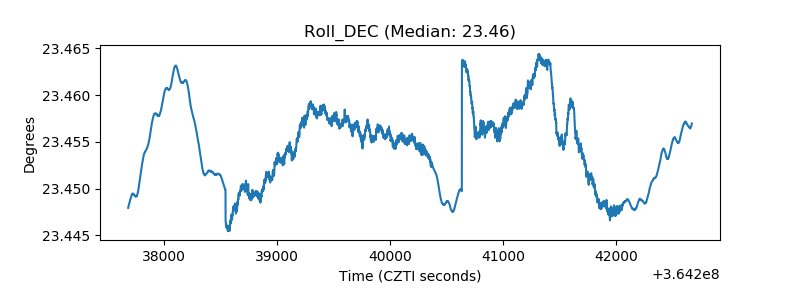 |
| _Roll_RA | 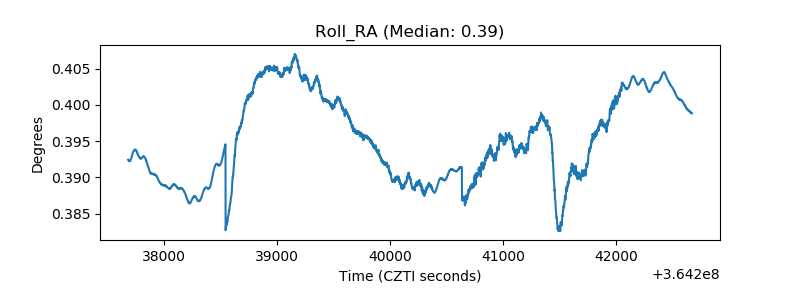 |
| Veto Counter | 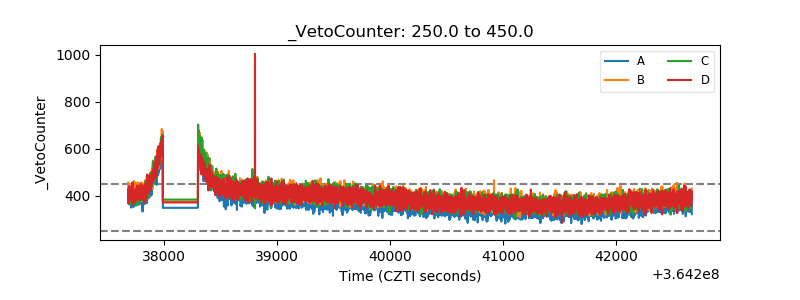 |