| Param | Original file | Final file |
|---|---|---|
| Filename | modeM0/AS1A10_064T05_9000004548_31376cztM0_level2.evt | modeM0/AS1A10_064T05_9000004548_31376cztM0_level2_quad_clean.evt |
| Size (bytes) | 1,412,939,520 | 176,803,200 |
| Size | 1.3 GB | 168.6 MB |
| Events in quadrant A | 6,619,959 | 1,191,873 |
| Events in quadrant B | 10,846,502 | 1,183,713 |
| Events in quadrant C | 16,462,927 | 879,668 |
| Events in quadrant D | 7,913,843 | 1,127,291 |
| Mode M9 | |||
|---|---|---|---|
| Quadrant | BADHDUFLAG | Total packets | Discarded packets |
| A | 0 | 21 | 0 |
| B | 0 | 21 | 0 |
| C | 0 | 21 | 0 |
| D | 0 | 21 | 0 |
| Mode M0 | |||
|---|---|---|---|
| Quadrant | BADHDUFLAG | Total packets | Discarded packets |
| A | 0 | 28785 | 3 |
| B | 0 | 42778 | 3 |
| C | 0 | 58284 | 3 |
| D | 0 | 33102 | 3 |
| Mode SS | |||
|---|---|---|---|
| Quadrant | BADHDUFLAG | Total packets | Discarded packets |
| A | 0 | 286 | 0 |
| B | 0 | 286 | 0 |
| C | 0 | 286 | 0 |
| D | 0 | 286 | 0 |
| Quadrant | Total seconds | Saturated seconds | Saturation percentage |
|---|---|---|---|
| A | 14064 | 55 | 0.391069% |
| B | 14064 | 211 | 1.500284% |
| C | 14063 | 4921 | 34.992534% |
| D | 14063 | 120 | 0.853303% |
Noise dominated data is calculated using 1-second bins in cleaned event files. If a bin has >2000 counts, and if more than 50% of those come from <1% of pixels, then it is considered to be noise-dominated and hence unusable.
| Quadrant | # 1 sec bins | Bins with >0 counts | Bins with >2000 counts | High rate bins dominated by noise | Noise dominated (total time) | Noise dominated (detector-on time) | Marked lightcurve |
|---|---|---|---|---|---|---|---|
| A | 16109 | 14067 | 0 | 0 | 0.00% | 0.00% | 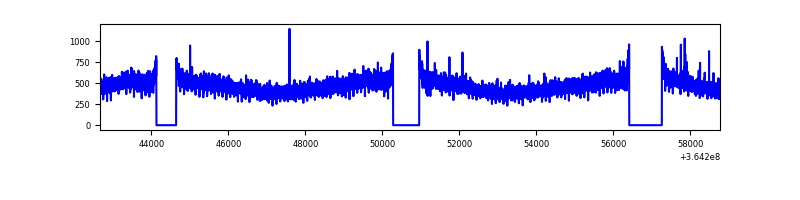 |
| B | 16109 | 14067 | 7 | 7 | 0.04% | 0.05% | 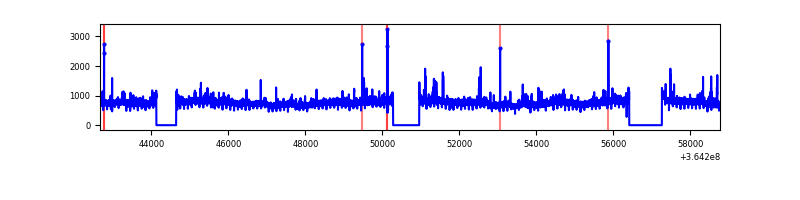 |
| C | 16108 | 14065 | 3047 | 3047 | 18.92% | 21.66% | 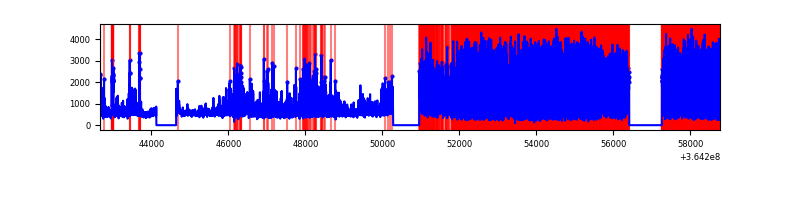 |
| D | 16108 | 14066 | 49 | 49 | 0.30% | 0.35% | 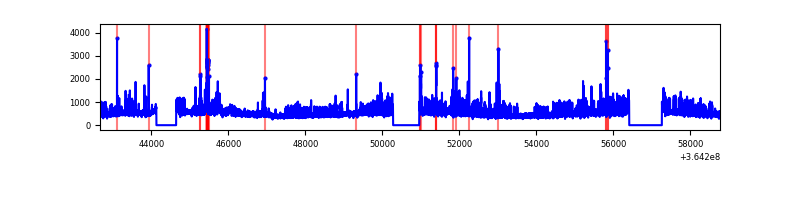 |
Top three noisy pixels from each quadrant. If the there are fewer than three noisy pixels in the level2.evt file, extra rows are filled as -1
| Pixel properties | Quadrant properties | ||||||
|---|---|---|---|---|---|---|---|
| Quadrant | DetID | PixID | Counts | Sigma | Mean | Median | Sigma |
| A | 13 | 254 | 24264 | 66.08 | 1713 | 1679 | 341.8 |
| A | 3 | 137 | 17738 | 46.99 | 1713 | 1679 | 341.8 |
| A | 0 | 226 | 14414 | 37.26 | 1713 | 1679 | 341.8 |
| B | 6 | 159 | 3840727 | 11879.26 | 1689 | 1645 | 323.2 |
| B | 0 | 190 | 161851 | 495.72 | 1689 | 1645 | 323.2 |
| B | 4 | 80 | 103974 | 316.63 | 1689 | 1645 | 323.2 |
| C | 3 | 233 | 10657441 | 34280.8 | 1331 | 1340 | 310.8 |
| C | 14 | 238 | 279003 | 893.25 | 1331 | 1340 | 310.8 |
| C | 10 | 22 | 98085 | 311.23 | 1331 | 1340 | 310.8 |
| D | 8 | 195 | 1305544 | 3308.81 | 1651 | 1604 | 394.1 |
| D | 13 | 249 | 139093 | 348.88 | 1651 | 1604 | 394.1 |
| D | 2 | 250 | 101329 | 253.06 | 1651 | 1604 | 394.1 |
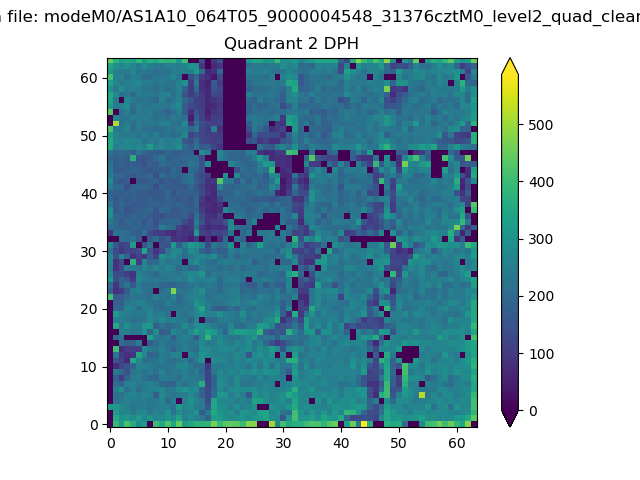
Histogram calculated using DETX and DETY for each event in the final _common_clean file
| Quadrant A | 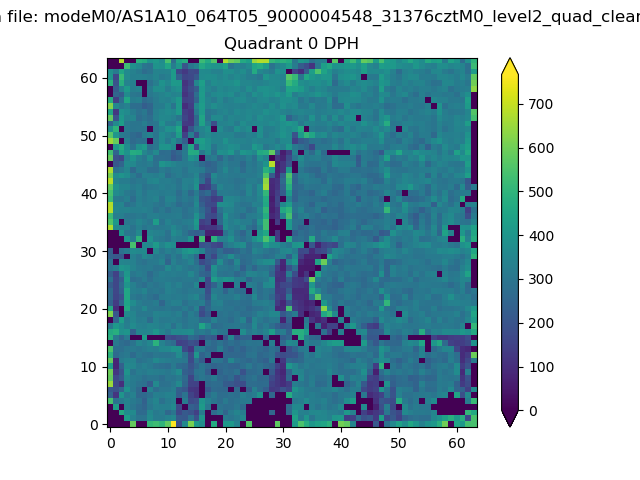 |
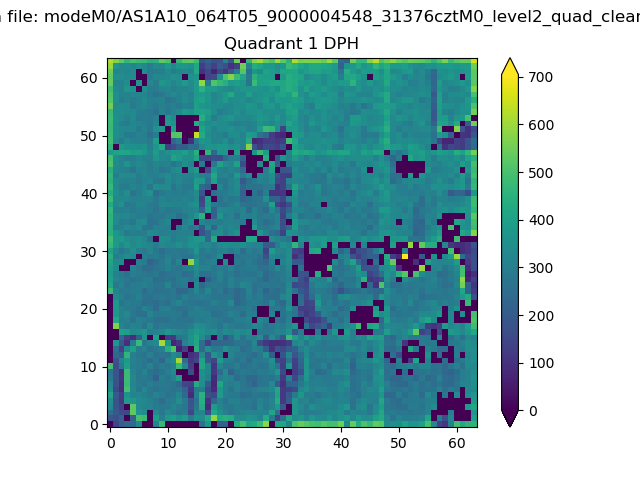 |
Quadrant B |
|---|---|---|---|
| Quadrant D | 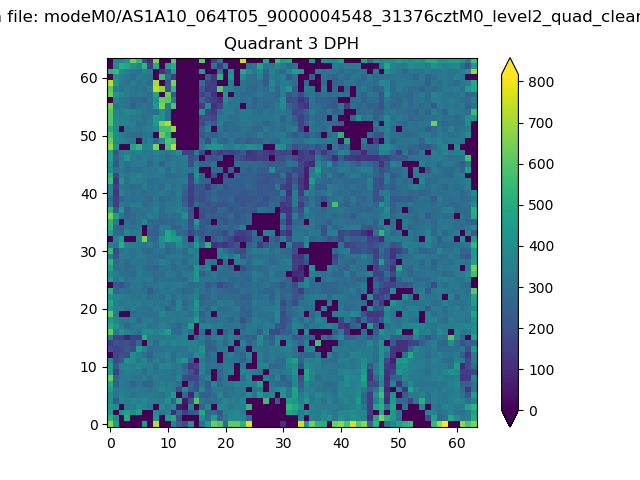 |
 |
Quadrant C |
| Plot type | Count rate plots | Images |
|---|---|---|
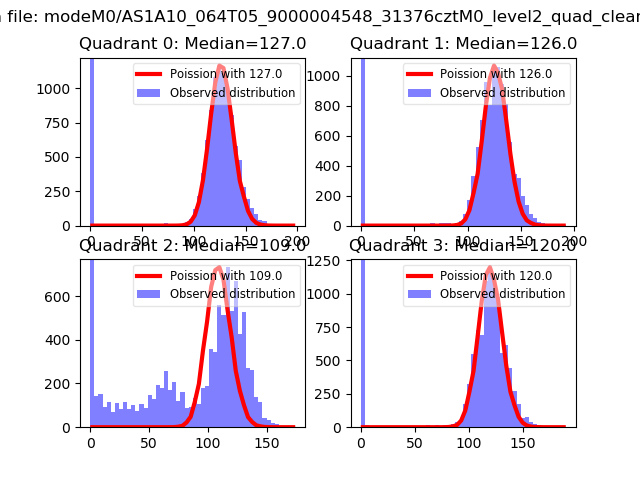
| Comparison with Poisson distribution Blue bars denote a histogram of data divided into 1 sec bins. Red curve is a Poisson curve with rate = median count rate of data. |
 |
 |
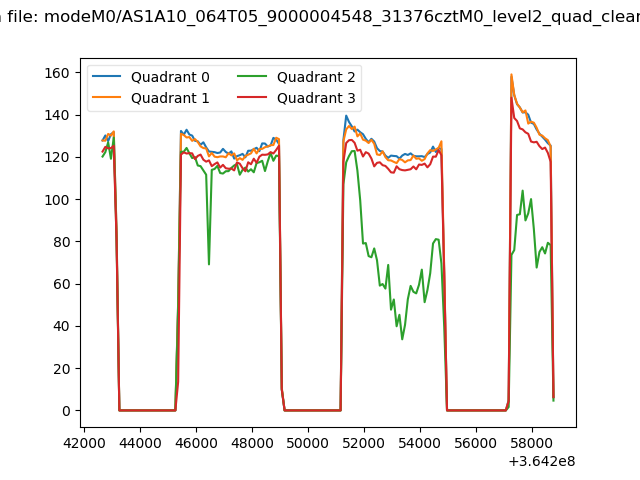
| Quadrant-wise count rates Data is divided into 100 sec bins |
 |
|
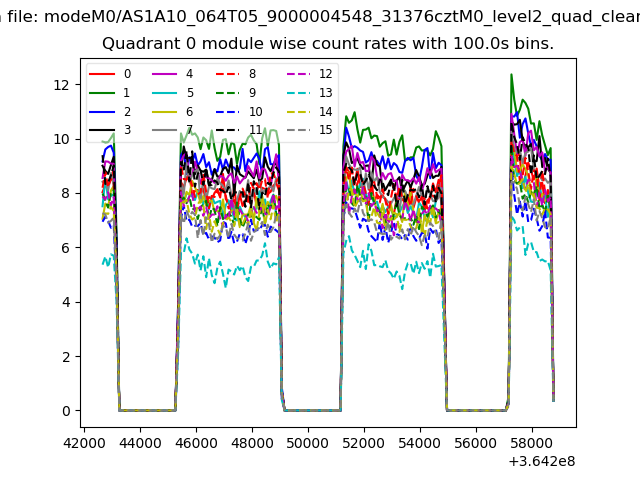
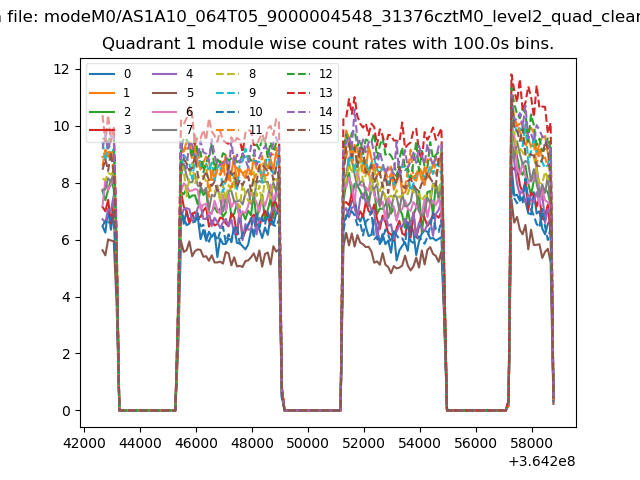
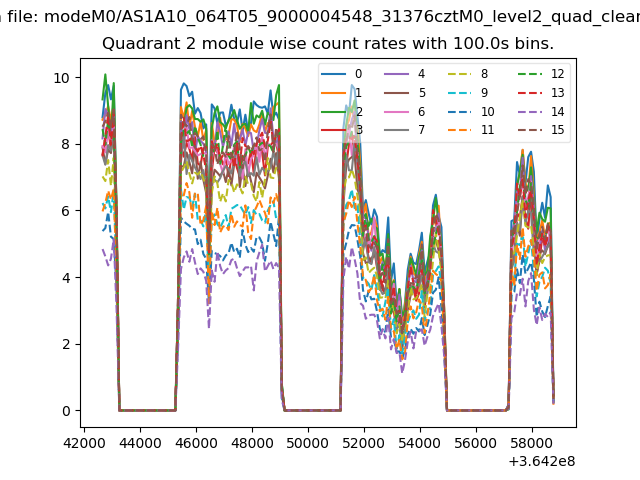
| Module-wise count rates for Quadrant A Data is divided into 100 sec bins |
 |
 |
| Module-wise count rates for Quadrant B Data is divided into 100 sec bins |
 |
 |
| Module-wise count rates for Quadrant C Data is divided into 100 sec bins |
 |
 |
| Module-wise count rates for Quadrant D Data is divided into 100 sec bins |
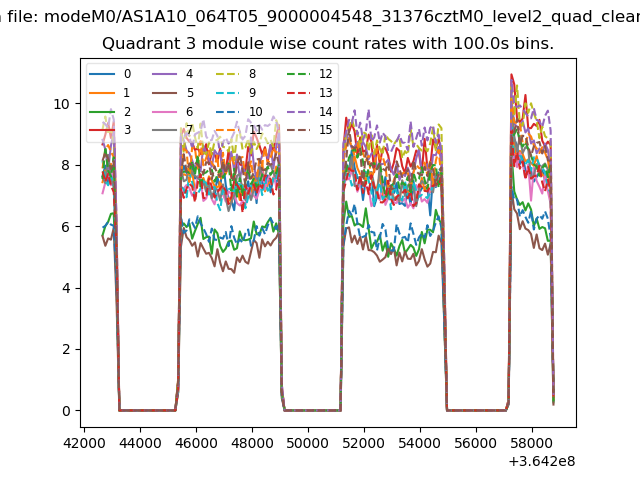 |
 |
| Parameter | Plot |
|---|---|
| CZT HV Monitor | 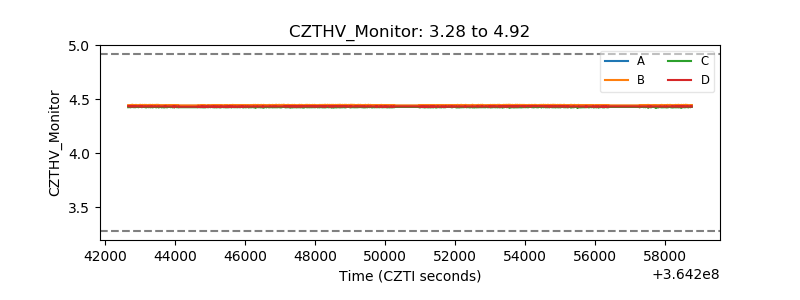 |
| D_VDD | 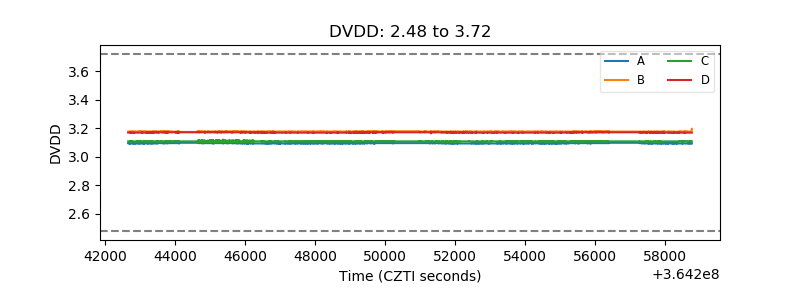 |
| Temperature 1 | 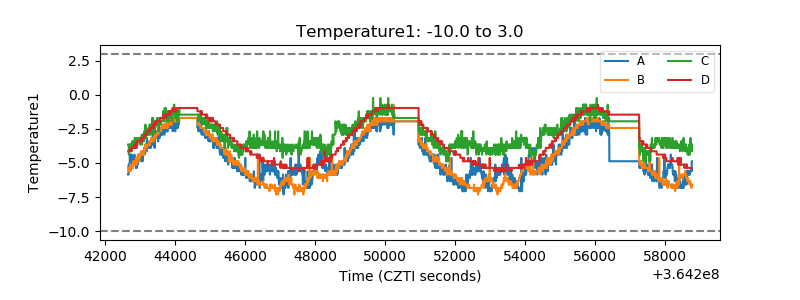 |
| Veto HV Monitor | 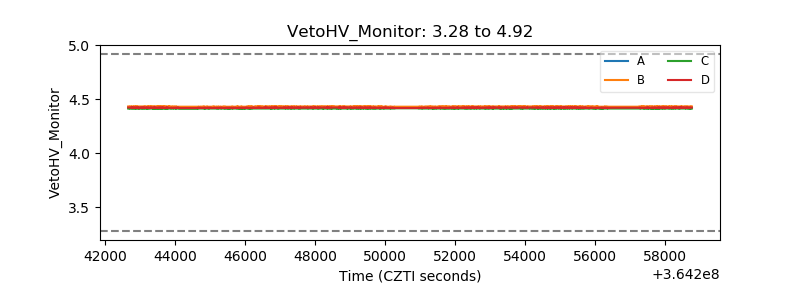 |
| Veto LLD |  |
| Alpha Counter | 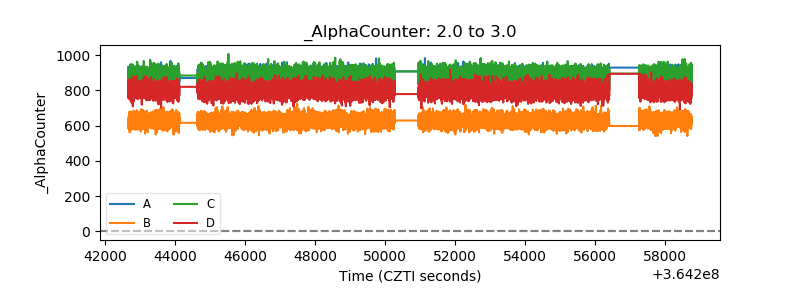 |
| _CPM_Rate | 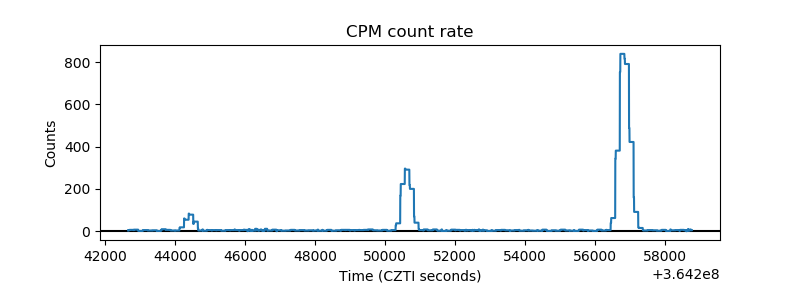 |
| CZT Counter | 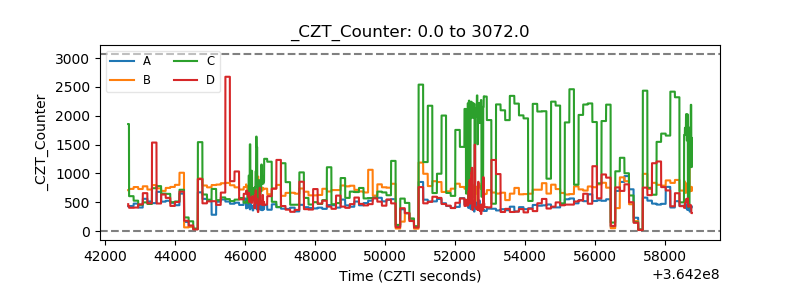 |
| +2.5 Volts monitor |  |
| +5 Volts monitor |  |
| _ROLL_ROT | 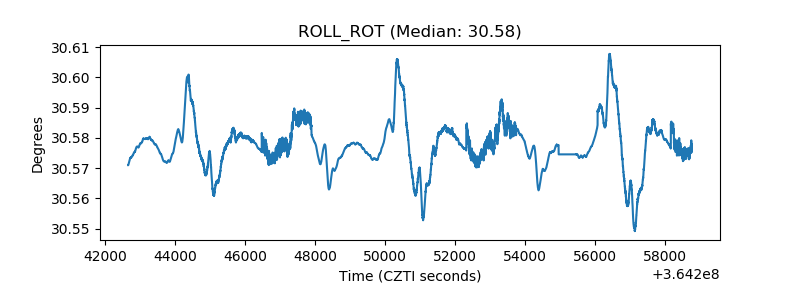 |
| _Roll_DEC | 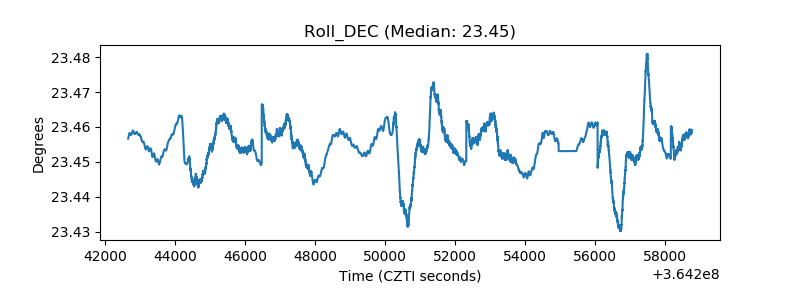 |
| _Roll_RA | 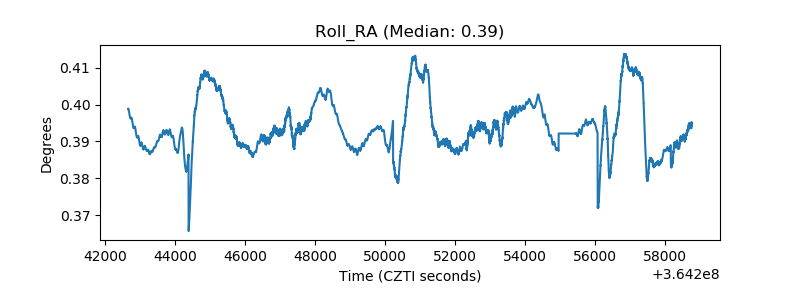 |
| Veto Counter |  |