| Param | Original file | Final file |
|---|---|---|
| Filename | modeM0/AS1A10_064T05_9000004548_31377cztM0_level2.evt | modeM0/AS1A10_064T05_9000004548_31377cztM0_level2_quad_clean.evt |
| Size (bytes) | 673,657,920 | 89,153,280 |
| Size | 642.5 MB | 85.0 MB |
| Events in quadrant A | 3,000,410 | 611,983 |
| Events in quadrant B | 4,965,716 | 614,817 |
| Events in quadrant C | 8,494,267 | 445,527 |
| Events in quadrant D | 3,507,734 | 579,507 |
| Mode M9 | |||
|---|---|---|---|
| Quadrant | BADHDUFLAG | Total packets | Discarded packets |
| A | 0 | 11 | 0 |
| B | 0 | 11 | 0 |
| C | 0 | 11 | 0 |
| D | 0 | 11 | 0 |
| Mode M0 | |||
|---|---|---|---|
| Quadrant | BADHDUFLAG | Total packets | Discarded packets |
| A | 0 | 13155 | 1 |
| B | 0 | 19625 | 1 |
| C | 0 | 29748 | 3 |
| D | 0 | 14933 | 1 |
| Mode SS | |||
|---|---|---|---|
| Quadrant | BADHDUFLAG | Total packets | Discarded packets |
| A | 0 | 128 | 0 |
| B | 0 | 128 | 0 |
| C | 0 | 128 | 0 |
| D | 0 | 128 | 0 |
| Quadrant | Total seconds | Saturated seconds | Saturation percentage |
|---|---|---|---|
| A | 6415 | 29 | 0.452065% |
| B | 6416 | 88 | 1.371571% |
| C | 6415 | 2432 | 37.911146% |
| D | 6415 | 41 | 0.639127% |
Noise dominated data is calculated using 1-second bins in cleaned event files. If a bin has >2000 counts, and if more than 50% of those come from <1% of pixels, then it is considered to be noise-dominated and hence unusable.
| Quadrant | # 1 sec bins | Bins with >0 counts | Bins with >2000 counts | High rate bins dominated by noise | Noise dominated (total time) | Noise dominated (detector-on time) | Marked lightcurve |
|---|---|---|---|---|---|---|---|
| A | 7440 | 6416 | 0 | 0 | 0.00% | 0.00% | 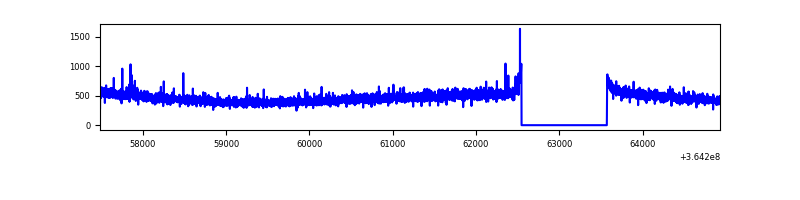 |
| B | 7441 | 6417 | 15 | 15 | 0.20% | 0.23% | 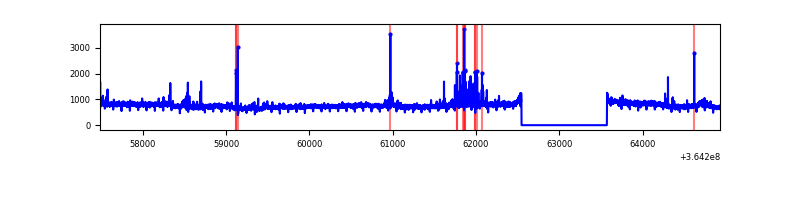 |
| C | 7440 | 6416 | 1605 | 1605 | 21.57% | 25.02% |  |
| D | 7440 | 6416 | 15 | 15 | 0.20% | 0.23% | 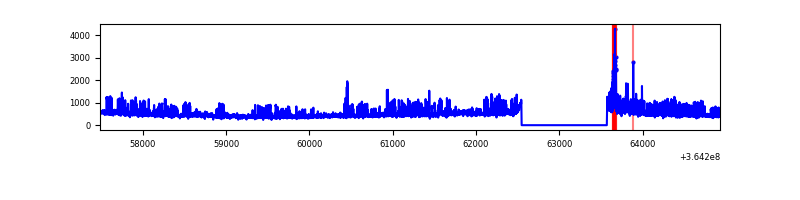 |
Top three noisy pixels from each quadrant. If the there are fewer than three noisy pixels in the level2.evt file, extra rows are filled as -1
| Pixel properties | Quadrant properties | ||||||
|---|---|---|---|---|---|---|---|
| Quadrant | DetID | PixID | Counts | Sigma | Mean | Median | Sigma |
| A | 13 | 254 | 10596 | 63.1 | 776 | 763 | 155.8 |
| A | 3 | 137 | 8013 | 46.52 | 776 | 763 | 155.8 |
| A | 0 | 226 | 6379 | 36.04 | 776 | 763 | 155.8 |
| B | 6 | 159 | 1768936 | 11987.3 | 768 | 746 | 147.5 |
| B | 12 | 18 | 70001 | 469.51 | 768 | 746 | 147.5 |
| B | 0 | 190 | 59510 | 398.39 | 768 | 746 | 147.5 |
| C | 3 | 233 | 5916078 | 41084.05 | 613 | 617 | 144.0 |
| C | 14 | 238 | 104396 | 720.77 | 613 | 617 | 144.0 |
| C | 10 | 22 | 32627 | 222.32 | 613 | 617 | 144.0 |
| D | 8 | 195 | 580360 | 3236.32 | 748 | 727 | 179.1 |
| D | 2 | 250 | 92648 | 513.23 | 748 | 727 | 179.1 |
| D | 2 | 234 | 25829 | 140.15 | 748 | 727 | 179.1 |
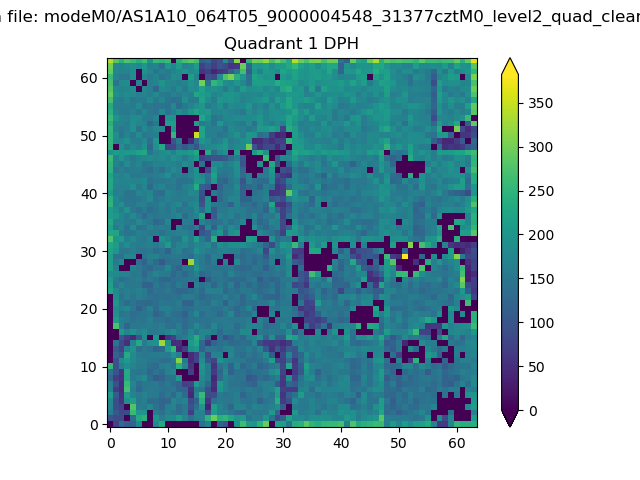
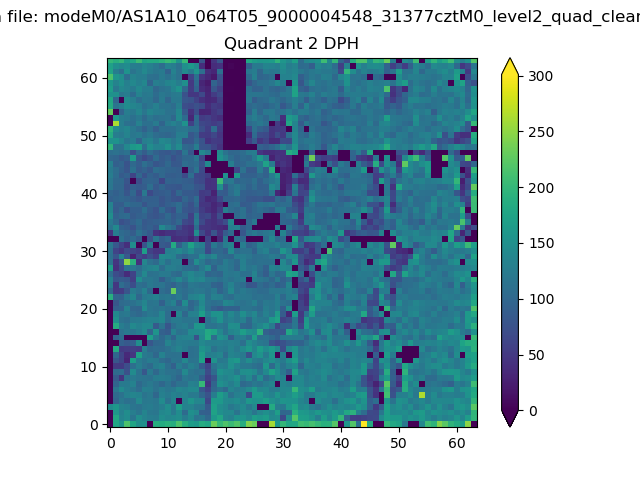
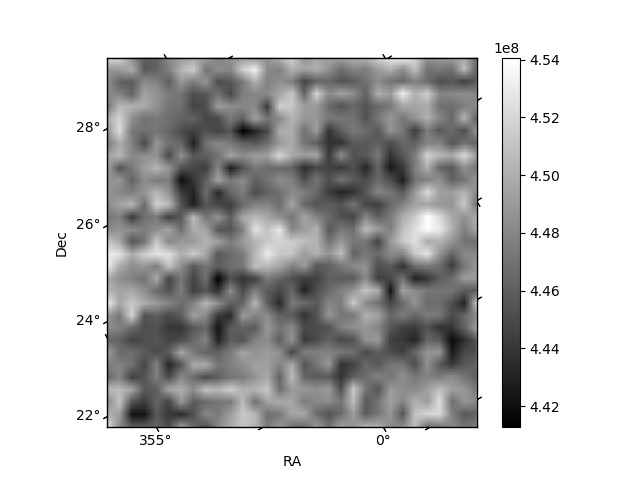
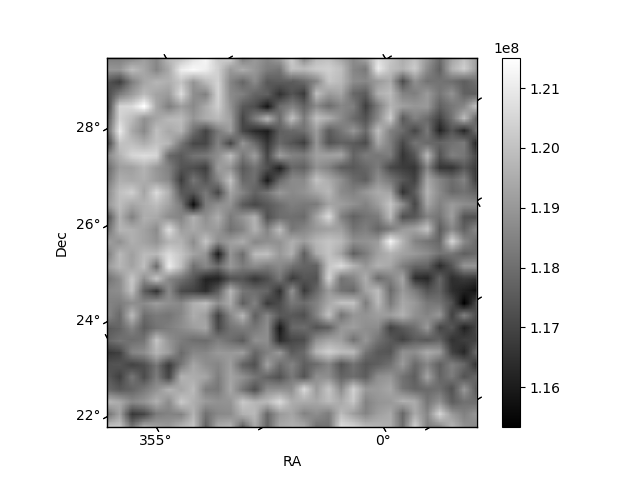
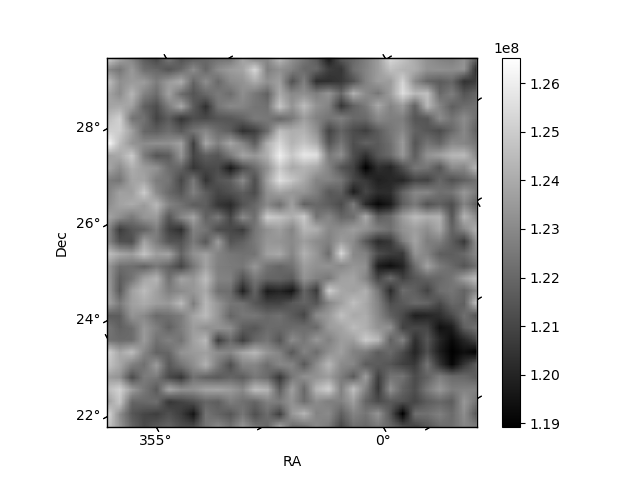
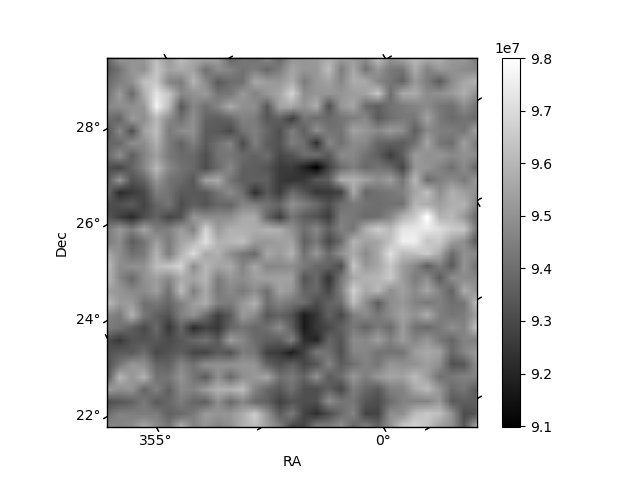
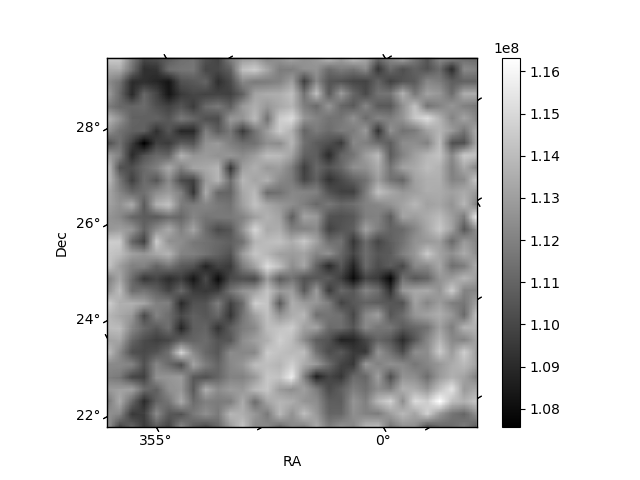
Histogram calculated using DETX and DETY for each event in the final _common_clean file
| Quadrant A | 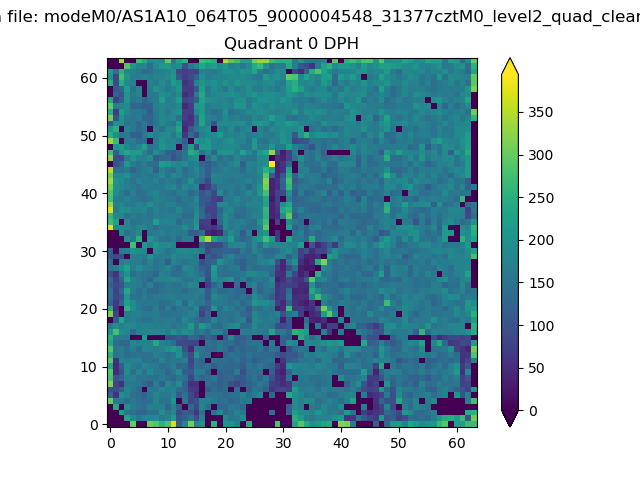 |
 |
Quadrant B |
|---|---|---|---|
| Quadrant D | 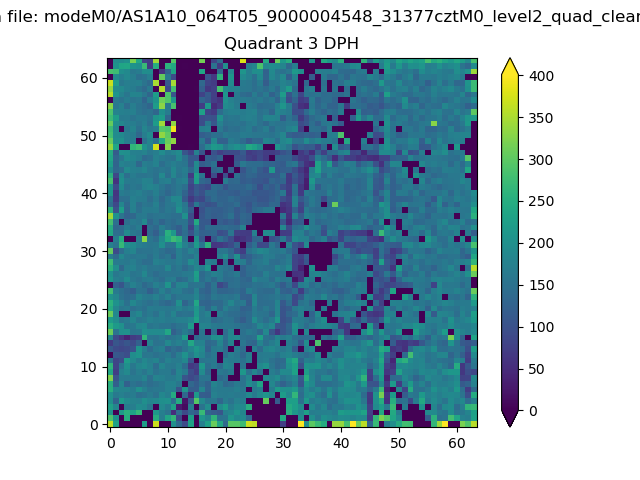 |
 |
Quadrant C |
| Plot type | Count rate plots | Images |
|---|---|---|
| Comparison with Poisson distribution Blue bars denote a histogram of data divided into 1 sec bins. Red curve is a Poisson curve with rate = median count rate of data. |
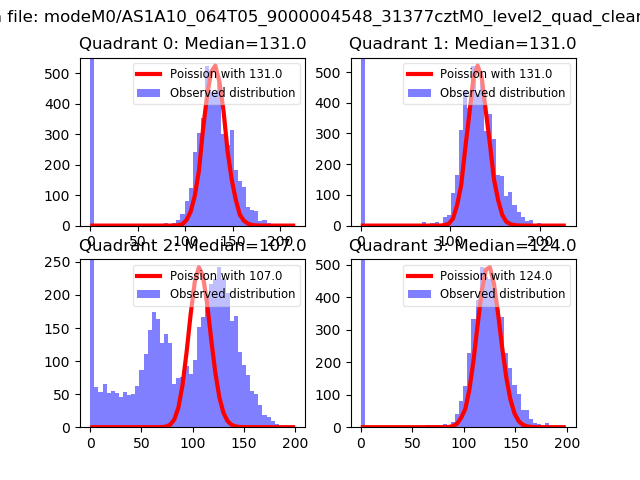 |
 |
| Quadrant-wise count rates Data is divided into 100 sec bins |
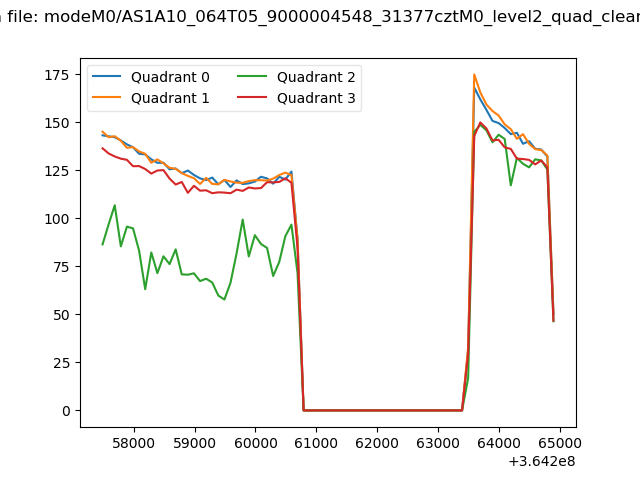 |
|
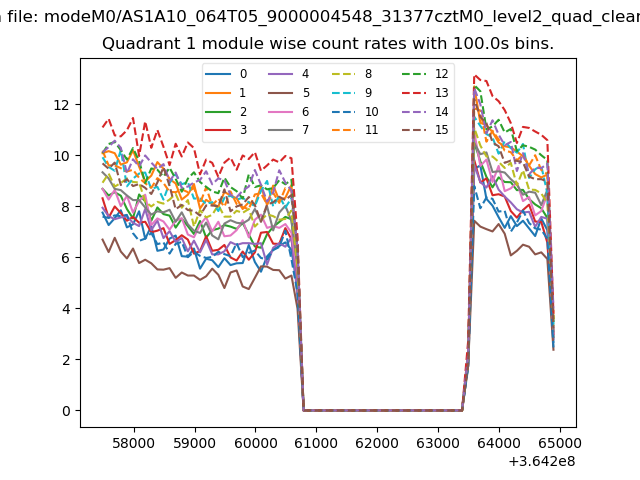
| Module-wise count rates for Quadrant A Data is divided into 100 sec bins |
 |
 |
| Module-wise count rates for Quadrant B Data is divided into 100 sec bins |
 |
 |
| Module-wise count rates for Quadrant C Data is divided into 100 sec bins |
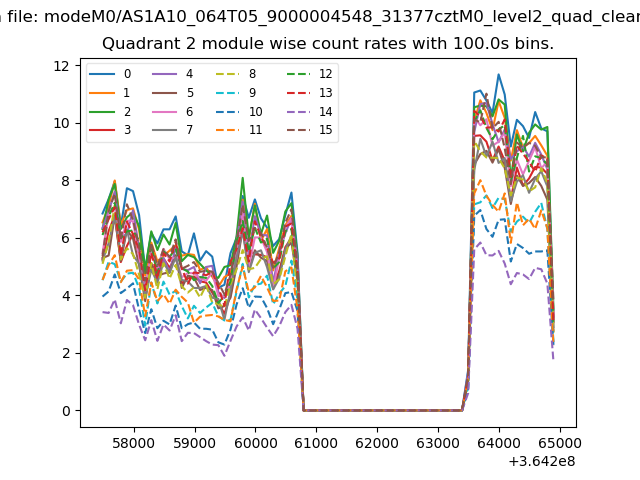 |
 |
| Module-wise count rates for Quadrant D Data is divided into 100 sec bins |
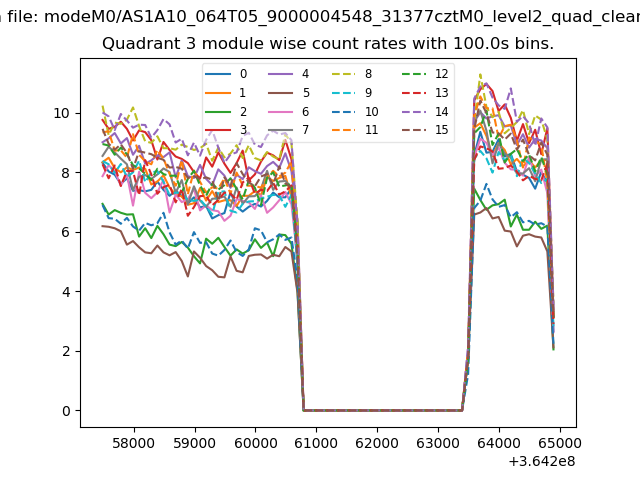 |
 |
| Parameter | Plot |
|---|---|
| CZT HV Monitor | 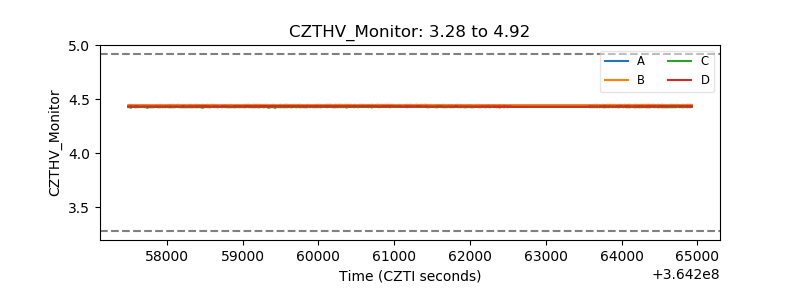 |
| D_VDD | 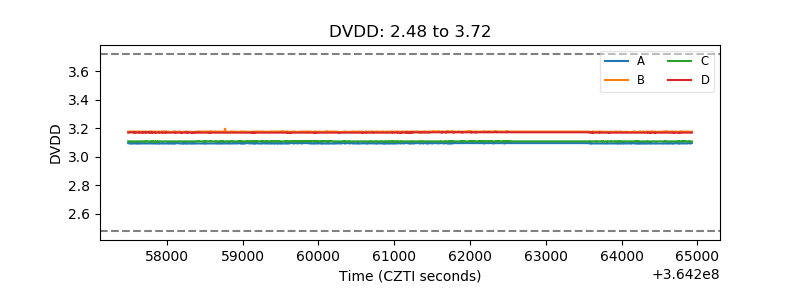 |
| Temperature 1 |  |
| Veto HV Monitor | 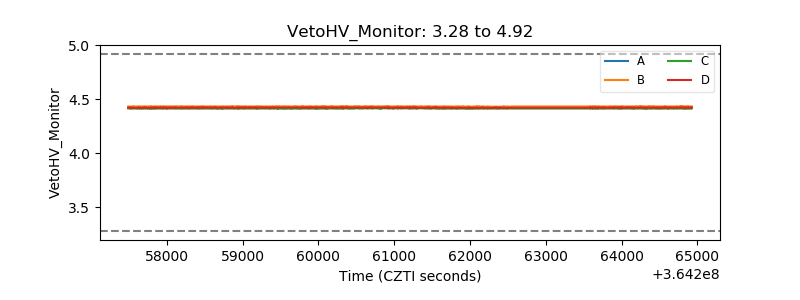 |
| Veto LLD |  |
| Alpha Counter | 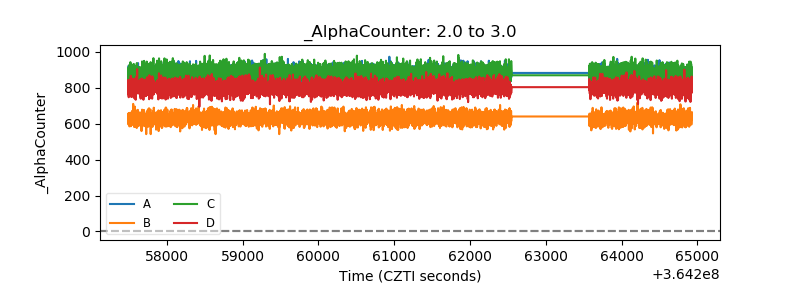 |
| _CPM_Rate | 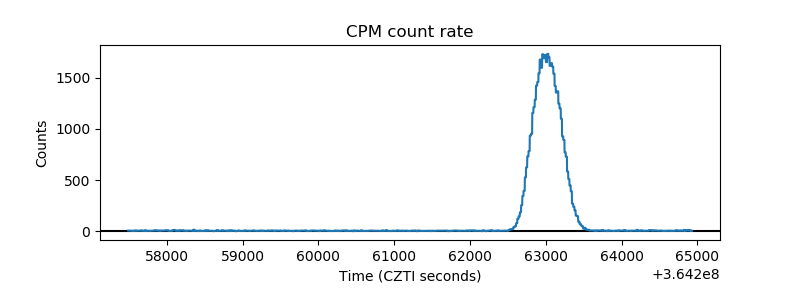 |
| CZT Counter | 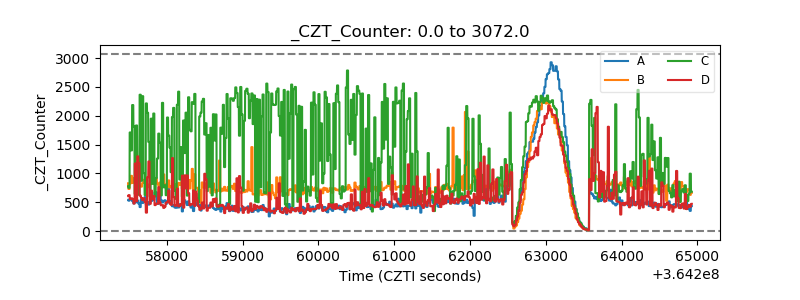 |
| +2.5 Volts monitor |  |
| +5 Volts monitor |  |
| _ROLL_ROT |  |
| _Roll_DEC | 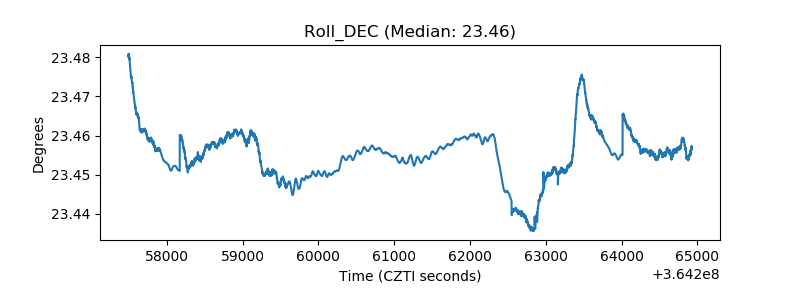 |
| _Roll_RA | 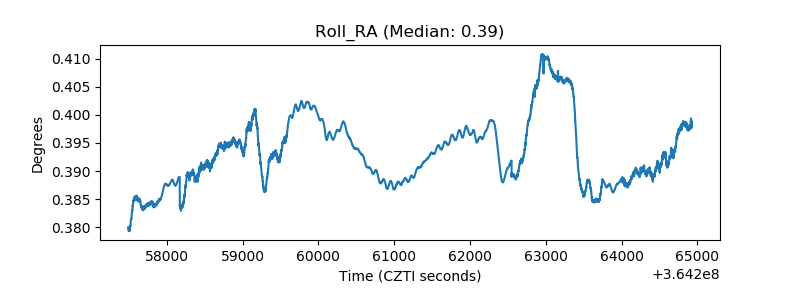 |
| Veto Counter | 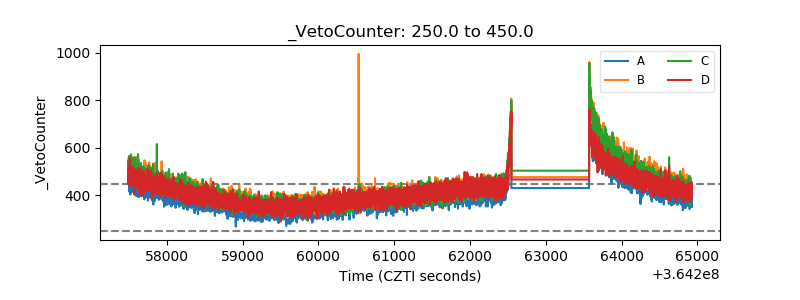 |