| Param | Original file | Final file |
|---|---|---|
| Filename | modeM0/AS1A10_064T05_9000004548_31379cztM0_level2.evt | modeM0/AS1A10_064T05_9000004548_31379cztM0_level2_quad_clean.evt |
| Size (bytes) | 577,221,120 | 94,740,480 |
| Size | 550.5 MB | 90.4 MB |
| Events in quadrant A | 3,109,338 | 626,388 |
| Events in quadrant B | 4,945,617 | 634,678 |
| Events in quadrant C | 5,464,619 | 569,859 |
| Events in quadrant D | 3,523,912 | 586,903 |
| Mode M9 | |||
|---|---|---|---|
| Quadrant | BADHDUFLAG | Total packets | Discarded packets |
| A | 0 | 19 | 0 |
| B | 0 | 20 | 0 |
| C | 0 | 20 | 0 |
| D | 0 | 20 | 0 |
| Mode M0 | |||
|---|---|---|---|
| Quadrant | BADHDUFLAG | Total packets | Discarded packets |
| A | 0 | 13399 | 2 |
| B | 0 | 19589 | 2 |
| C | 0 | 20679 | 7 |
| D | 0 | 14793 | 2 |
| Mode SS | |||
|---|---|---|---|
| Quadrant | BADHDUFLAG | Total packets | Discarded packets |
| A | 0 | 132 | 0 |
| B | 0 | 132 | 0 |
| C | 0 | 132 | 0 |
| D | 0 | 132 | 0 |
| Quadrant | Total seconds | Saturated seconds | Saturation percentage |
|---|---|---|---|
| A | 6465 | 15 | 0.232019% |
| B | 6465 | 65 | 1.005414% |
| C | 6464 | 640 | 9.900990% |
| D | 6464 | 50 | 0.773515% |
Noise dominated data is calculated using 1-second bins in cleaned event files. If a bin has >2000 counts, and if more than 50% of those come from <1% of pixels, then it is considered to be noise-dominated and hence unusable.
| Quadrant | # 1 sec bins | Bins with >0 counts | Bins with >2000 counts | High rate bins dominated by noise | Noise dominated (total time) | Noise dominated (detector-on time) | Marked lightcurve |
|---|---|---|---|---|---|---|---|
| A | 7620 | 6466 | 0 | 0 | 0.00% | 0.00% | 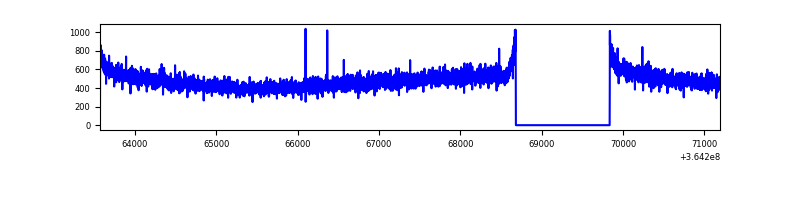 |
| B | 7620 | 6466 | 1 | 1 | 0.01% | 0.02% | 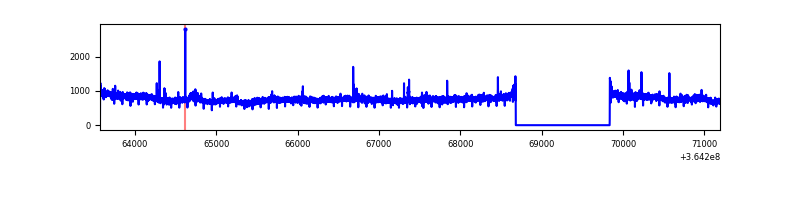 |
| C | 7619 | 6465 | 300 | 300 | 3.94% | 4.64% | 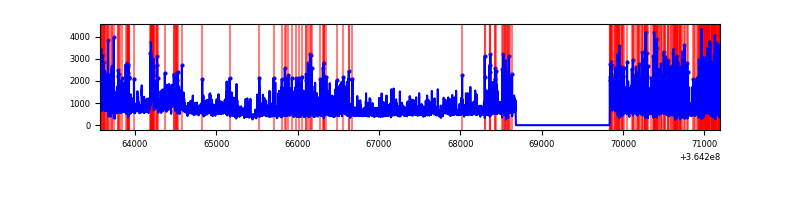 |
| D | 7619 | 6465 | 23 | 23 | 0.30% | 0.36% | 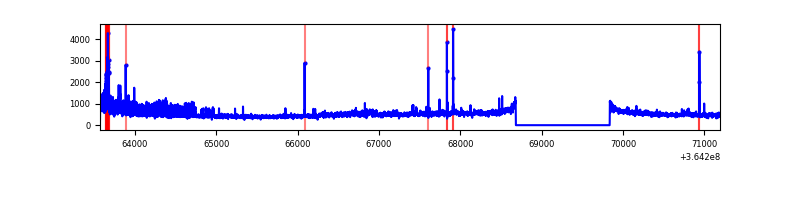 |
Top three noisy pixels from each quadrant. If the there are fewer than three noisy pixels in the level2.evt file, extra rows are filled as -1
| Pixel properties | Quadrant properties | ||||||
|---|---|---|---|---|---|---|---|
| Quadrant | DetID | PixID | Counts | Sigma | Mean | Median | Sigma |
| A | 13 | 254 | 11366 | 65.6 | 806 | 791 | 161.2 |
| A | 3 | 137 | 7716 | 42.96 | 806 | 791 | 161.2 |
| A | 0 | 226 | 6704 | 36.68 | 806 | 791 | 161.2 |
| B | 6 | 159 | 1720418 | 11378.45 | 802 | 782 | 151.1 |
| B | 0 | 190 | 25868 | 165.99 | 802 | 782 | 151.1 |
| B | 4 | 80 | 22530 | 143.9 | 802 | 782 | 151.1 |
| C | 3 | 233 | 2344476 | 13464.5 | 748 | 754 | 174.1 |
| C | 14 | 238 | 126930 | 724.87 | 748 | 754 | 174.1 |
| C | 0 | 10 | 47418 | 268.08 | 748 | 754 | 174.1 |
| D | 8 | 195 | 473844 | 2579.96 | 773 | 755 | 183.4 |
| D | 2 | 250 | 107543 | 582.36 | 773 | 755 | 183.4 |
| D | 2 | 234 | 25691 | 135.99 | 773 | 755 | 183.4 |
Histogram calculated using DETX and DETY for each event in the final _common_clean file
| Quadrant A |  |
 |
Quadrant B |
|---|---|---|---|
| Quadrant D |  |
 |
Quadrant C |
| Plot type | Count rate plots | Images |
|---|---|---|
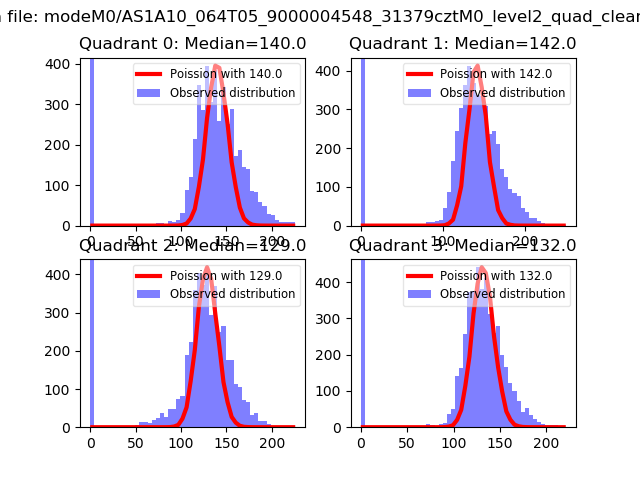
| Comparison with Poisson distribution Blue bars denote a histogram of data divided into 1 sec bins. Red curve is a Poisson curve with rate = median count rate of data. |
 |
 |
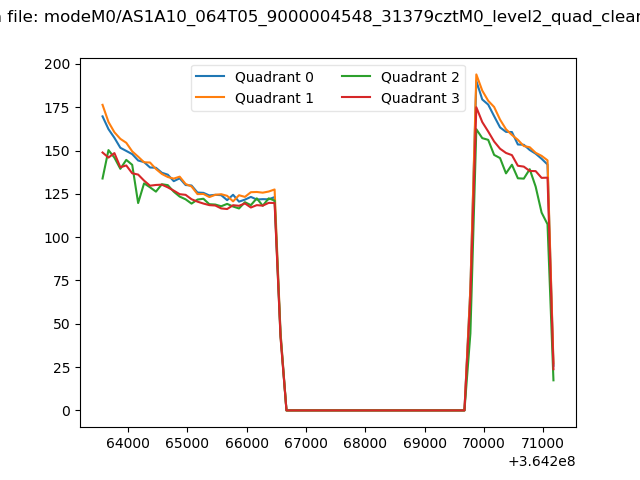
| Quadrant-wise count rates Data is divided into 100 sec bins |
 |
|
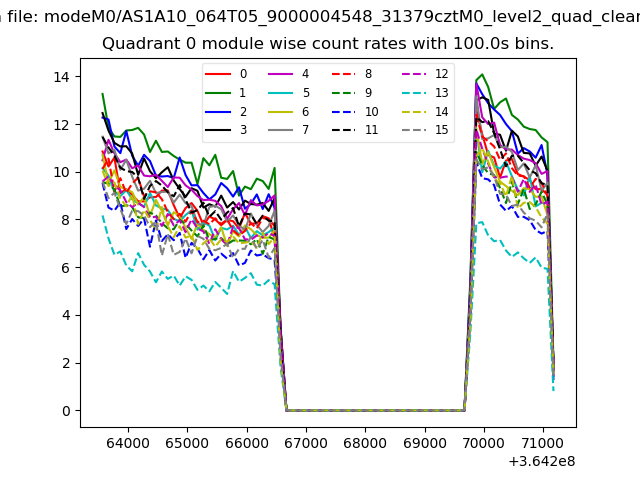
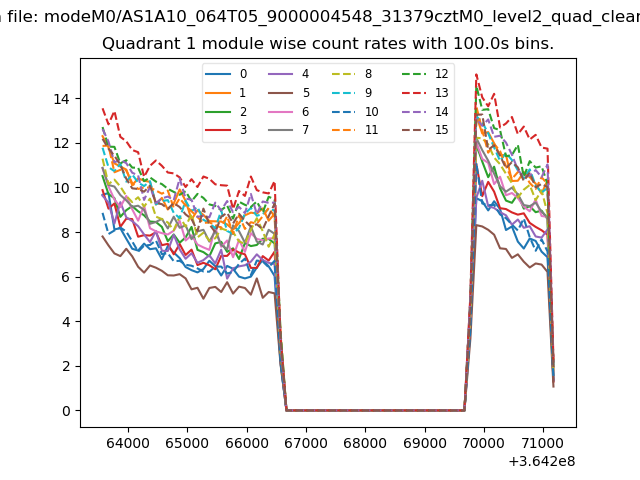
| Module-wise count rates for Quadrant A Data is divided into 100 sec bins |
 |
 |
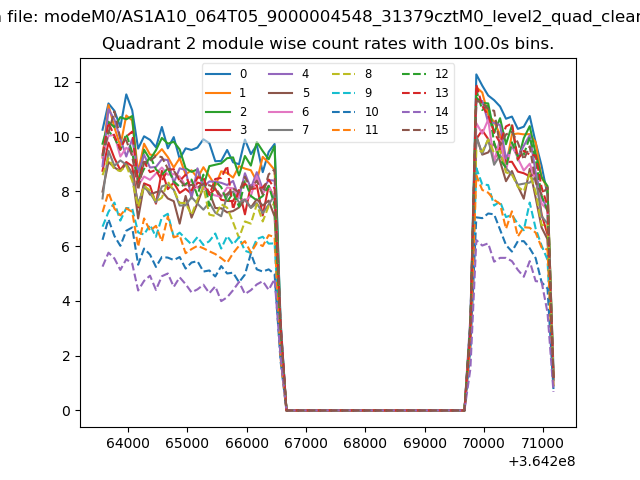
| Module-wise count rates for Quadrant B Data is divided into 100 sec bins |
 |
 |
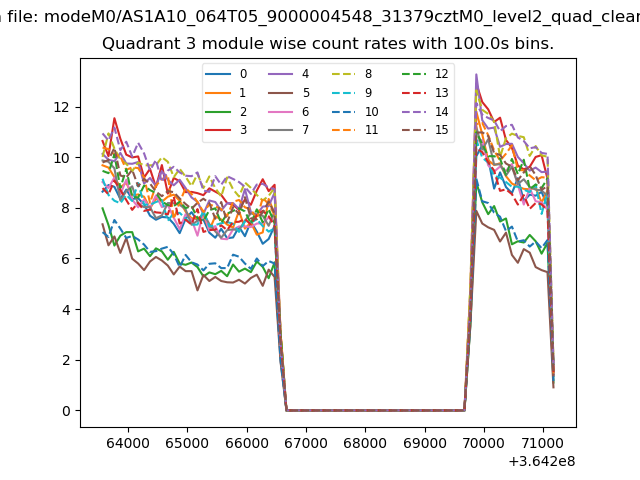
| Module-wise count rates for Quadrant C Data is divided into 100 sec bins |
 |
 |
| Module-wise count rates for Quadrant D Data is divided into 100 sec bins |
 |
 |
| Parameter | Plot |
|---|---|
| CZT HV Monitor | 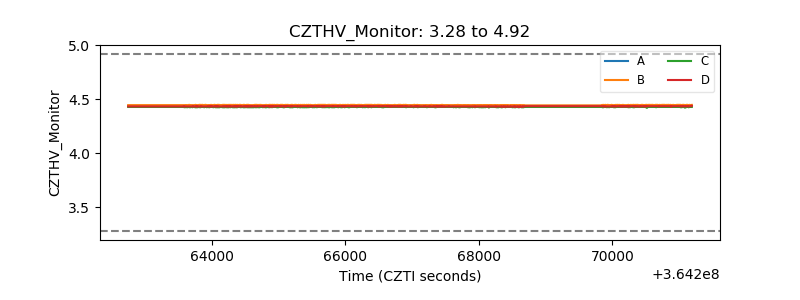 |
| D_VDD |  |
| Temperature 1 |  |
| Veto HV Monitor | 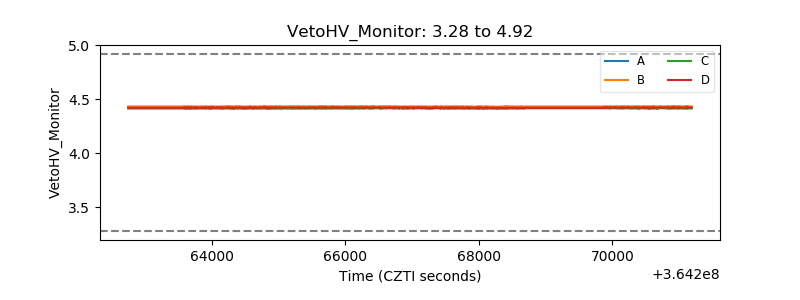 |
| Veto LLD | 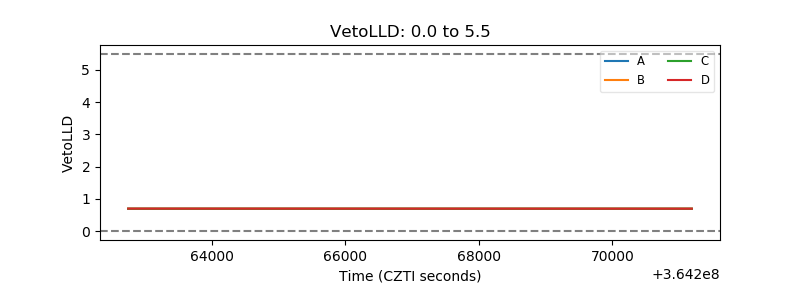 |
| Alpha Counter | 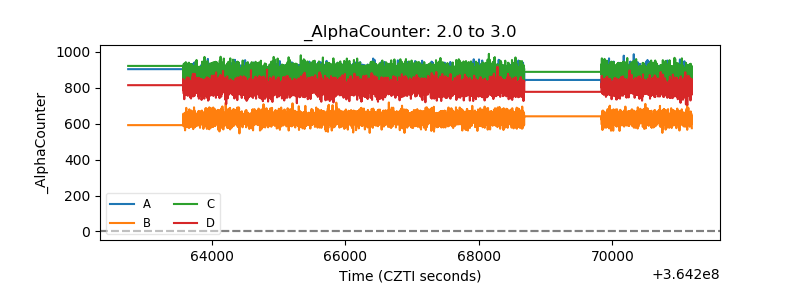 |
| _CPM_Rate | 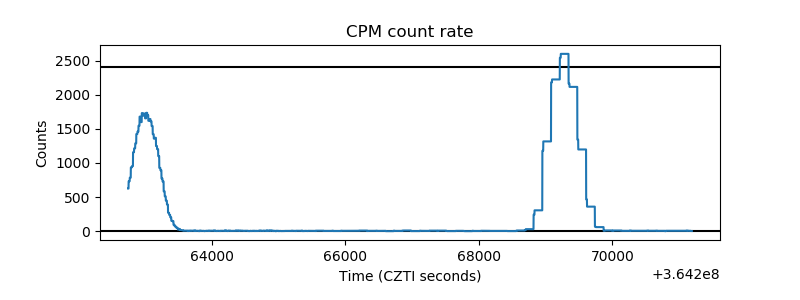 |
| CZT Counter | 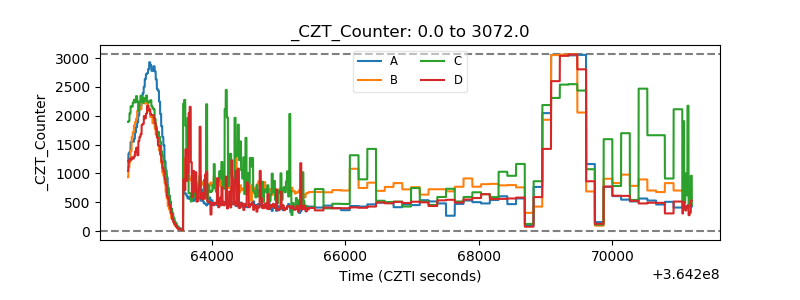 |
| +2.5 Volts monitor |  |
| +5 Volts monitor |  |
| _ROLL_ROT | 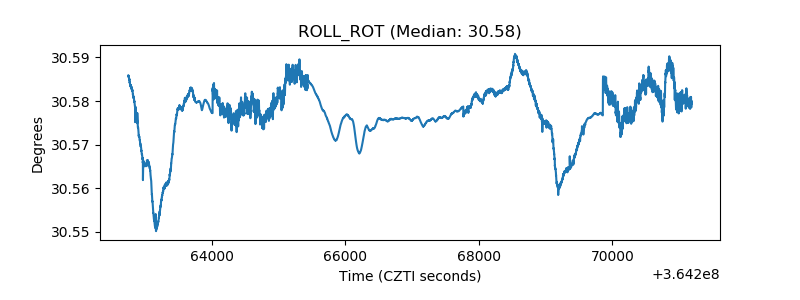 |
| _Roll_DEC | 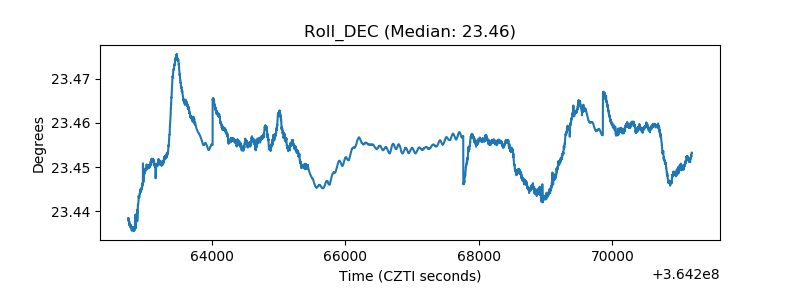 |
| _Roll_RA | 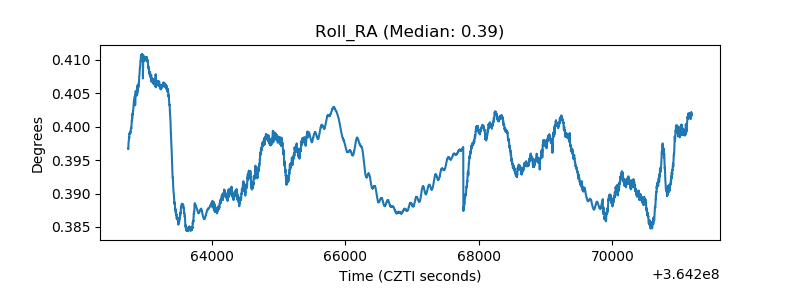 |
| Veto Counter | 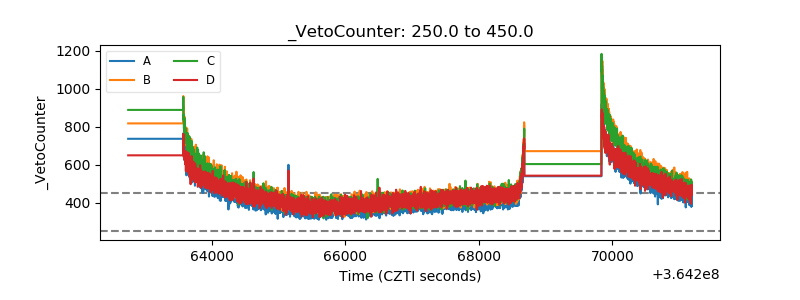 |