| Param | Original file | Final file |
|---|---|---|
| Filename | modeM0/AS1A10_064T05_9000004548_31383cztM0_level2.evt | modeM0/AS1A10_064T05_9000004548_31383cztM0_level2_quad_clean.evt |
| Size (bytes) | 1,903,432,320 | 265,907,520 |
| Size | 1.8 GB | 253.6 MB |
| Events in quadrant A | 10,569,122 | 1,745,220 |
| Events in quadrant B | 16,307,529 | 1,738,234 |
| Events in quadrant C | 17,725,555 | 1,530,288 |
| Events in quadrant D | 11,680,750 | 1,644,316 |
| Mode M9 | |||
|---|---|---|---|
| Quadrant | BADHDUFLAG | Total packets | Discarded packets |
| A | 0 | 53 | 0 |
| B | 0 | 53 | 0 |
| C | 0 | 53 | 0 |
| D | 0 | 53 | 0 |
| Mode M0 | |||
|---|---|---|---|
| Quadrant | BADHDUFLAG | Total packets | Discarded packets |
| A | 0 | 42929 | 4 |
| B | 0 | 62601 | 5 |
| C | 0 | 65399 | 4 |
| D | 0 | 47994 | 4 |
| Mode SS | |||
|---|---|---|---|
| Quadrant | BADHDUFLAG | Total packets | Discarded packets |
| A | 0 | 412 | 0 |
| B | 0 | 412 | 0 |
| C | 0 | 412 | 0 |
| D | 0 | 412 | 0 |
| Quadrant | Total seconds | Saturated seconds | Saturation percentage |
|---|---|---|---|
| A | 20259 | 207 | 1.021768% |
| B | 20258 | 482 | 2.379307% |
| C | 20258 | 3140 | 15.500049% |
| D | 20258 | 142 | 0.700958% |
Noise dominated data is calculated using 1-second bins in cleaned event files. If a bin has >2000 counts, and if more than 50% of those come from <1% of pixels, then it is considered to be noise-dominated and hence unusable.
| Quadrant | # 1 sec bins | Bins with >0 counts | Bins with >2000 counts | High rate bins dominated by noise | Noise dominated (total time) | Noise dominated (detector-on time) | Marked lightcurve |
|---|---|---|---|---|---|---|---|
| A | 25484 | 20263 | 1 | 1 | 0.00% | 0.00% | 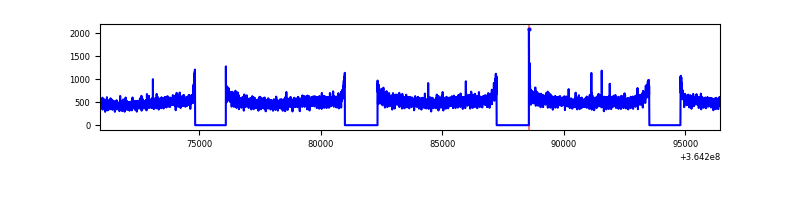 |
| B | 25483 | 20261 | 32 | 32 | 0.13% | 0.16% | 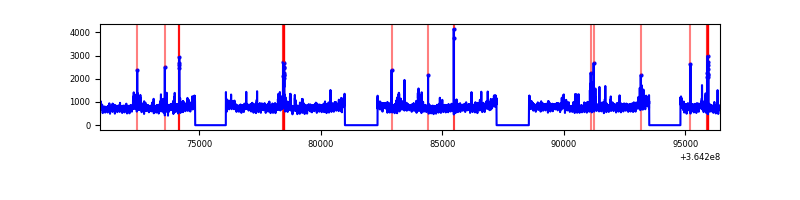 |
| C | 25483 | 20260 | 1742 | 1742 | 6.84% | 8.60% | 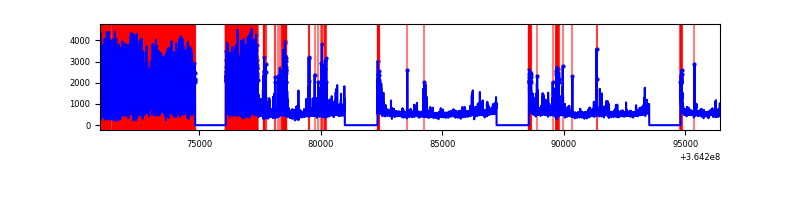 |
| D | 25483 | 20262 | 35 | 35 | 0.14% | 0.17% | 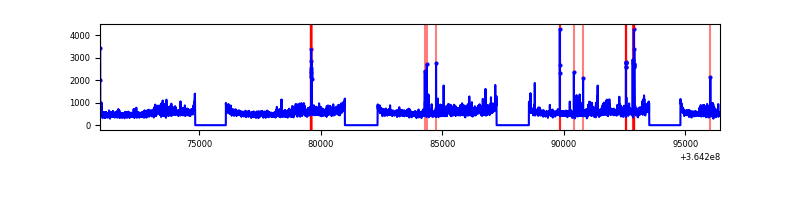 |
Top three noisy pixels from each quadrant. If the there are fewer than three noisy pixels in the level2.evt file, extra rows are filled as -1
| Pixel properties | Quadrant properties | ||||||
|---|---|---|---|---|---|---|---|
| Quadrant | DetID | PixID | Counts | Sigma | Mean | Median | Sigma |
| A | 13 | 254 | 36157 | 62.23 | 2738 | 2696 | 537.7 |
| A | 3 | 137 | 25754 | 42.88 | 2738 | 2696 | 537.7 |
| A | 0 | 226 | 23446 | 38.59 | 2738 | 2696 | 537.7 |
| B | 6 | 159 | 5265602 | 10617.75 | 2667 | 2609 | 495.7 |
| B | 0 | 190 | 252984 | 505.12 | 2667 | 2609 | 495.7 |
| B | 4 | 80 | 238531 | 475.96 | 2667 | 2609 | 495.7 |
| C | 3 | 233 | 7345383 | 13187.05 | 2422 | 2441 | 556.8 |
| C | 14 | 238 | 459821 | 821.4 | 2422 | 2441 | 556.8 |
| C | 0 | 10 | 243141 | 432.27 | 2422 | 2441 | 556.8 |
| D | 8 | 195 | 1651094 | 2424.38 | 2590 | 2551 | 680.0 |
| D | 2 | 250 | 90707 | 129.64 | 2590 | 2551 | 680.0 |
| D | 2 | 234 | 81666 | 116.35 | 2590 | 2551 | 680.0 |
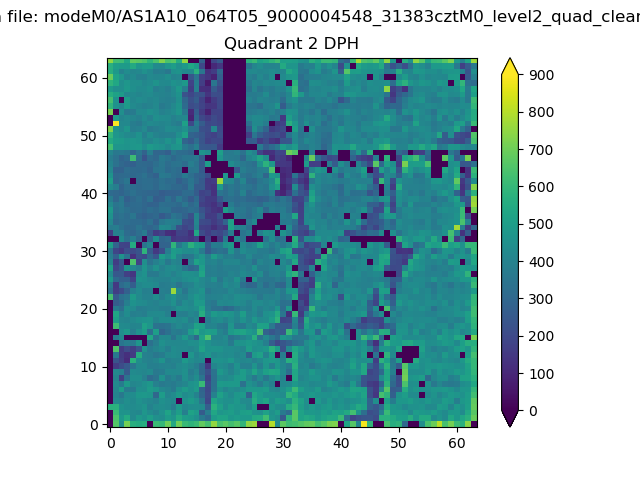
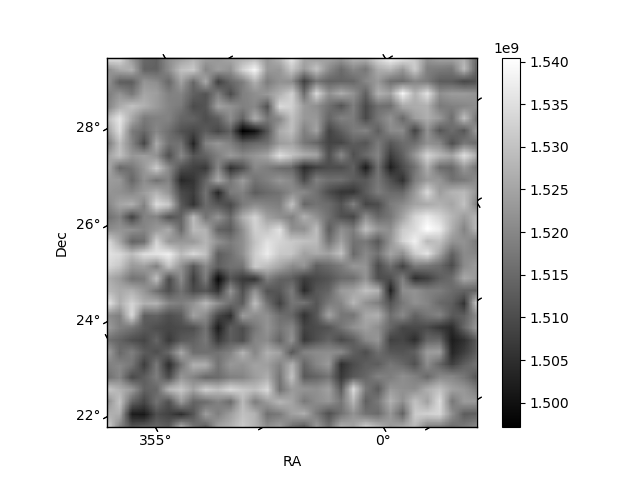
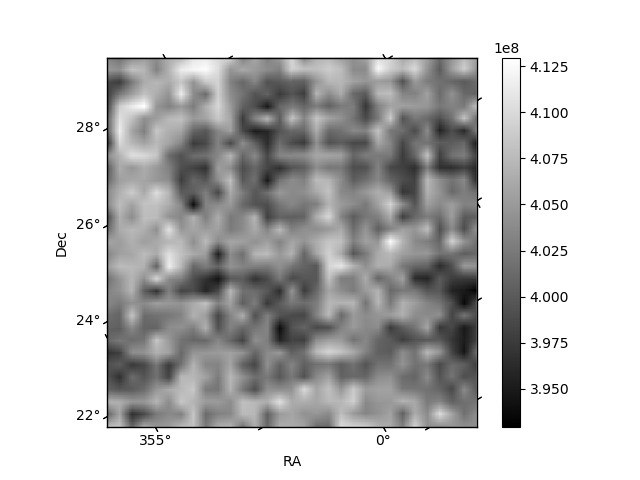
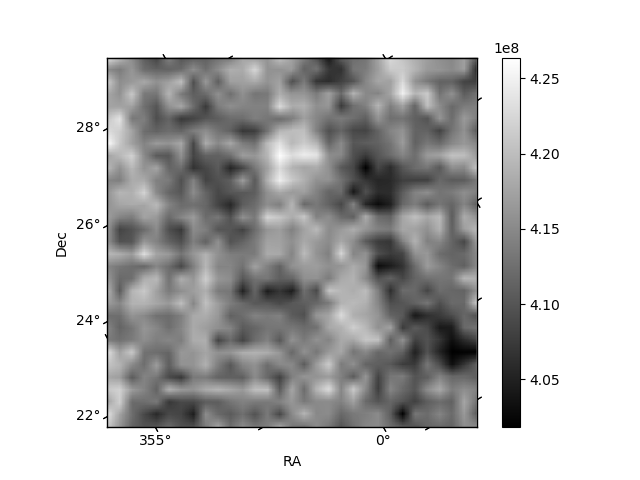
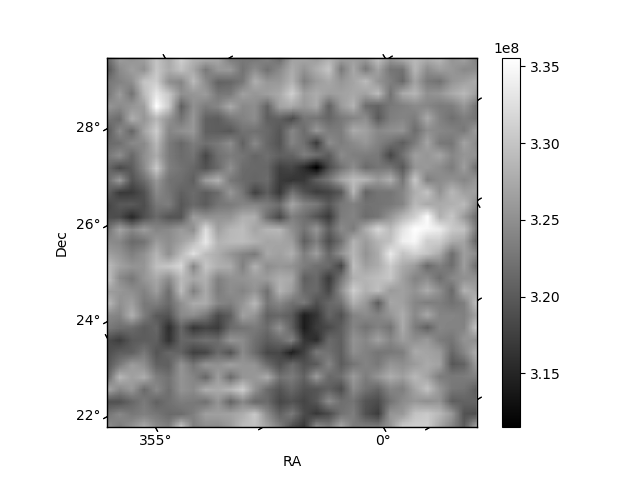
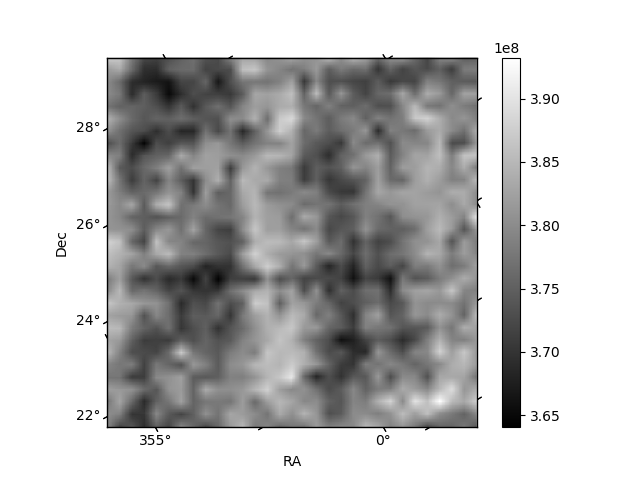
Histogram calculated using DETX and DETY for each event in the final _common_clean file
| Quadrant A | 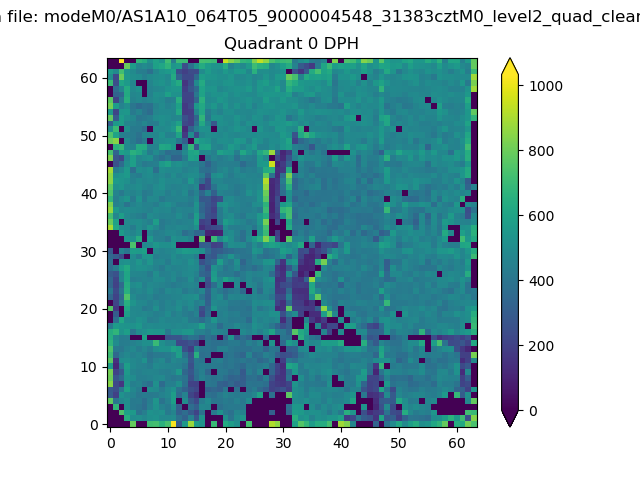 |
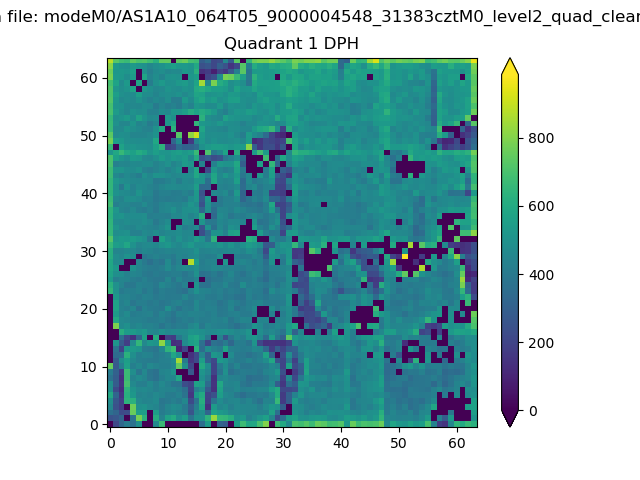 |
Quadrant B |
|---|---|---|---|
| Quadrant D | 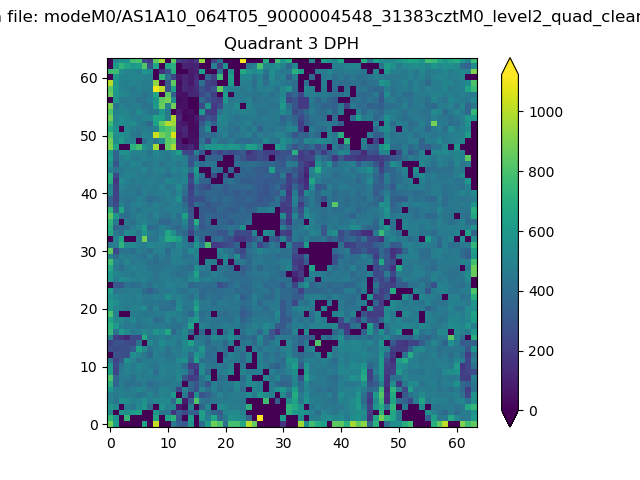 |
 |
Quadrant C |
| Plot type | Count rate plots | Images |
|---|---|---|
| Comparison with Poisson distribution Blue bars denote a histogram of data divided into 1 sec bins. Red curve is a Poisson curve with rate = median count rate of data. |
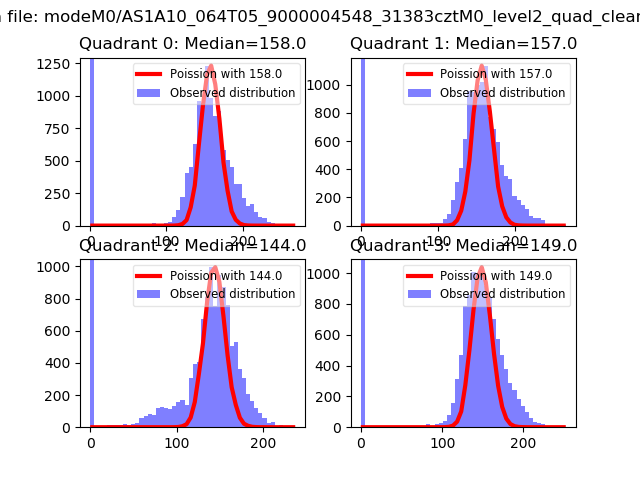 |
 |
| Quadrant-wise count rates Data is divided into 100 sec bins |
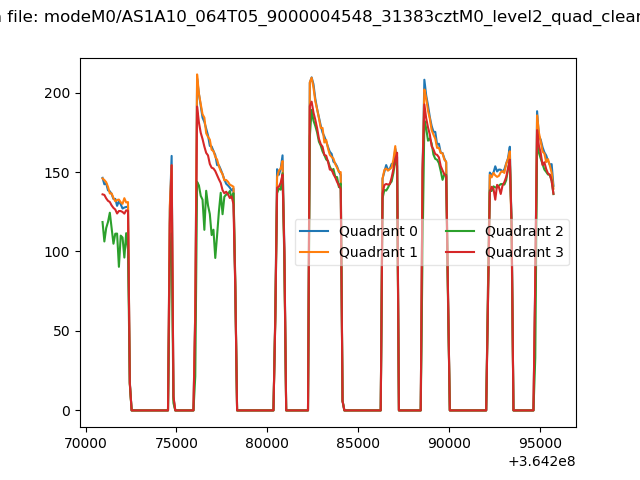 |
|
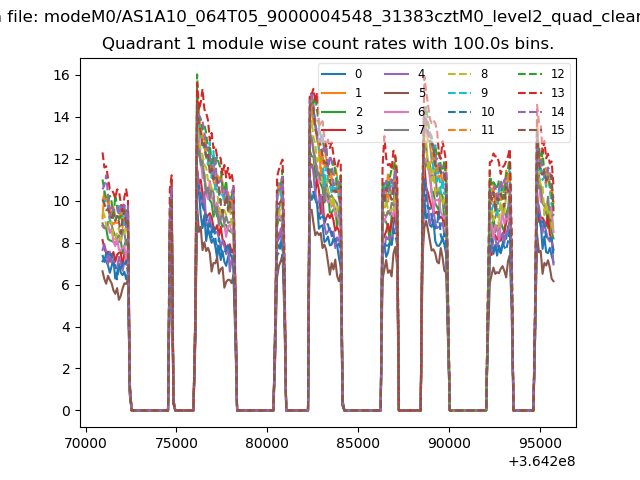
| Module-wise count rates for Quadrant A Data is divided into 100 sec bins |
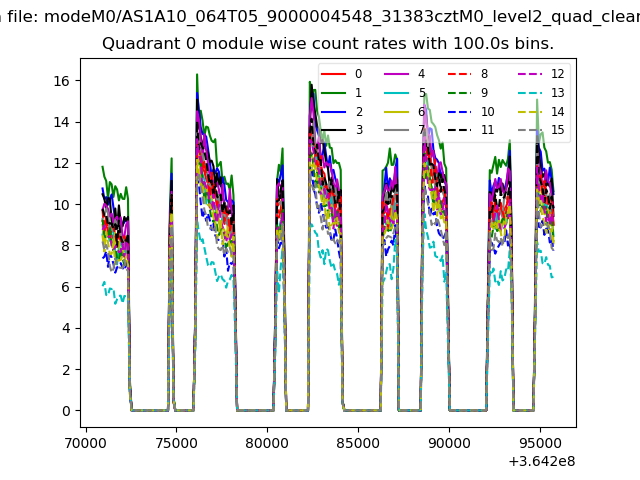 |
 |
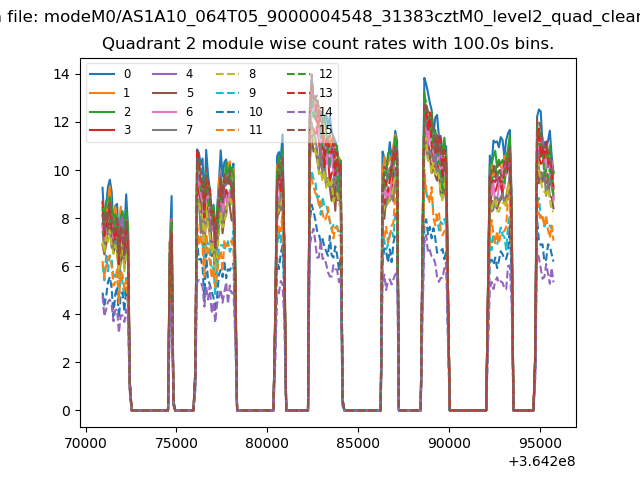
| Module-wise count rates for Quadrant B Data is divided into 100 sec bins |
 |
 |
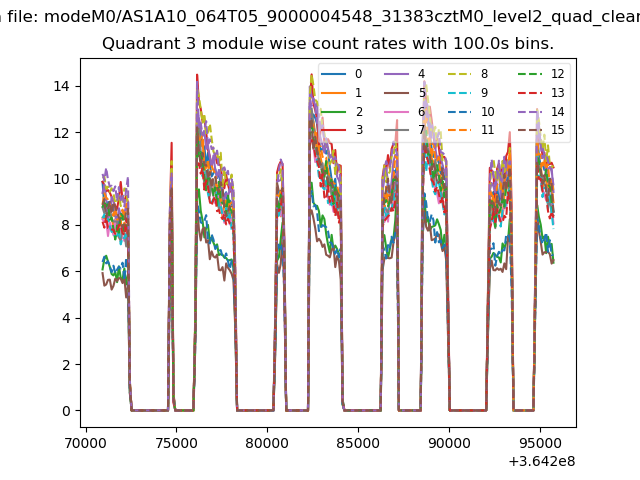
| Module-wise count rates for Quadrant C Data is divided into 100 sec bins |
 |
 |
| Module-wise count rates for Quadrant D Data is divided into 100 sec bins |
 |
 |
| Parameter | Plot |
|---|---|
| CZT HV Monitor | 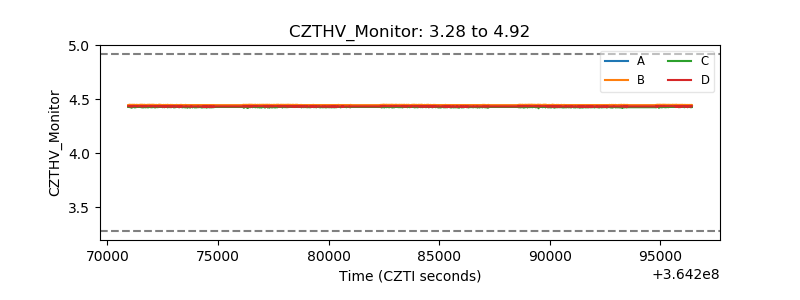 |
| D_VDD | 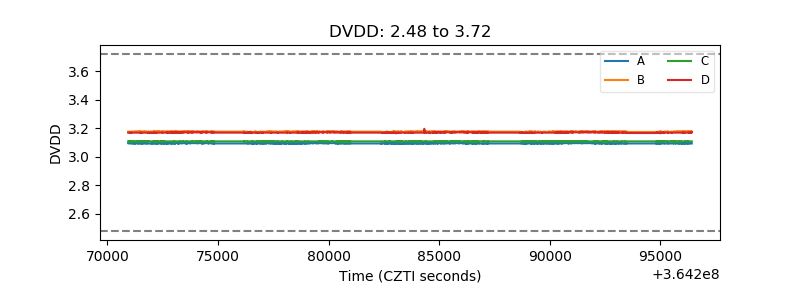 |
| Temperature 1 | 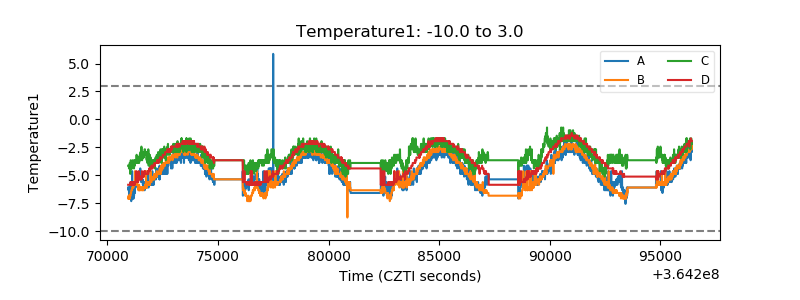 |
| Veto HV Monitor |  |
| Veto LLD | 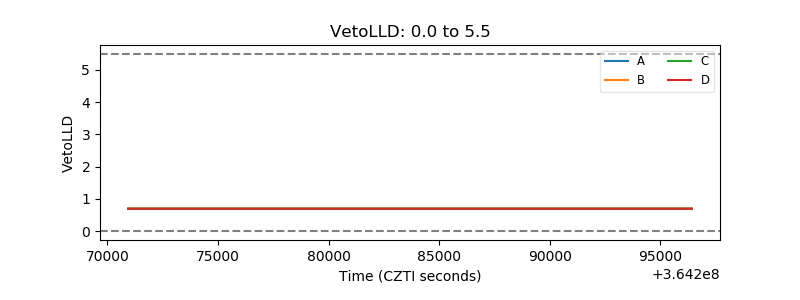 |
| Alpha Counter | 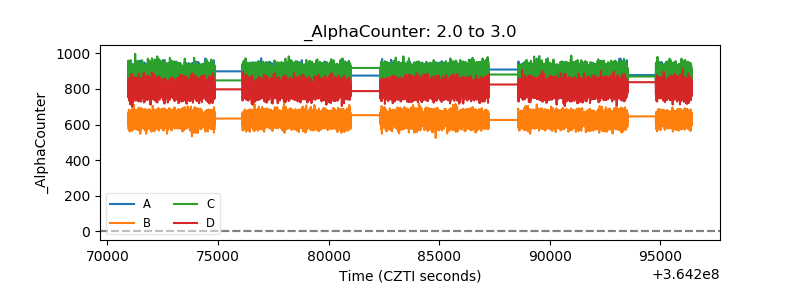 |
| _CPM_Rate | 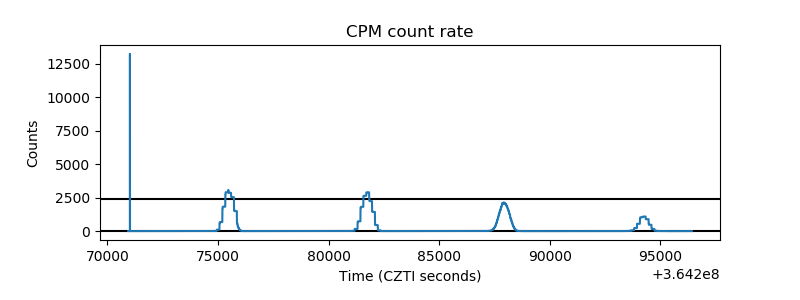 |
| CZT Counter | 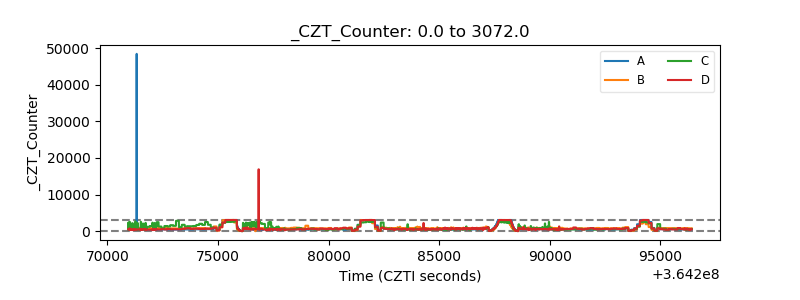 |
| +2.5 Volts monitor |  |
| +5 Volts monitor |  |
| _ROLL_ROT | 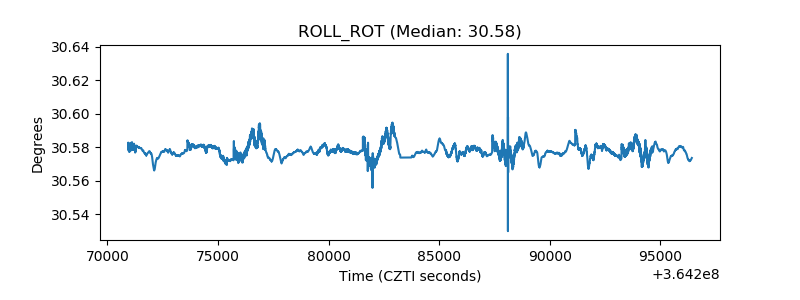 |
| _Roll_DEC |  |
| _Roll_RA | 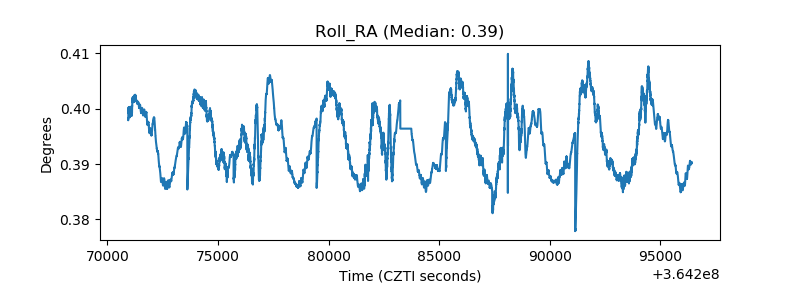 |
| Veto Counter | 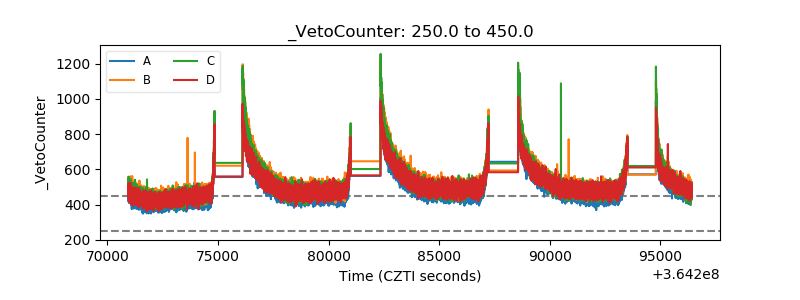 |