| Param | Original file | Final file |
|---|---|---|
| Filename | modeM0/AS1A10_064T05_9000004548_31384cztM0_level2.evt | modeM0/AS1A10_064T05_9000004548_31384cztM0_level2_quad_clean.evt |
| Size (bytes) | 535,397,760 | 78,923,520 |
| Size | 510.6 MB | 75.3 MB |
| Events in quadrant A | 3,339,859 | 500,589 |
| Events in quadrant B | 5,251,261 | 491,789 |
| Events in quadrant C | 3,589,861 | 468,685 |
| Events in quadrant D | 3,589,287 | 471,333 |
| Mode M9 | |||
|---|---|---|---|
| Quadrant | BADHDUFLAG | Total packets | Discarded packets |
| A | 0 | 10 | 0 |
| B | 0 | 10 | 0 |
| C | 0 | 10 | 0 |
| D | 0 | 10 | 0 |
| Mode M0 | |||
|---|---|---|---|
| Quadrant | BADHDUFLAG | Total packets | Discarded packets |
| A | 0 | 13567 | 1 |
| B | 0 | 20237 | 1 |
| C | 0 | 14368 | 1 |
| D | 0 | 14572 | 1 |
| Mode SS | |||
|---|---|---|---|
| Quadrant | BADHDUFLAG | Total packets | Discarded packets |
| A | 0 | 134 | 0 |
| B | 0 | 134 | 0 |
| C | 0 | 134 | 0 |
| D | 0 | 134 | 0 |
| Quadrant | Total seconds | Saturated seconds | Saturation percentage |
|---|---|---|---|
| A | 6553 | 99 | 1.510758% |
| B | 6554 | 186 | 2.837962% |
| C | 6554 | 187 | 2.853219% |
| D | 6554 | 84 | 1.281660% |
Noise dominated data is calculated using 1-second bins in cleaned event files. If a bin has >2000 counts, and if more than 50% of those come from <1% of pixels, then it is considered to be noise-dominated and hence unusable.
| Quadrant | # 1 sec bins | Bins with >0 counts | Bins with >2000 counts | High rate bins dominated by noise | Noise dominated (total time) | Noise dominated (detector-on time) | Marked lightcurve |
|---|---|---|---|---|---|---|---|
| A | 7603 | 6554 | 0 | 0 | 0.00% | 0.00% | 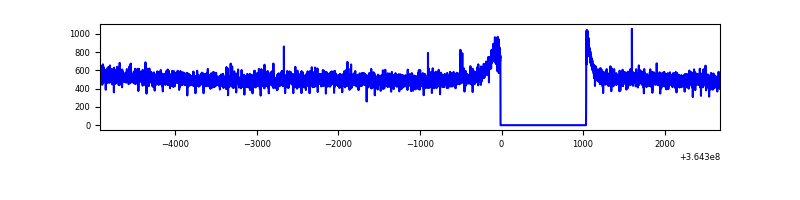 |
| B | 7604 | 6554 | 15 | 15 | 0.20% | 0.23% | 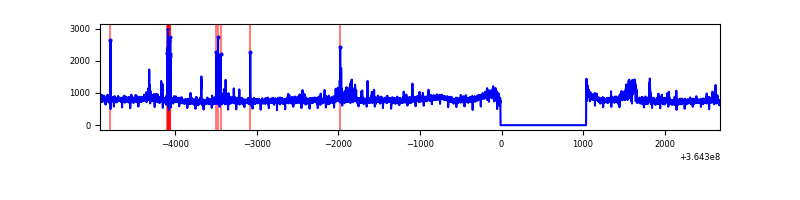 |
| C | 7604 | 6555 | 24 | 24 | 0.32% | 0.37% |  |
| D | 7604 | 6554 | 5 | 5 | 0.07% | 0.08% | 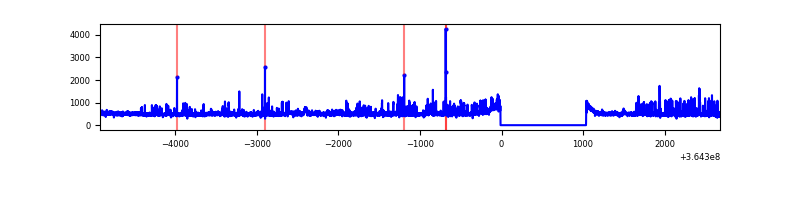 |
Top three noisy pixels from each quadrant. If the there are fewer than three noisy pixels in the level2.evt file, extra rows are filled as -1
| Pixel properties | Quadrant properties | ||||||
|---|---|---|---|---|---|---|---|
| Quadrant | DetID | PixID | Counts | Sigma | Mean | Median | Sigma |
| A | 13 | 254 | 11855 | 63.5 | 865 | 848 | 173.3 |
| A | 3 | 137 | 8535 | 44.35 | 865 | 848 | 173.3 |
| A | 0 | 226 | 7327 | 37.38 | 865 | 848 | 173.3 |
| B | 6 | 159 | 1725327 | 10681.82 | 841 | 819 | 161.4 |
| B | 0 | 190 | 124614 | 766.8 | 841 | 819 | 161.4 |
| B | 4 | 80 | 83158 | 510.02 | 841 | 819 | 161.4 |
| C | 3 | 233 | 212348 | 1132.76 | 803 | 810 | 186.7 |
| C | 14 | 238 | 133732 | 711.78 | 803 | 810 | 186.7 |
| C | 0 | 10 | 89846 | 476.78 | 803 | 810 | 186.7 |
| D | 8 | 195 | 338904 | 1720.53 | 830 | 810 | 196.5 |
| D | 10 | 203 | 48480 | 242.59 | 830 | 810 | 196.5 |
| D | 2 | 250 | 47664 | 238.44 | 830 | 810 | 196.5 |
Histogram calculated using DETX and DETY for each event in the final _common_clean file
| Quadrant A |  |
 |
Quadrant B |
|---|---|---|---|
| Quadrant D |  |
 |
Quadrant C |
| Plot type | Count rate plots | Images |
|---|---|---|
| Comparison with Poisson distribution Blue bars denote a histogram of data divided into 1 sec bins. Red curve is a Poisson curve with rate = median count rate of data. |
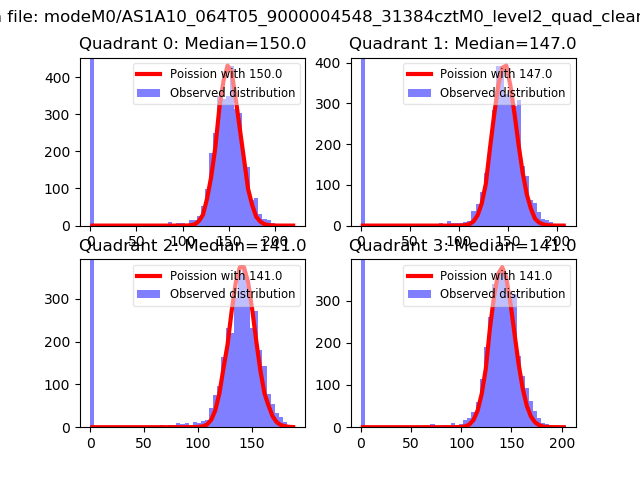 |
 |
| Quadrant-wise count rates Data is divided into 100 sec bins |
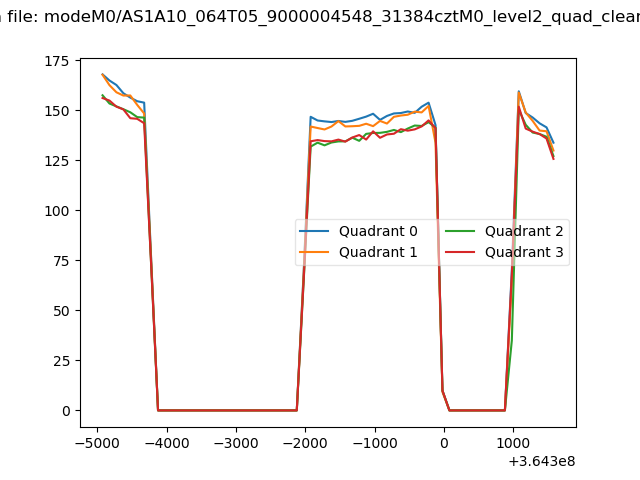 |
|
| Module-wise count rates for Quadrant A Data is divided into 100 sec bins |
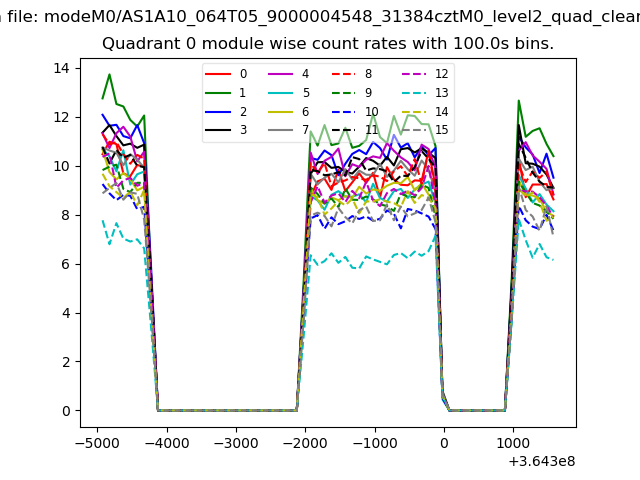 |
 |
| Module-wise count rates for Quadrant B Data is divided into 100 sec bins |
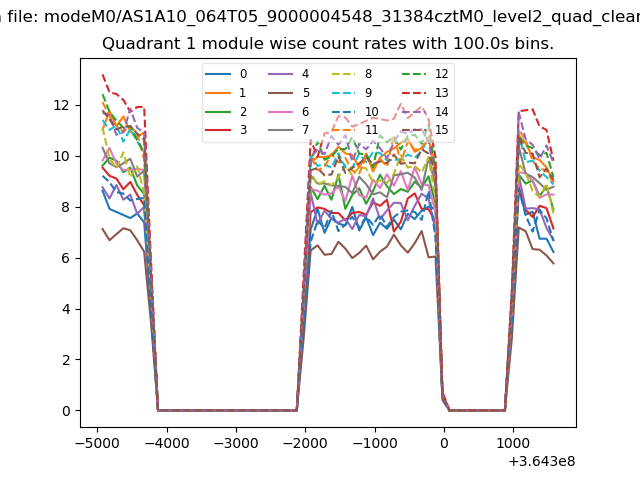 |
 |
| Module-wise count rates for Quadrant C Data is divided into 100 sec bins |
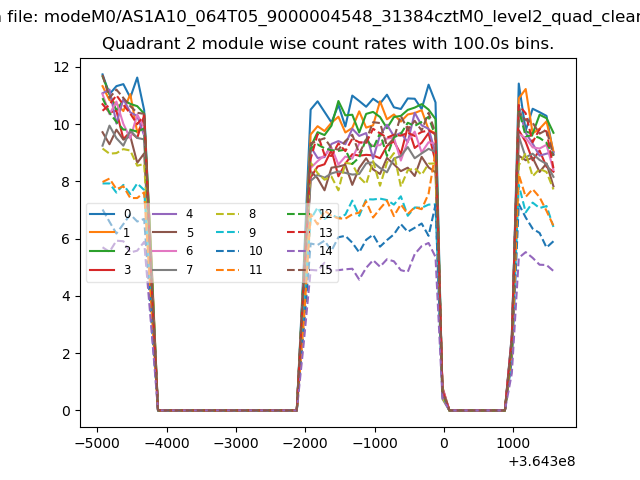 |
 |
| Module-wise count rates for Quadrant D Data is divided into 100 sec bins |
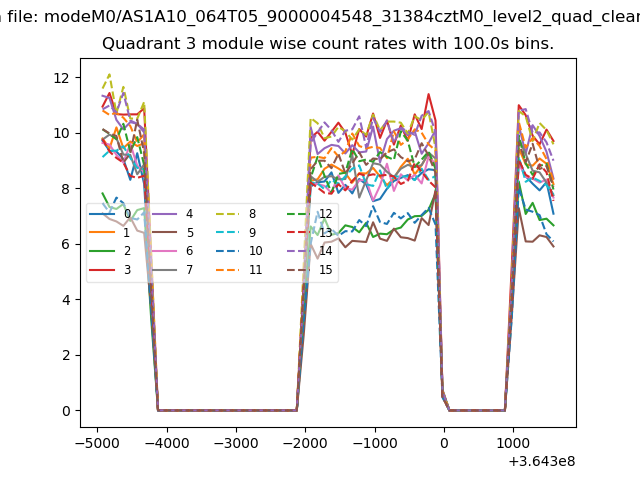 |
 |
| Parameter | Plot |
|---|---|
| CZT HV Monitor | 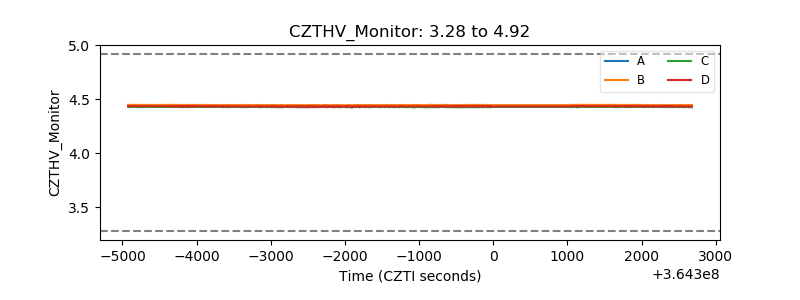 |
| D_VDD |  |
| Temperature 1 |  |
| Veto HV Monitor |  |
| Veto LLD |  |
| Alpha Counter | 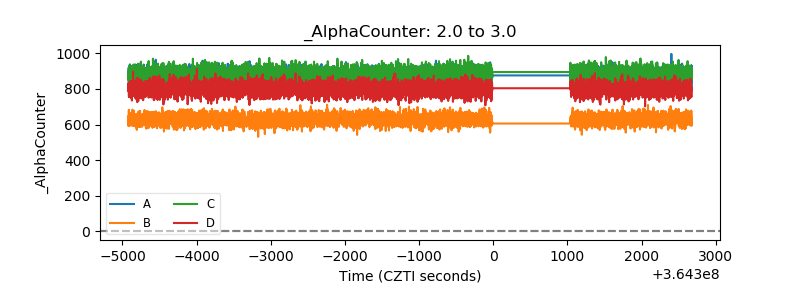 |
| _CPM_Rate | 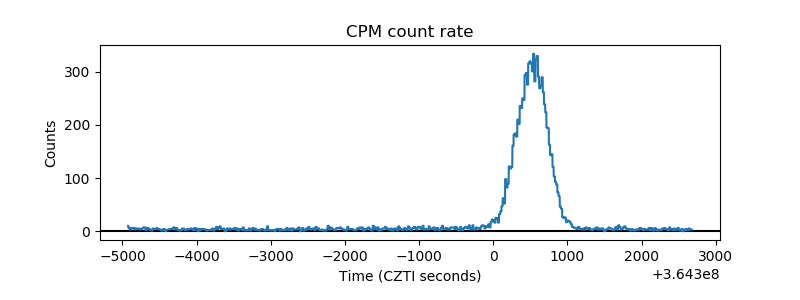 |
| CZT Counter |  |
| +2.5 Volts monitor |  |
| +5 Volts monitor |  |
| _ROLL_ROT |  |
| _Roll_DEC |  |
| _Roll_RA |  |
| Veto Counter |  |