| Param | Original file | Final file |
|---|---|---|
| Filename | modeM0/AS1A10_064T05_9000004548_31385cztM0_level2.evt | modeM0/AS1A10_064T05_9000004548_31385cztM0_level2_quad_clean.evt |
| Size (bytes) | 275,857,920 | 31,795,200 |
| Size | 263.1 MB | 30.3 MB |
| Events in quadrant A | 1,715,262 | 184,088 |
| Events in quadrant B | 2,707,660 | 181,721 |
| Events in quadrant C | 1,749,034 | 173,092 |
| Events in quadrant D | 1,942,860 | 174,659 |
| Mode M0 | |||
|---|---|---|---|
| Quadrant | BADHDUFLAG | Total packets | Discarded packets |
| A | 0 | 7155 | 0 |
| B | 0 | 10704 | 0 |
| C | 0 | 7246 | 0 |
| D | 0 | 7989 | 0 |
| Mode SS | |||
|---|---|---|---|
| Quadrant | BADHDUFLAG | Total packets | Discarded packets |
| A | 0 | 70 | 0 |
| B | 0 | 70 | 0 |
| C | 0 | 70 | 0 |
| D | 0 | 70 | 0 |
| Quadrant | Total seconds | Saturated seconds | Saturation percentage |
|---|---|---|---|
| A | 3508 | 8 | 0.228050% |
| B | 3508 | 17 | 0.484607% |
| C | 3508 | 44 | 1.254276% |
| D | 3508 | 3 | 0.085519% |
Noise dominated data is calculated using 1-second bins in cleaned event files. If a bin has >2000 counts, and if more than 50% of those come from <1% of pixels, then it is considered to be noise-dominated and hence unusable.
| Quadrant | # 1 sec bins | Bins with >0 counts | Bins with >2000 counts | High rate bins dominated by noise | Noise dominated (total time) | Noise dominated (detector-on time) | Marked lightcurve |
|---|---|---|---|---|---|---|---|
| A | 3508 | 3508 | 5 | 5 | 0.14% | 0.14% | 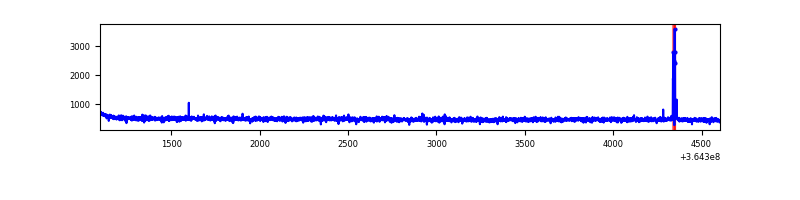 |
| B | 3508 | 3508 | 0 | 0 | 0.00% | 0.00% | 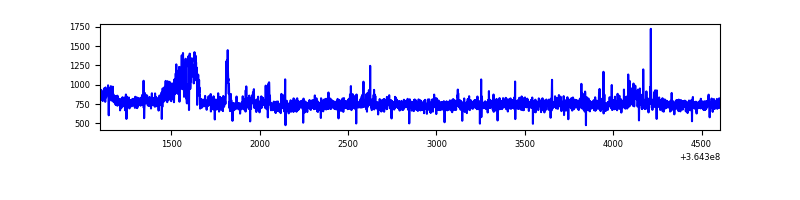 |
| C | 3508 | 3508 | 1 | 1 | 0.03% | 0.03% | 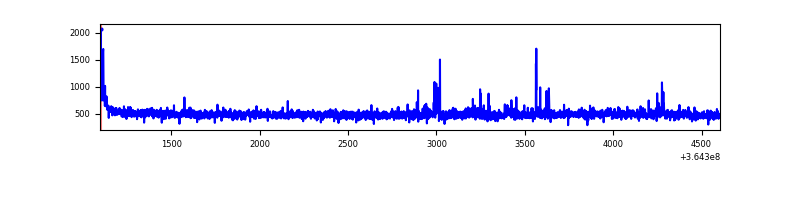 |
| D | 3508 | 3508 | 3 | 3 | 0.09% | 0.09% | 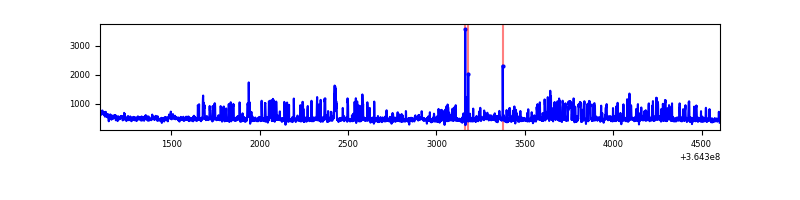 |
Top three noisy pixels from each quadrant. If the there are fewer than three noisy pixels in the level2.evt file, extra rows are filled as -1
| Pixel properties | Quadrant properties | ||||||
|---|---|---|---|---|---|---|---|
| Quadrant | DetID | PixID | Counts | Sigma | Mean | Median | Sigma |
| A | 13 | 170 | 20774 | 228.27 | 438 | 431 | 89.1 |
| A | 13 | 254 | 6625 | 69.5 | 438 | 431 | 89.1 |
| A | 3 | 137 | 4308 | 43.5 | 438 | 431 | 89.1 |
| B | 6 | 159 | 913542 | 10973.81 | 428 | 419 | 83.2 |
| B | 0 | 190 | 78157 | 934.25 | 428 | 419 | 83.2 |
| B | 4 | 80 | 27586 | 326.49 | 428 | 419 | 83.2 |
| C | 14 | 238 | 78117 | 804.87 | 409 | 411 | 96.5 |
| C | 0 | 10 | 45346 | 465.43 | 409 | 411 | 96.5 |
| C | 14 | 254 | 14829 | 149.34 | 409 | 411 | 96.5 |
| D | 8 | 195 | 268524 | 2651.49 | 421 | 410 | 101.1 |
| D | 10 | 203 | 33250 | 324.77 | 421 | 410 | 101.1 |
| D | 2 | 250 | 23397 | 227.33 | 421 | 410 | 101.1 |
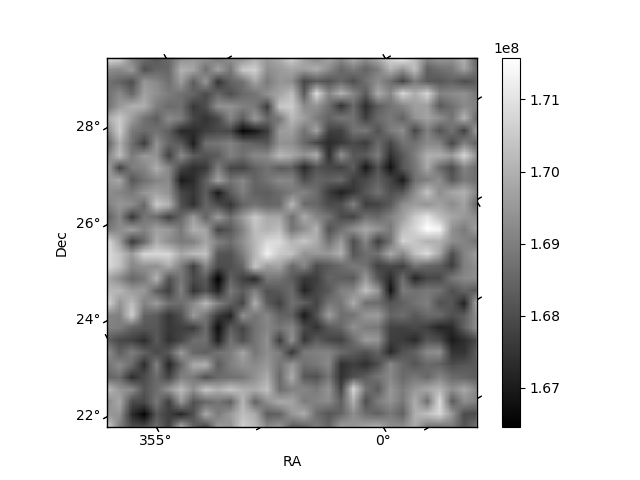
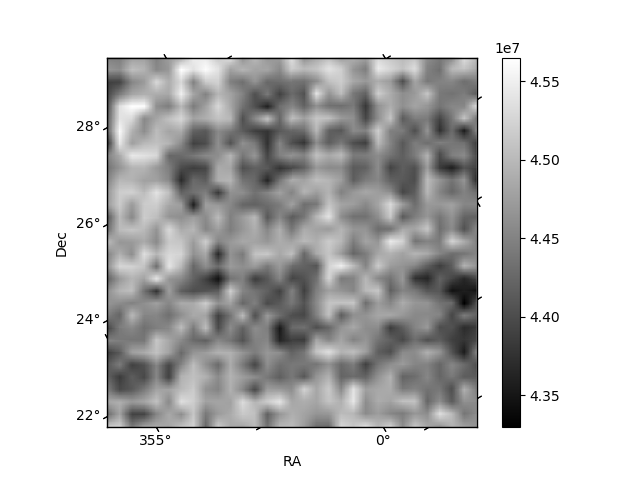
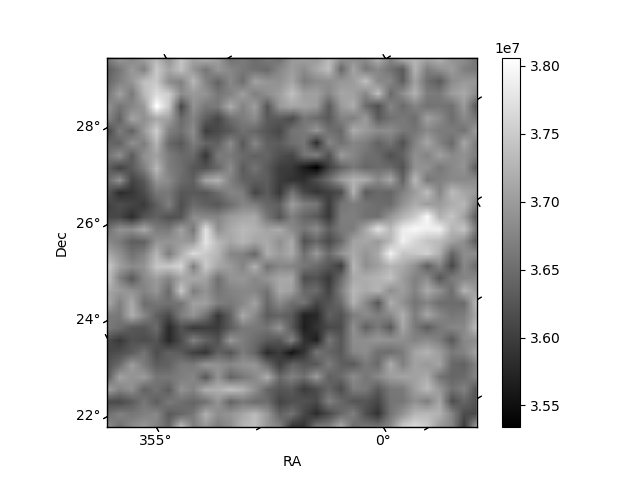
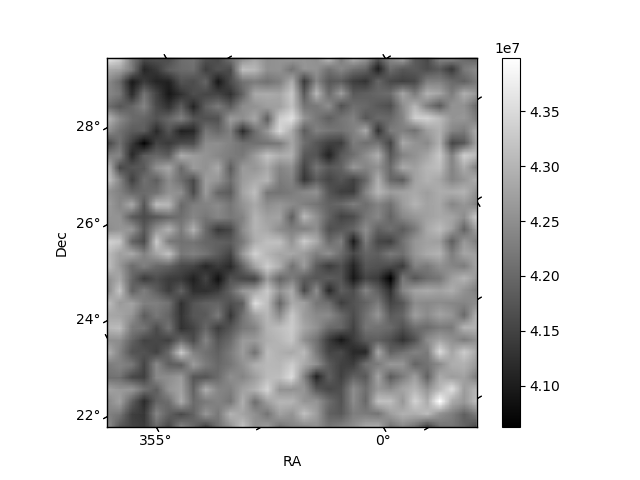
Histogram calculated using DETX and DETY for each event in the final _common_clean file
| Quadrant A | 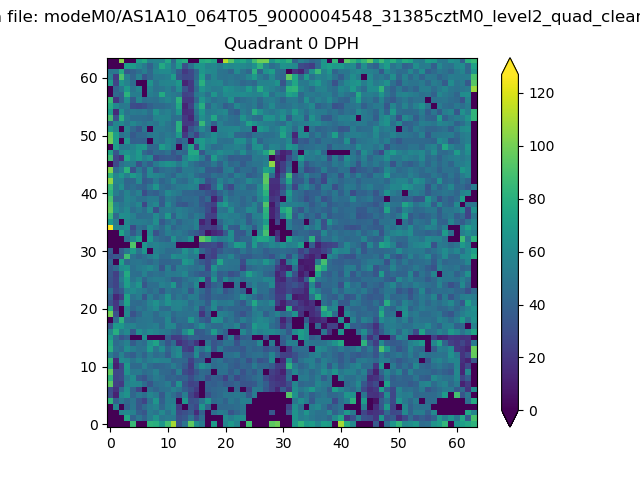 |
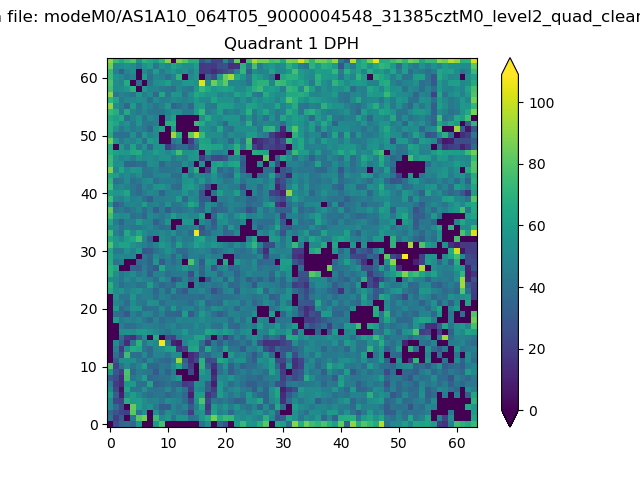 |
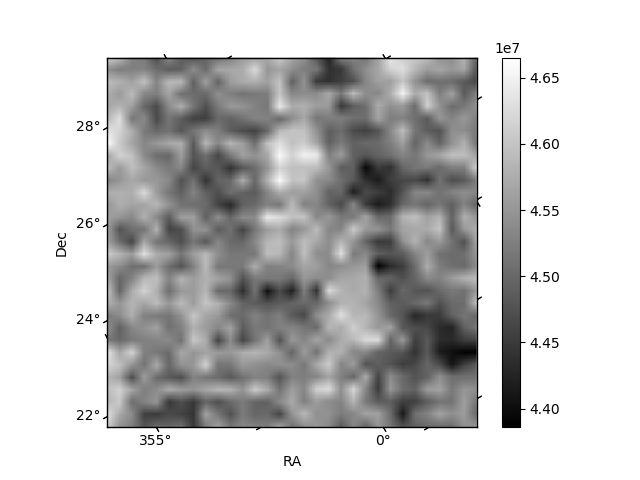
Quadrant B |
|---|---|---|---|
| Quadrant D | 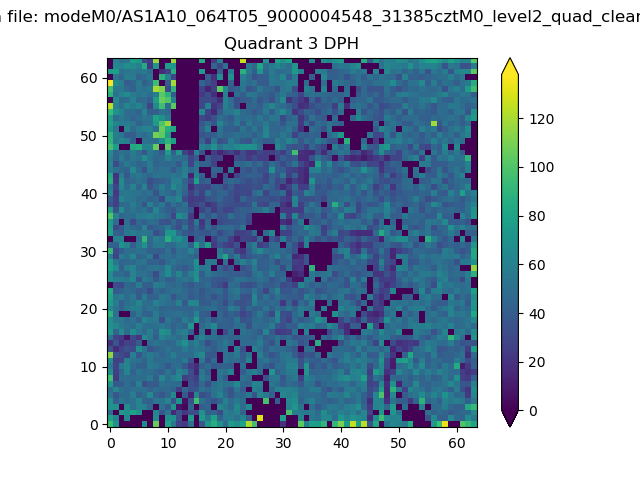 |
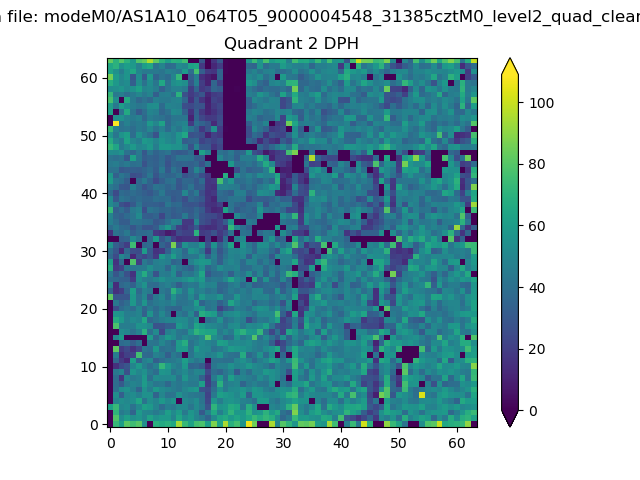 |
Quadrant C |
| Plot type | Count rate plots | Images |
|---|---|---|
| Comparison with Poisson distribution Blue bars denote a histogram of data divided into 1 sec bins. Red curve is a Poisson curve with rate = median count rate of data. |
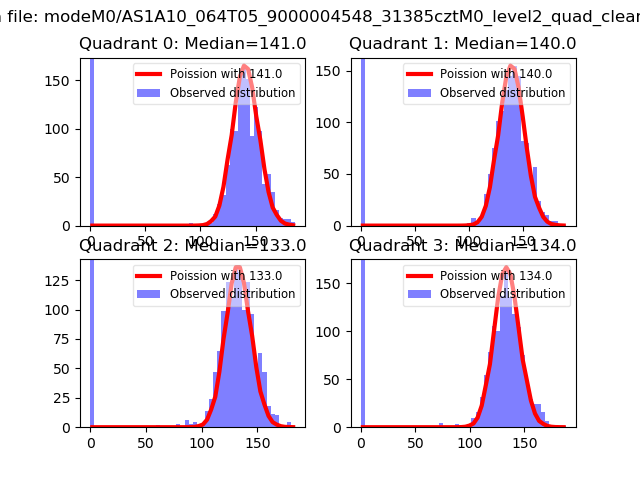 |
 |
| Quadrant-wise count rates Data is divided into 100 sec bins |
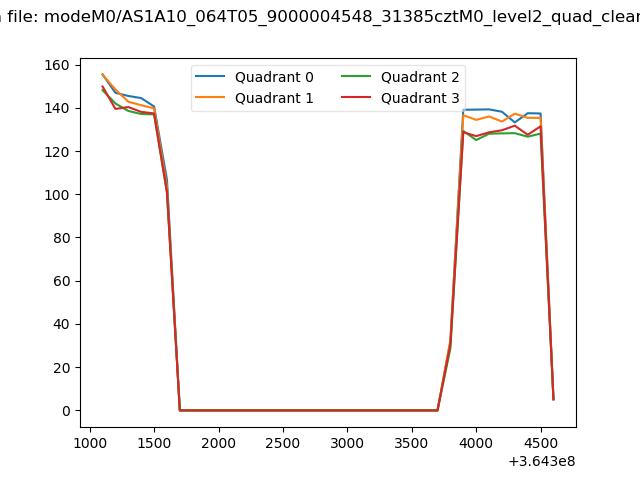 |
|
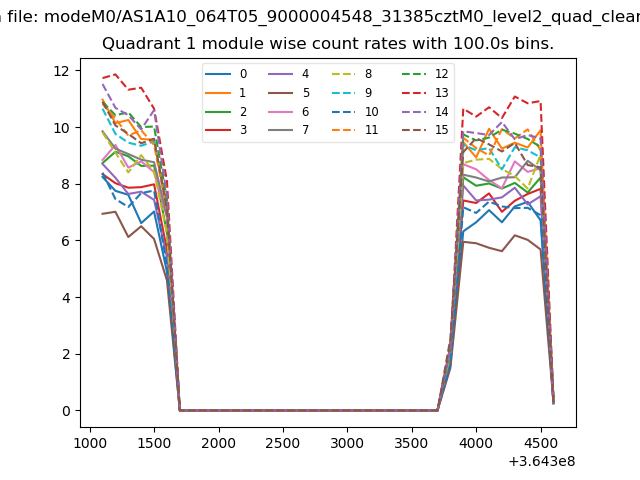
| Module-wise count rates for Quadrant A Data is divided into 100 sec bins |
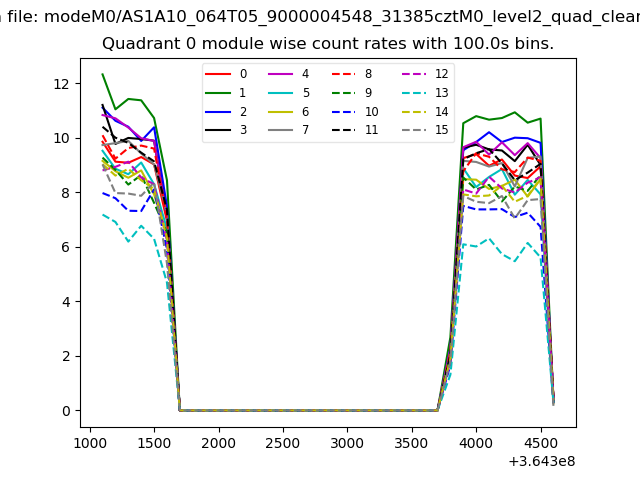 |
 |
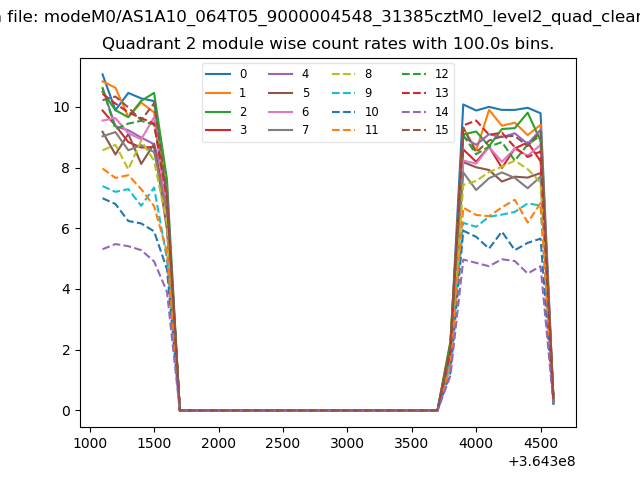
| Module-wise count rates for Quadrant B Data is divided into 100 sec bins |
 |
 |
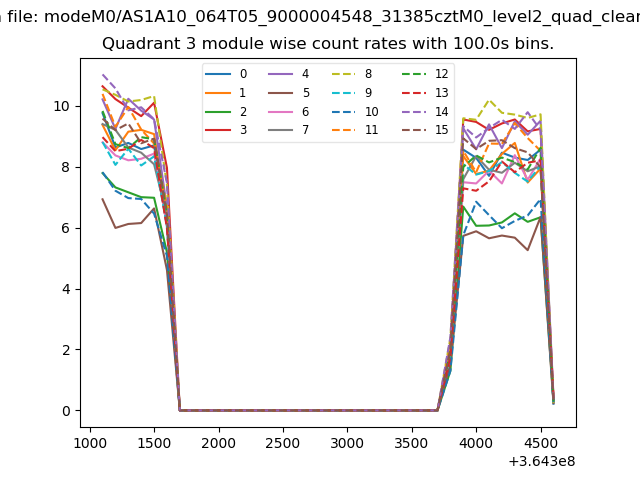
| Module-wise count rates for Quadrant C Data is divided into 100 sec bins |
 |
 |
| Module-wise count rates for Quadrant D Data is divided into 100 sec bins |
 |
 |
| Parameter | Plot |
|---|---|
| CZT HV Monitor | 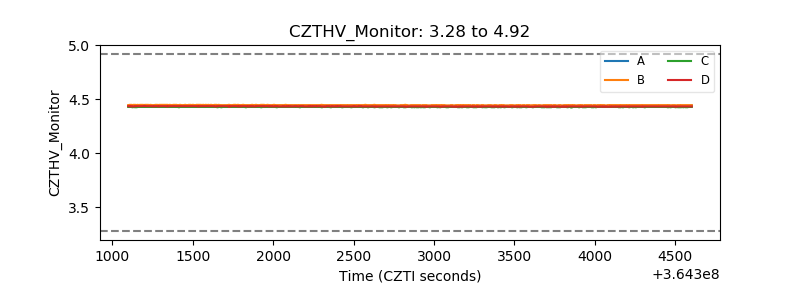 |
| D_VDD |  |
| Temperature 1 | 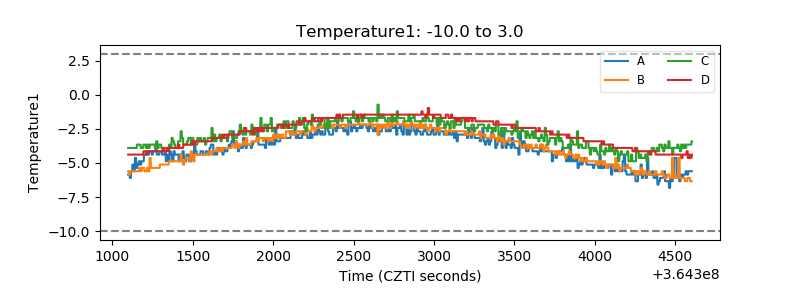 |
| Veto HV Monitor | 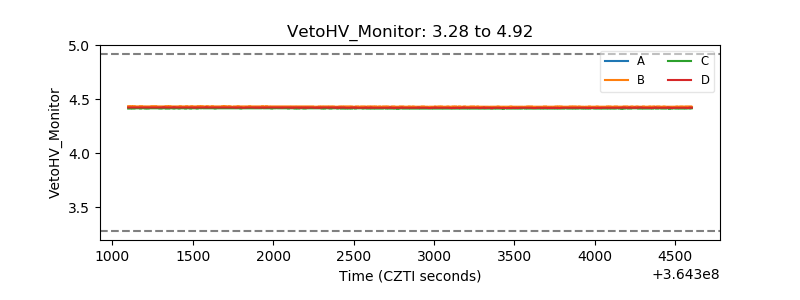 |
| Veto LLD |  |
| Alpha Counter | 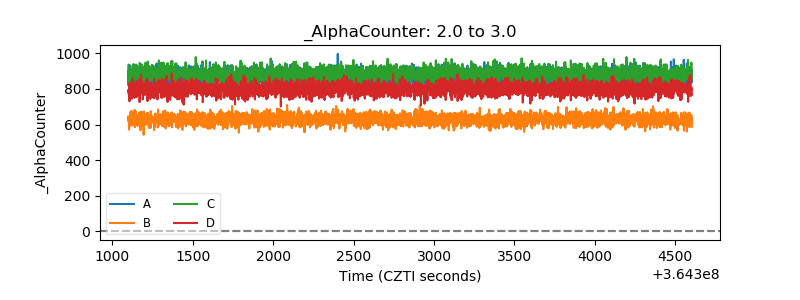 |
| _CPM_Rate |  |
| CZT Counter | 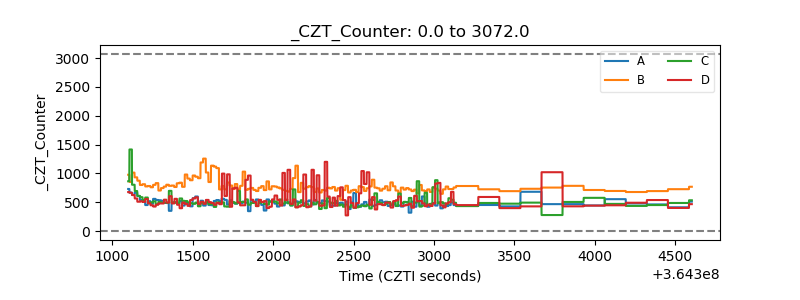 |
| +2.5 Volts monitor |  |
| +5 Volts monitor |  |
| _ROLL_ROT |  |
| _Roll_DEC | 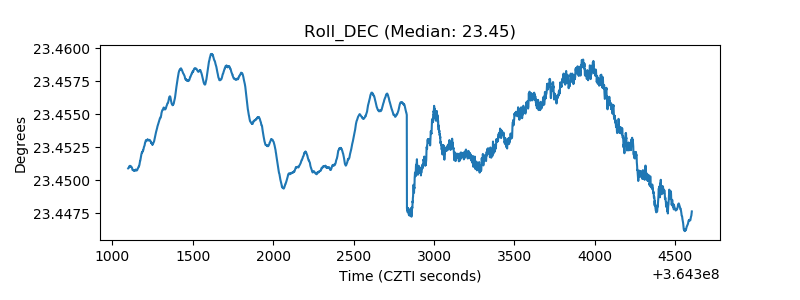 |
| _Roll_RA | 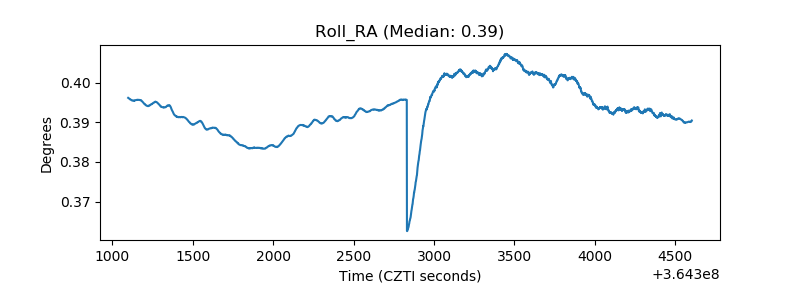 |
| Veto Counter |  |