| Param | Original file | Final file |
|---|---|---|
| Filename | modeM0/AS1C06_006T05_9000004550cztM0_level2.fits | modeM0/AS1C06_006T05_9000004550cztM0_level2_quad_clean.evt |
| Size (bytes) | 88,865,280 | 66,453,120 |
| Size | 84.7 MB | 63.4 MB |
| Events in quadrant A | 554,186 | 370,129 |
| Events in quadrant B | 505,642 | 349,197 |
| Events in quadrant C | 527,238 | 343,347 |
| Events in quadrant D | 476,108 | 320,831 |
| Mode SS | |||
|---|---|---|---|
| Quadrant | BADHDUFLAG | Total packets | Discarded packets |
| A | 0 | 186 | 0 |
| B | 0 | 188 | 0 |
| C | 0 | 186 | 0 |
| D | 0 | 186 | 0 |
| Mode M0 | |||
|---|---|---|---|
| Quadrant | BADHDUFLAG | Total packets | Discarded packets |
| A | 0 | 19345 | 0 |
| B | 0 | 29674 | 0 |
| C | 0 | 19629 | 0 |
| D | 0 | 22108 | 0 |
| Mode M9 | |||
|---|---|---|---|
| Quadrant | BADHDUFLAG | Total packets | Discarded packets |
| A | 0 | 7 | 0 |
| B | 0 | 7 | 0 |
| C | 0 | 7 | 0 |
| D | 0 | 7 | 0 |
| Quadrant | Total seconds | Saturated seconds | Saturation percentage |
|---|---|---|---|
| A | 9044 | 247 | 2.731092% |
| B | 9032 | 642 | 7.108060% |
| C | 9050 | 398 | 4.397790% |
| D | 9047 | 224 | 2.475959% |
Noise dominated data is calculated using 1-second bins in cleaned event files. If a bin has >2000 counts, and if more than 50% of those come from <1% of pixels, then it is considered to be noise-dominated and hence unusable.
| Quadrant | # 1 sec bins | Bins with >0 counts | Bins with >2000 counts | High rate bins dominated by noise | Noise dominated (total time) | Noise dominated (detector-on time) | Marked lightcurve |
|---|---|---|---|---|---|---|---|
| A | 9888 | 9051 | 0 | 0 | 0.00% | 0.00% |  |
| B | 9888 | 9037 | 0 | 0 | 0.00% | 0.00% |  |
| C | 9888 | 9065 | 0 | 0 | 0.00% | 0.00% |  |
| D | 9888 | 9064 | 0 | 0 | 0.00% | 0.00% |  |
Top three noisy pixels from each quadrant. If the there are fewer than three noisy pixels in the level2.evt file, extra rows are filled as -1
| Pixel properties | Quadrant properties | ||||||
|---|---|---|---|---|---|---|---|
| Quadrant | DetID | PixID | Counts | Sigma | Mean | Median | Sigma |
| A | 0 | 29 | 526 | 10.41 | 144 | 136 | 37.5 |
| A | 7 | 110 | 441 | 8.14 | 144 | 136 | 37.5 |
| A | 0 | 30 | 413 | 7.4 | 144 | 136 | 37.5 |
| B | 2 | 9 | 429 | 10.5 | 133 | 127 | 28.8 |
| B | 2 | 8 | 363 | 8.21 | 133 | 127 | 28.8 |
| B | 5 | 225 | 355 | 7.93 | 133 | 127 | 28.8 |
| C | 9 | 233 | 366 | 6.36 | 139 | 130 | 37.1 |
| C | 3 | 126 | 356 | 6.09 | 139 | 130 | 37.1 |
| C | 2 | 191 | 356 | 6.09 | 139 | 130 | 37.1 |
| D | 6 | 8 | 363 | 6.35 | 135 | 124 | 37.6 |
| D | 4 | 246 | 353 | 6.09 | 135 | 124 | 37.6 |
| D | 4 | 160 | 352 | 6.06 | 135 | 124 | 37.6 |
Histogram calculated using DETX and DETY for each event in the final _common_clean file
| Quadrant A |  |
 |
Quadrant B |
|---|---|---|---|
| Quadrant D |  |
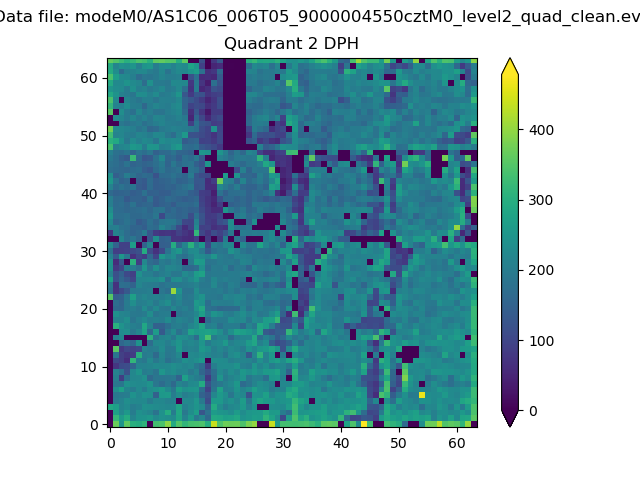 |
Quadrant C |
| Plot type | Count rate plots | Images |
|---|---|---|
| Comparison with Poisson distribution Blue bars denote a histogram of data divided into 1 sec bins. Red curve is a Poisson curve with rate = median count rate of data. |
 |
 |
| Quadrant-wise count rates Data is divided into 100 sec bins |
 |
|
| Module-wise count rates for Quadrant A Data is divided into 100 sec bins |
 |
 |
| Module-wise count rates for Quadrant B Data is divided into 100 sec bins |
 |
 |
| Module-wise count rates for Quadrant C Data is divided into 100 sec bins |
 |
 |
| Module-wise count rates for Quadrant D Data is divided into 100 sec bins |
 |
 |
| Parameter | Plot |
|---|---|
| CZT HV Monitor |  |
| D_VDD |  |
| Temperature 1 |  |
| Veto HV Monitor |  |
| Veto LLD |  |
| Alpha Counter |  |
| _CPM_Rate |  |
| CZT Counter |  |
| +2.5 Volts monitor |  |
| +5 Volts monitor |  |
| _ROLL_ROT |  |
| _Roll_DEC |  |
| _Roll_RA |  |
| Veto Counter |  |