| Param | Original file | Final file |
|---|---|---|
| Filename | modeM0/AS1C06_006T05_9000004550_31385cztM0_level2.evt | modeM0/AS1C06_006T05_9000004550_31385cztM0_level2_quad_clean.evt |
| Size (bytes) | 219,199,680 | 35,444,160 |
| Size | 209.0 MB | 33.8 MB |
| Events in quadrant A | 1,388,038 | 230,822 |
| Events in quadrant B | 2,158,440 | 225,642 |
| Events in quadrant C | 1,385,258 | 217,298 |
| Events in quadrant D | 1,532,716 | 217,215 |
| Mode SS | |||
|---|---|---|---|
| Quadrant | BADHDUFLAG | Total packets | Discarded packets |
| A | 0 | 54 | 0 |
| B | 0 | 54 | 0 |
| C | 0 | 54 | 0 |
| D | 0 | 54 | 0 |
| Mode M0 | |||
|---|---|---|---|
| Quadrant | BADHDUFLAG | Total packets | Discarded packets |
| A | 0 | 5605 | 1 |
| B | 0 | 8191 | 3 |
| C | 0 | 5573 | 1 |
| D | 0 | 6112 | 1 |
| Mode M9 | |||
|---|---|---|---|
| Quadrant | BADHDUFLAG | Total packets | Discarded packets |
| A | 0 | 6 | 0 |
| B | 0 | 6 | 0 |
| C | 0 | 6 | 0 |
| D | 0 | 6 | 0 |
| Quadrant | Total seconds | Saturated seconds | Saturation percentage |
|---|---|---|---|
| A | 2531 | 101 | 3.990518% |
| B | 2530 | 192 | 7.588933% |
| C | 2530 | 136 | 5.375494% |
| D | 2530 | 71 | 2.806324% |
Noise dominated data is calculated using 1-second bins in cleaned event files. If a bin has >2000 counts, and if more than 50% of those come from <1% of pixels, then it is considered to be noise-dominated and hence unusable.
| Quadrant | # 1 sec bins | Bins with >0 counts | Bins with >2000 counts | High rate bins dominated by noise | Noise dominated (total time) | Noise dominated (detector-on time) | Marked lightcurve |
|---|---|---|---|---|---|---|---|
| A | 3191 | 2531 | 9 | 9 | 0.28% | 0.36% | 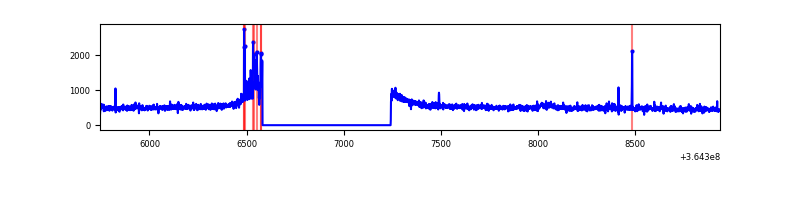 |
| B | 3190 | 2531 | 28 | 28 | 0.88% | 1.11% | 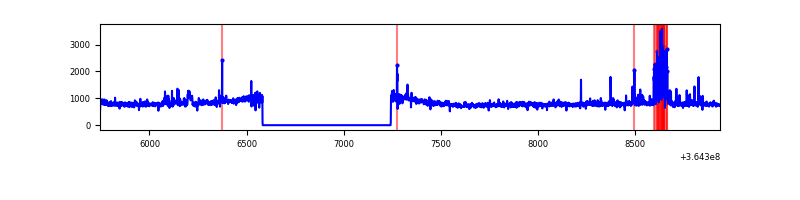 |
| C | 3190 | 2531 | 9 | 9 | 0.28% | 0.36% | 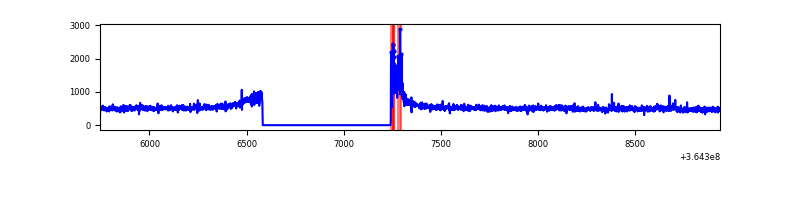 |
| D | 3190 | 2531 | 6 | 6 | 0.19% | 0.24% | 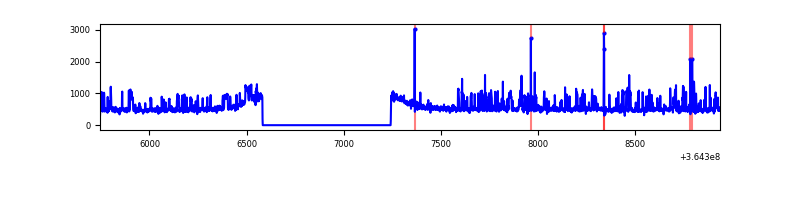 |
Top three noisy pixels from each quadrant. If the there are fewer than three noisy pixels in the level2.evt file, extra rows are filled as -1
| Pixel properties | Quadrant properties | ||||||
|---|---|---|---|---|---|---|---|
| Quadrant | DetID | PixID | Counts | Sigma | Mean | Median | Sigma |
| A | 5 | 16 | 69737 | 986.3 | 340 | 331 | 70.4 |
| A | 13 | 170 | 6084 | 81.75 | 340 | 331 | 70.4 |
| A | 13 | 254 | 4653 | 61.42 | 340 | 331 | 70.4 |
| B | 6 | 159 | 667005 | 10020.16 | 330 | 321 | 66.5 |
| B | 5 | 172 | 84197 | 1260.64 | 330 | 321 | 66.5 |
| B | 0 | 190 | 53532 | 799.75 | 330 | 321 | 66.5 |
| C | 0 | 10 | 53313 | 685.54 | 321 | 322 | 77.3 |
| C | 14 | 238 | 50819 | 653.27 | 321 | 322 | 77.3 |
| C | 3 | 233 | 18303 | 232.62 | 321 | 322 | 77.3 |
| D | 8 | 195 | 190726 | 2310.91 | 334 | 324 | 82.4 |
| D | 10 | 203 | 33149 | 398.4 | 334 | 324 | 82.4 |
| D | 2 | 250 | 20975 | 250.64 | 334 | 324 | 82.4 |
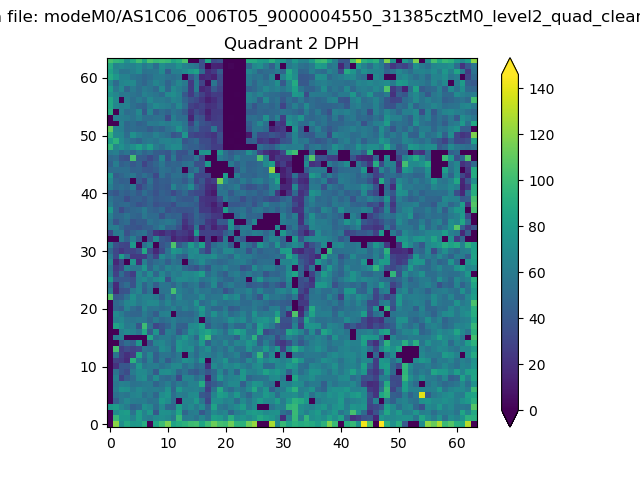
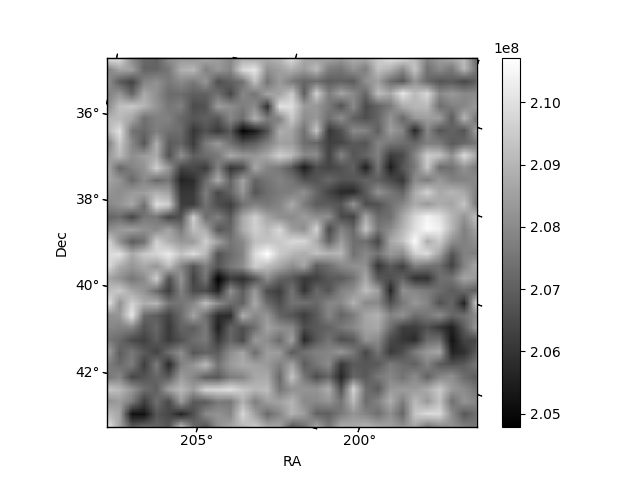
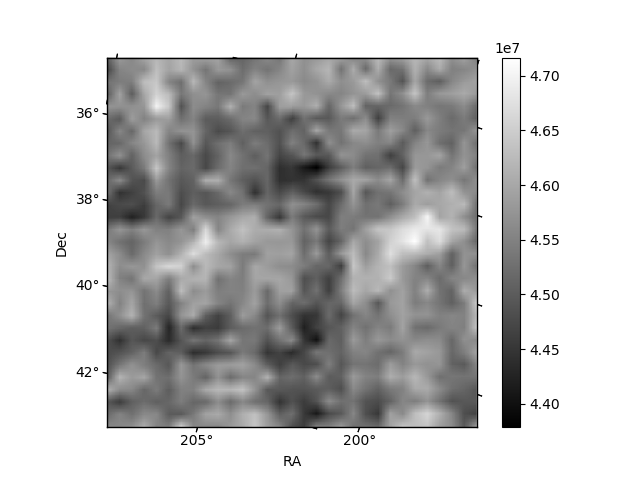
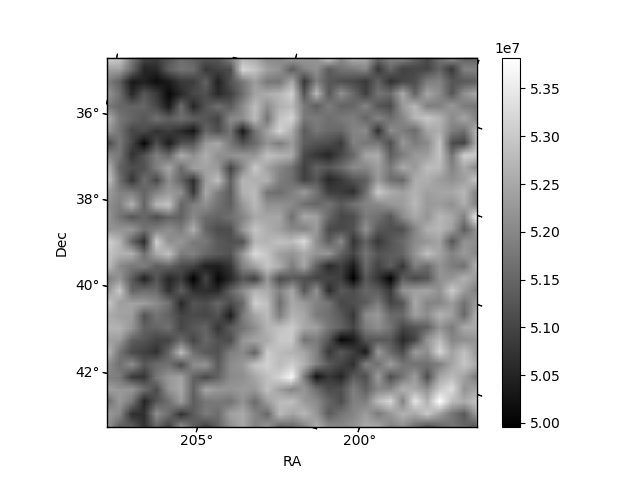
Histogram calculated using DETX and DETY for each event in the final _common_clean file
| Quadrant A | 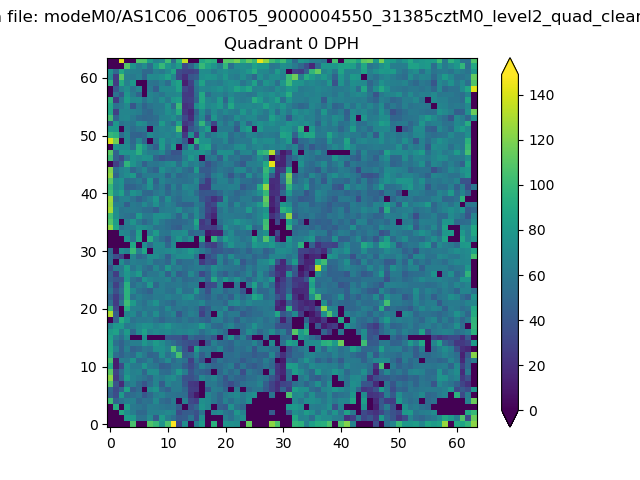 |
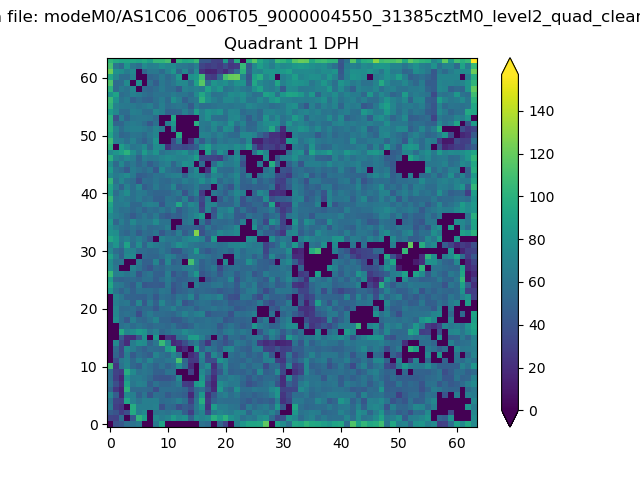 |
Quadrant B |
|---|---|---|---|
| Quadrant D | 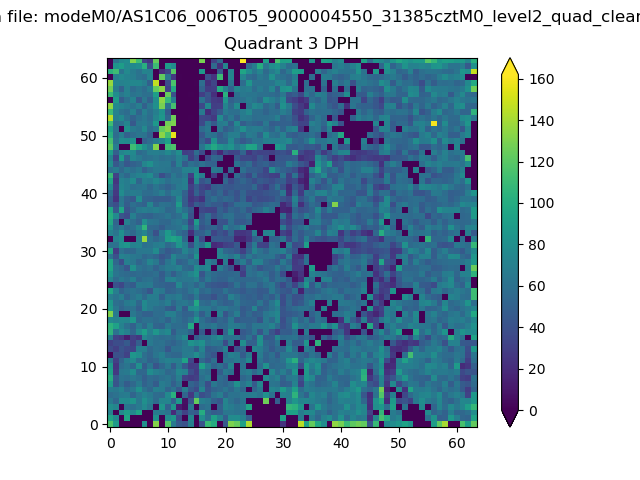 |
 |
Quadrant C |
| Plot type | Count rate plots | Images |
|---|---|---|
| Comparison with Poisson distribution Blue bars denote a histogram of data divided into 1 sec bins. Red curve is a Poisson curve with rate = median count rate of data. |
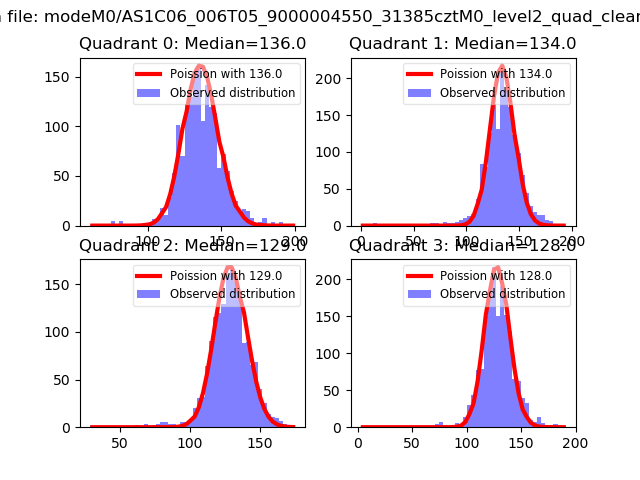 |
 |
| Quadrant-wise count rates Data is divided into 100 sec bins |
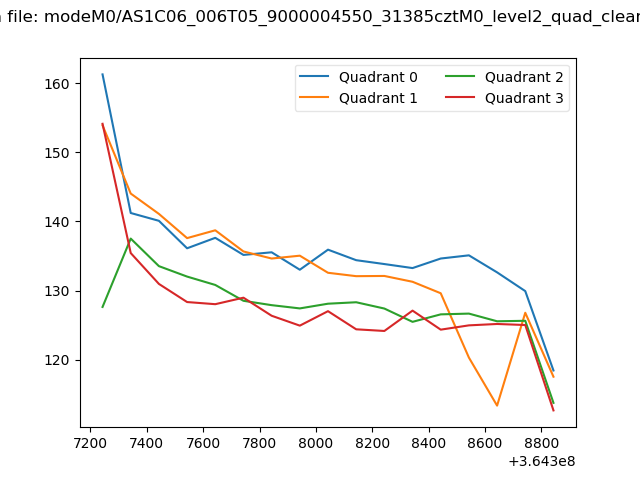 |
|
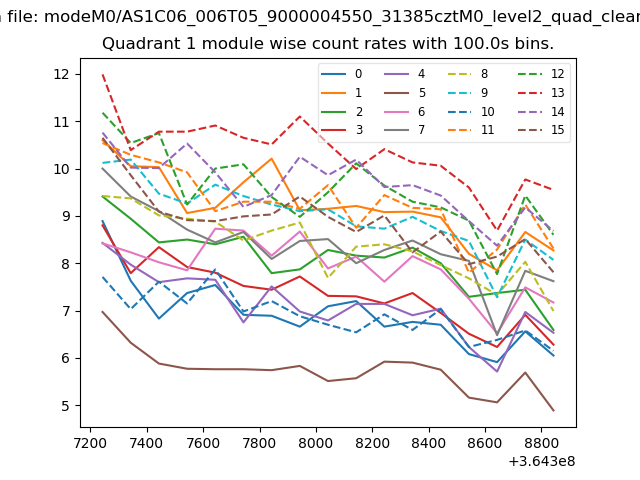
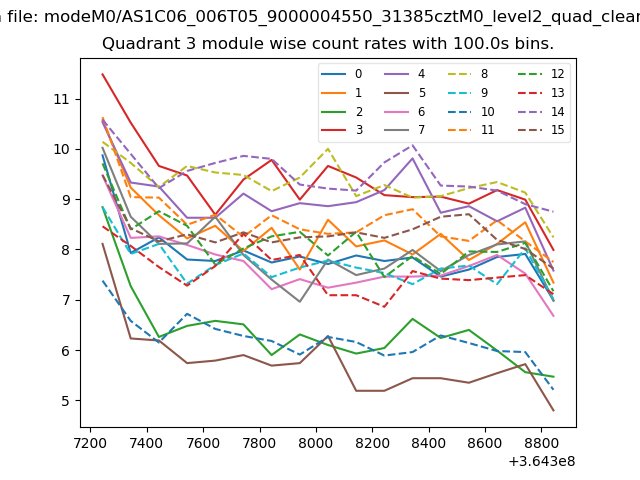
| Module-wise count rates for Quadrant A Data is divided into 100 sec bins |
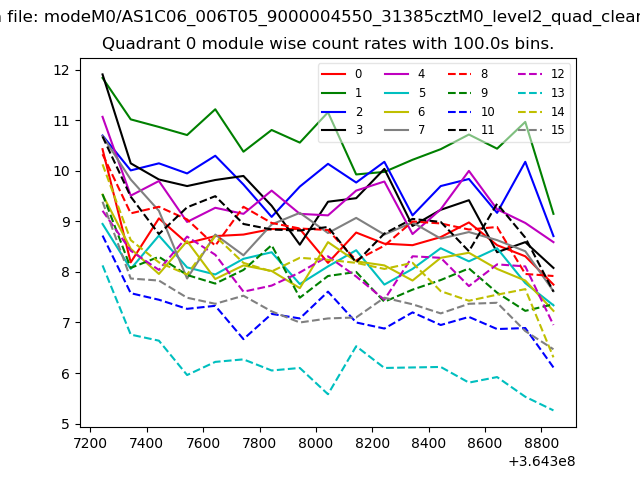 |
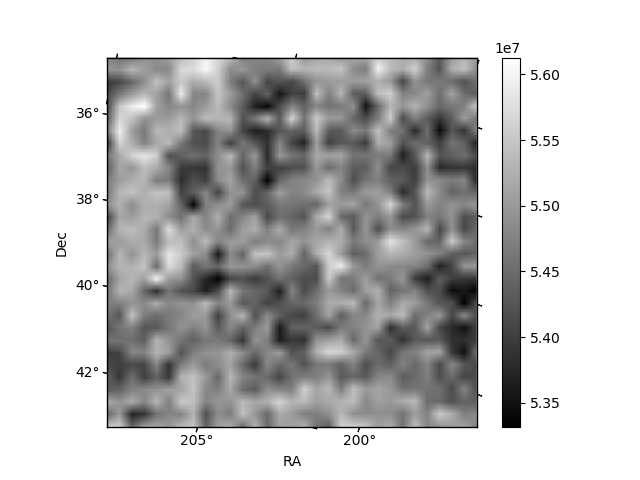 |
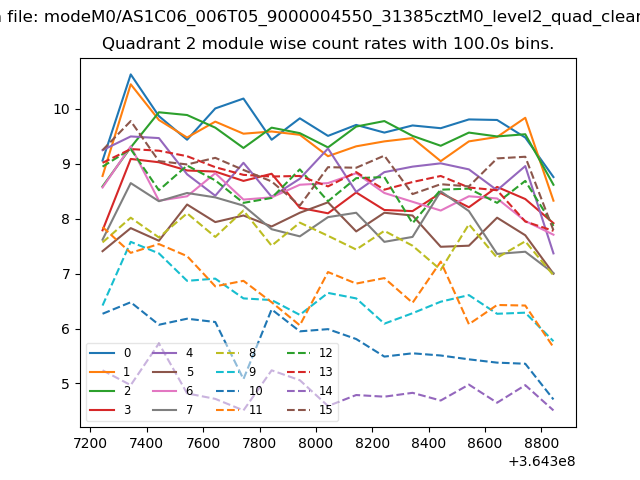
| Module-wise count rates for Quadrant B Data is divided into 100 sec bins |
 |
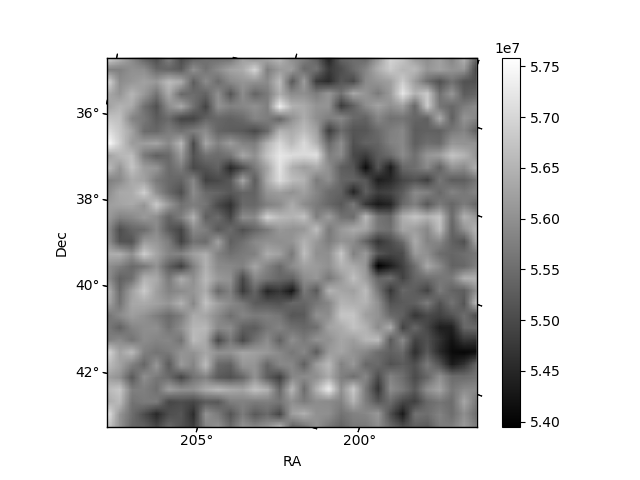 |
| Module-wise count rates for Quadrant C Data is divided into 100 sec bins |
 |
 |
| Module-wise count rates for Quadrant D Data is divided into 100 sec bins |
 |
 |
| Parameter | Plot |
|---|---|
| CZT HV Monitor | 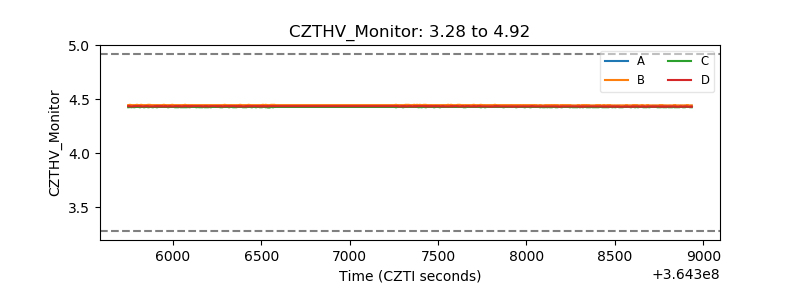 |
| D_VDD | 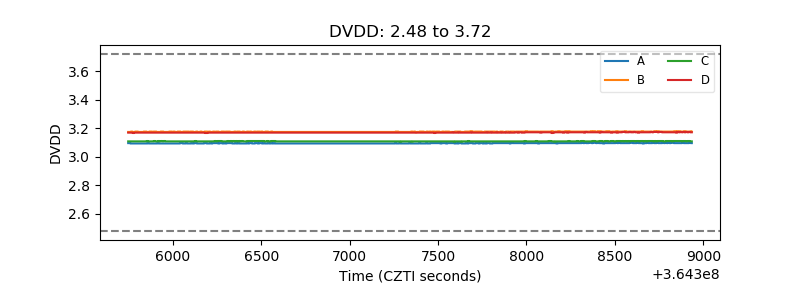 |
| Temperature 1 | 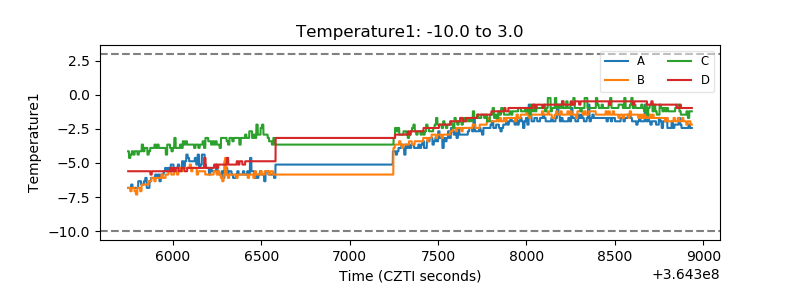 |
| Veto HV Monitor | 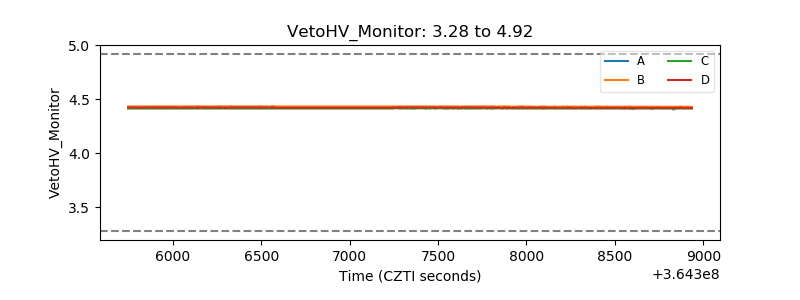 |
| Veto LLD | 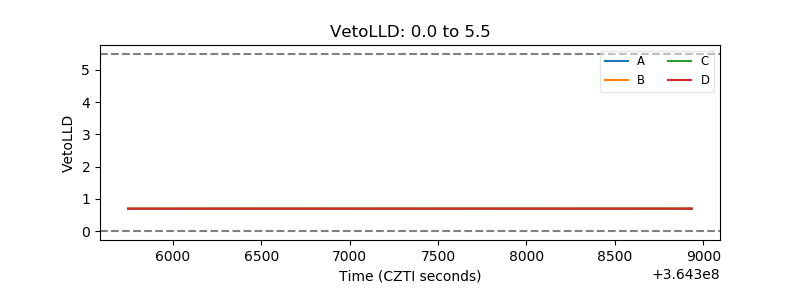 |
| Alpha Counter | 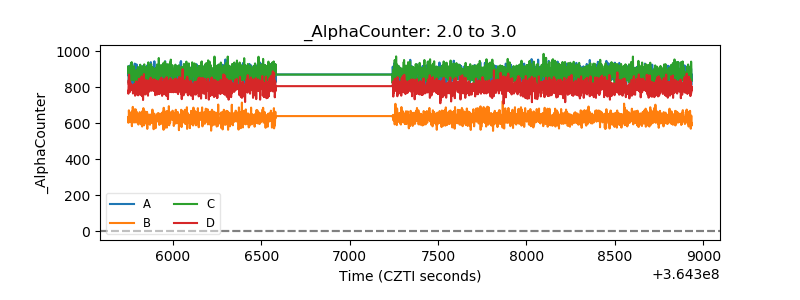 |
| _CPM_Rate | 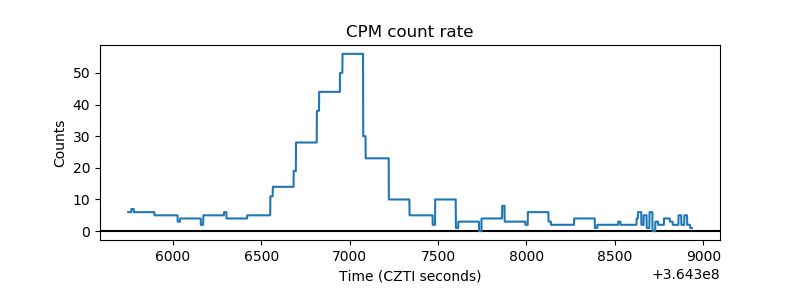 |
| CZT Counter | 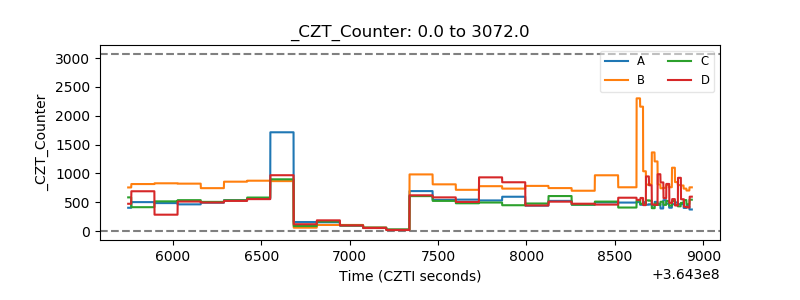 |
| +2.5 Volts monitor |  |
| +5 Volts monitor |  |
| _ROLL_ROT | 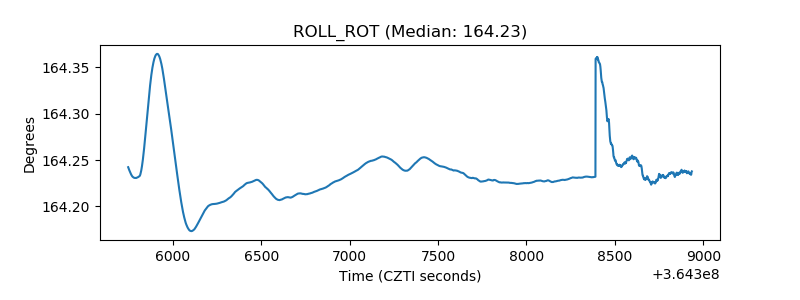 |
| _Roll_DEC | 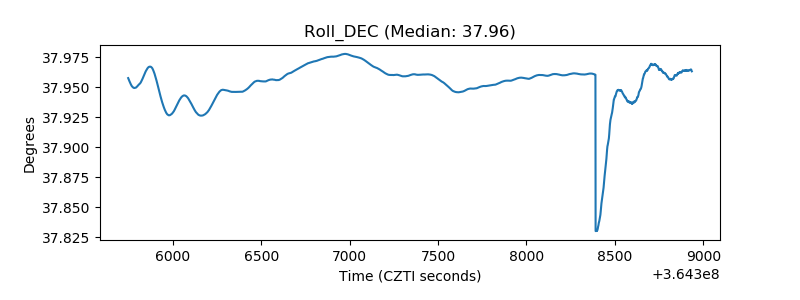 |
| _Roll_RA | 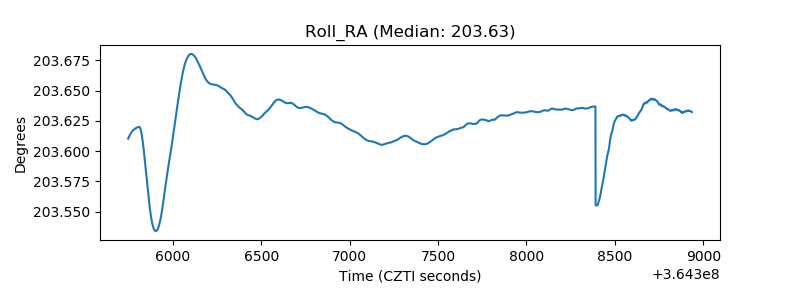 |
| Veto Counter | 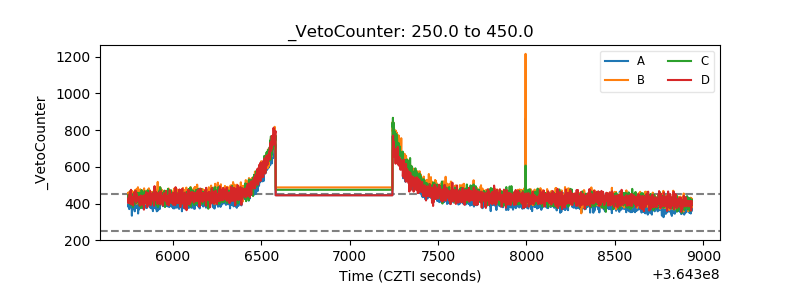 |