| Param | Original file | Final file |
|---|---|---|
| Filename | modeM0/AS1C06_006T05_9000004550_31386cztM0_level2.evt | modeM0/AS1C06_006T05_9000004550_31386cztM0_level2_quad_clean.evt |
| Size (bytes) | 576,895,680 | 96,131,520 |
| Size | 550.2 MB | 91.7 MB |
| Events in quadrant A | 3,354,021 | 632,453 |
| Events in quadrant B | 6,006,749 | 607,573 |
| Events in quadrant C | 3,571,209 | 597,924 |
| Events in quadrant D | 4,073,132 | 593,615 |
| Mode SS | |||
|---|---|---|---|
| Quadrant | BADHDUFLAG | Total packets | Discarded packets |
| A | 0 | 140 | 0 |
| B | 0 | 140 | 0 |
| C | 0 | 140 | 0 |
| D | 0 | 140 | 0 |
| Mode M0 | |||
|---|---|---|---|
| Quadrant | BADHDUFLAG | Total packets | Discarded packets |
| A | 0 | 14491 | 1 |
| B | 0 | 22790 | 1 |
| C | 0 | 14798 | 1 |
| D | 0 | 16733 | 3 |
| Mode M9 | |||
|---|---|---|---|
| Quadrant | BADHDUFLAG | Total packets | Discarded packets |
| A | 0 | 1 | 0 |
| B | 0 | 1 | 0 |
| C | 0 | 1 | 0 |
| D | 0 | 1 | 0 |
| Quadrant | Total seconds | Saturated seconds | Saturation percentage |
|---|---|---|---|
| A | 6877 | 147 | 2.137560% |
| B | 6878 | 485 | 7.051468% |
| C | 6878 | 264 | 3.838325% |
| D | 6877 | 156 | 2.268431% |
Noise dominated data is calculated using 1-second bins in cleaned event files. If a bin has >2000 counts, and if more than 50% of those come from <1% of pixels, then it is considered to be noise-dominated and hence unusable.
| Quadrant | # 1 sec bins | Bins with >0 counts | Bins with >2000 counts | High rate bins dominated by noise | Noise dominated (total time) | Noise dominated (detector-on time) | Marked lightcurve |
|---|---|---|---|---|---|---|---|
| A | 7012 | 6878 | 1 | 1 | 0.01% | 0.01% | 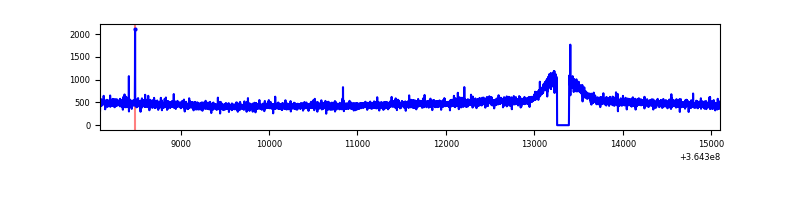 |
| B | 7013 | 6879 | 96 | 96 | 1.37% | 1.40% |  |
| C | 7013 | 6879 | 1 | 1 | 0.01% | 0.01% | 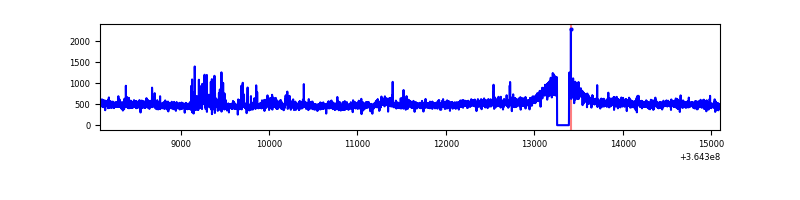 |
| D | 7012 | 6878 | 22 | 22 | 0.31% | 0.32% | 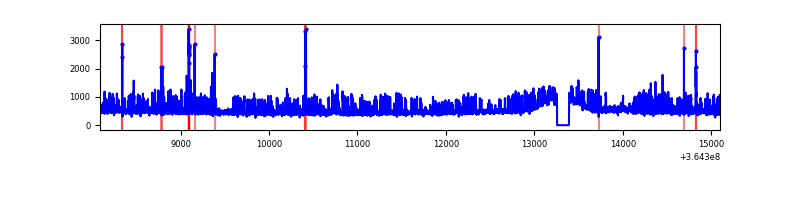 |
Top three noisy pixels from each quadrant. If the there are fewer than three noisy pixels in the level2.evt file, extra rows are filled as -1
| Pixel properties | Quadrant properties | ||||||
|---|---|---|---|---|---|---|---|
| Quadrant | DetID | PixID | Counts | Sigma | Mean | Median | Sigma |
| A | 13 | 254 | 13273 | 70.52 | 867 | 847 | 176.2 |
| A | 3 | 137 | 8723 | 44.7 | 867 | 847 | 176.2 |
| A | 0 | 226 | 7435 | 37.39 | 867 | 847 | 176.2 |
| B | 6 | 159 | 1953134 | 11975.87 | 836 | 814 | 163.0 |
| B | 5 | 172 | 257710 | 1575.84 | 836 | 814 | 163.0 |
| B | 0 | 190 | 202525 | 1237.33 | 836 | 814 | 163.0 |
| C | 14 | 238 | 152687 | 780.28 | 822 | 827 | 194.6 |
| C | 3 | 233 | 122542 | 625.39 | 822 | 827 | 194.6 |
| C | 0 | 10 | 36671 | 184.17 | 822 | 827 | 194.6 |
| D | 8 | 195 | 649757 | 3184.78 | 845 | 822 | 203.8 |
| D | 13 | 249 | 64058 | 310.34 | 845 | 822 | 203.8 |
| D | 10 | 203 | 56007 | 270.83 | 845 | 822 | 203.8 |
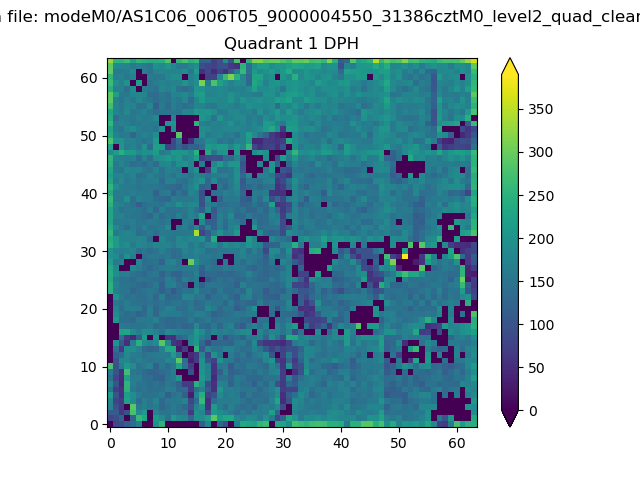
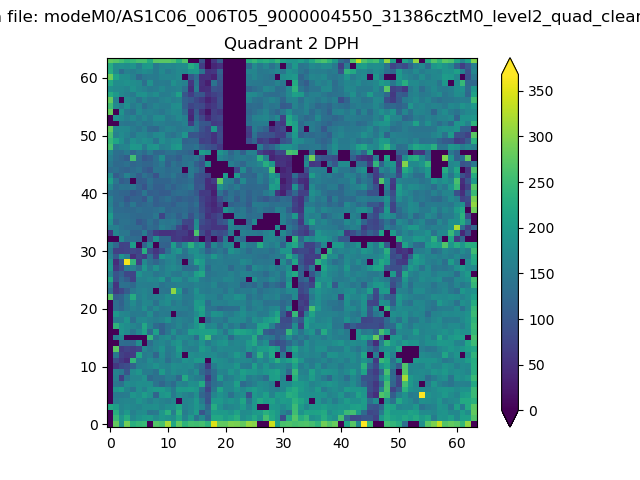
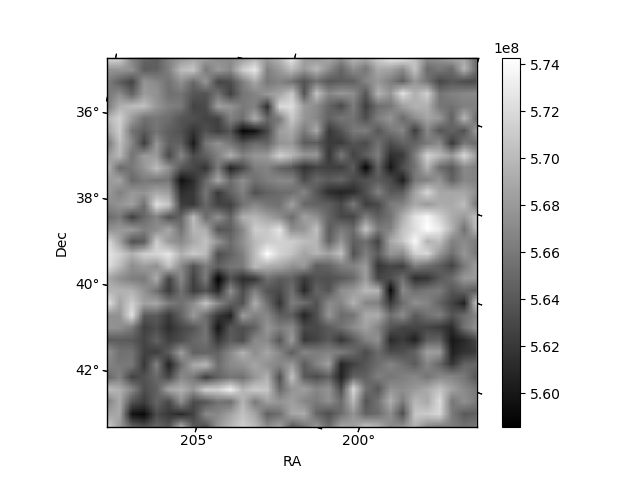
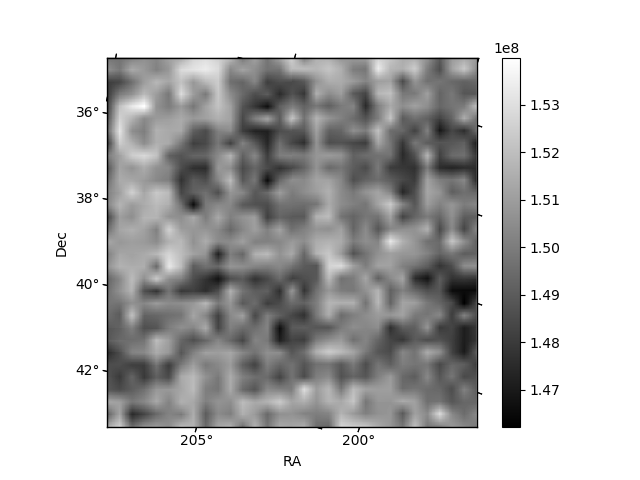
Histogram calculated using DETX and DETY for each event in the final _common_clean file
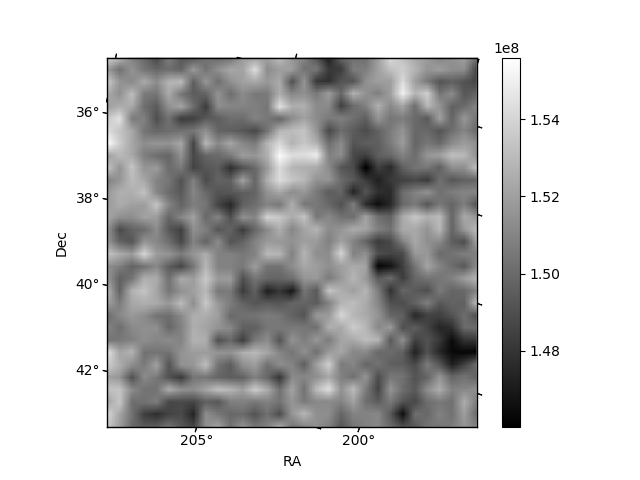
| Quadrant A | 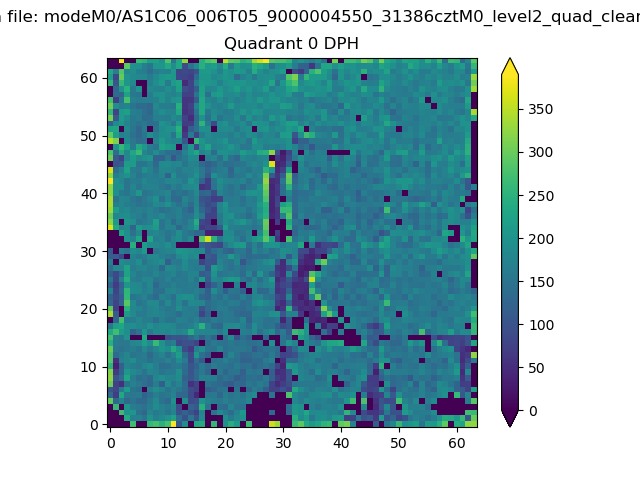 |
 |
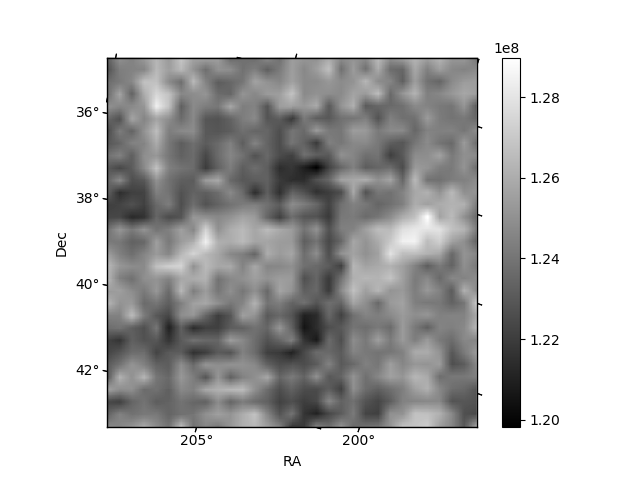
Quadrant B |
|---|---|---|---|
| Quadrant D | 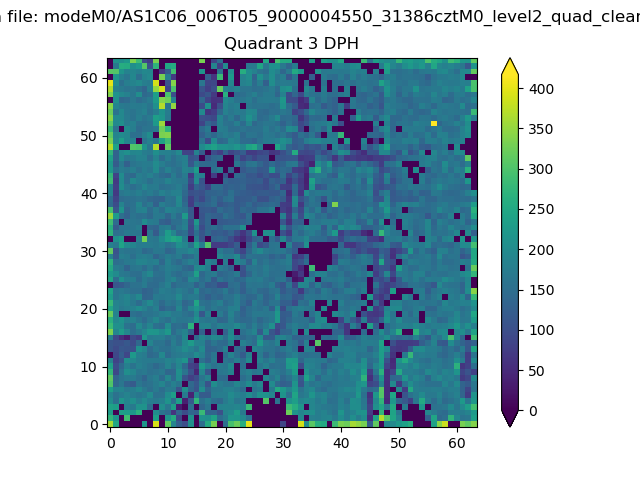 |
 |
Quadrant C |
| Plot type | Count rate plots | Images |
|---|---|---|
| Comparison with Poisson distribution Blue bars denote a histogram of data divided into 1 sec bins. Red curve is a Poisson curve with rate = median count rate of data. |
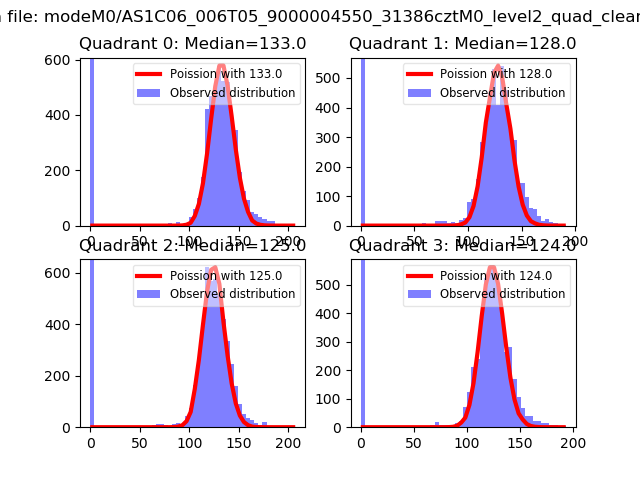 |
 |
| Quadrant-wise count rates Data is divided into 100 sec bins |
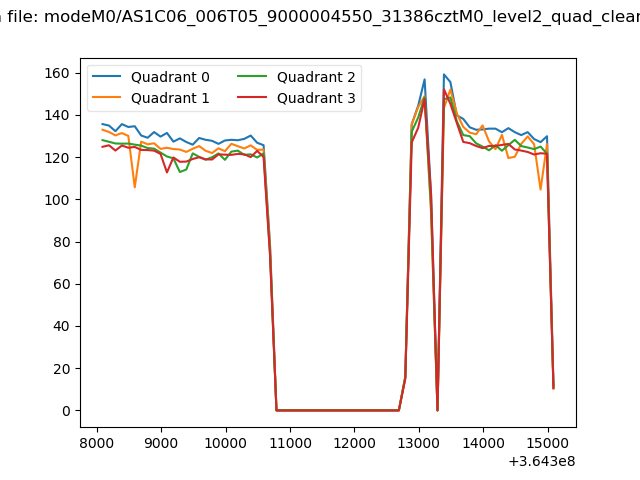 |
|
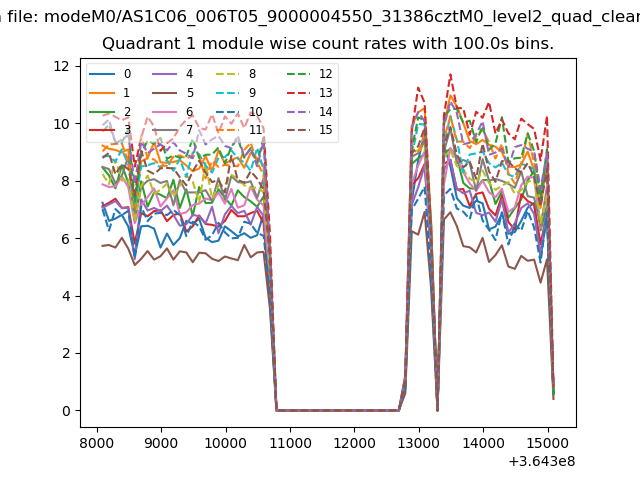
| Module-wise count rates for Quadrant A Data is divided into 100 sec bins |
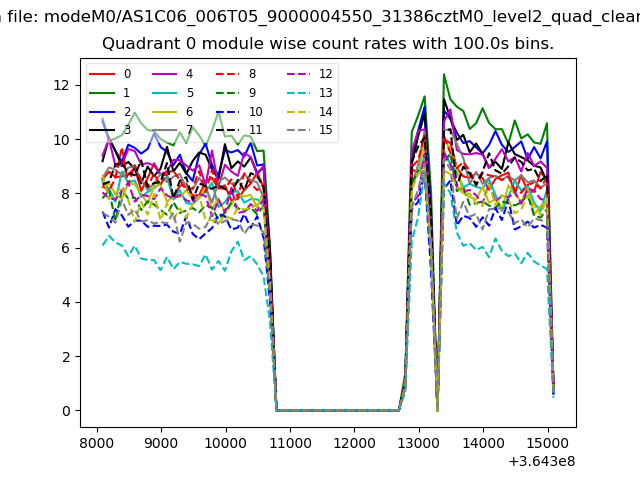 |
 |
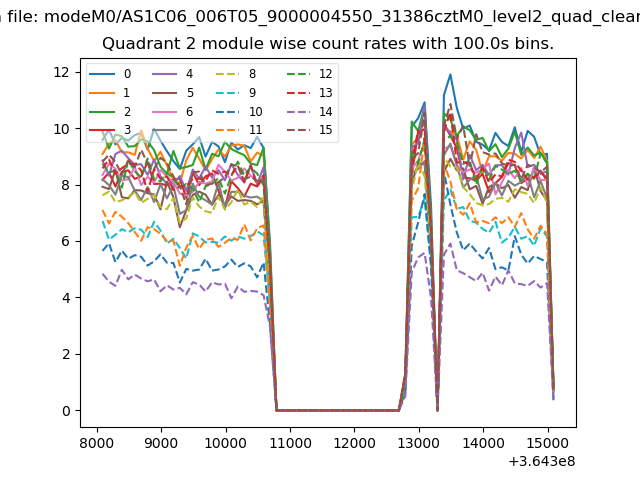
| Module-wise count rates for Quadrant B Data is divided into 100 sec bins |
 |
 |
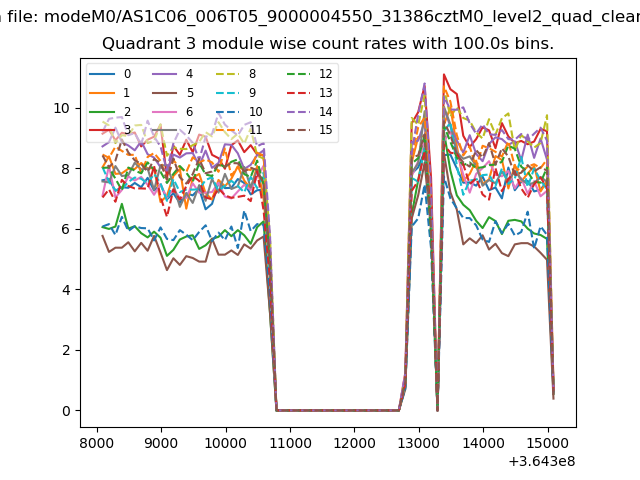
| Module-wise count rates for Quadrant C Data is divided into 100 sec bins |
 |
 |
| Module-wise count rates for Quadrant D Data is divided into 100 sec bins |
 |
 |
| Parameter | Plot |
|---|---|
| CZT HV Monitor | 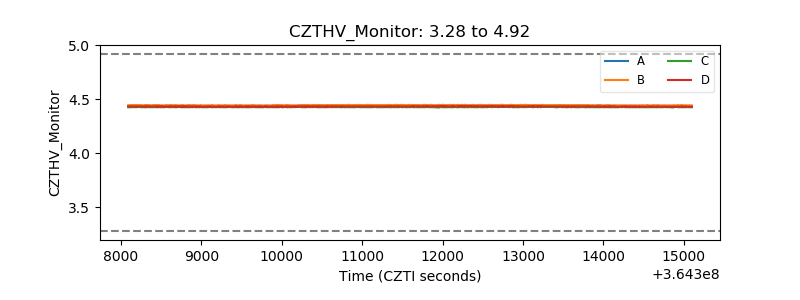 |
| D_VDD | 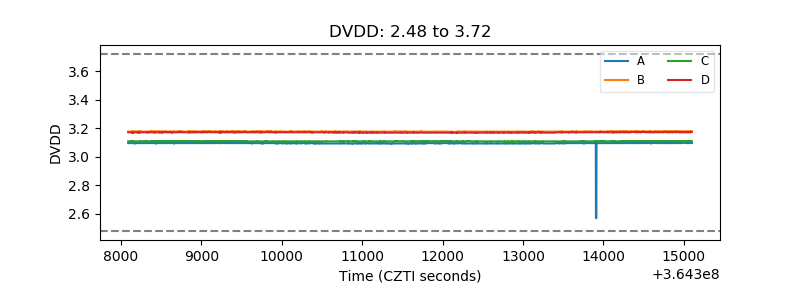 |
| Temperature 1 | 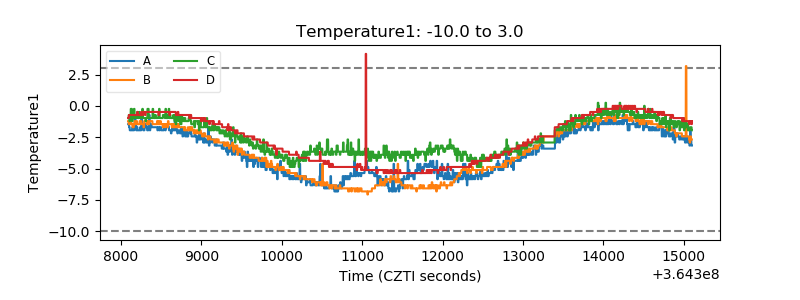 |
| Veto HV Monitor |  |
| Veto LLD | 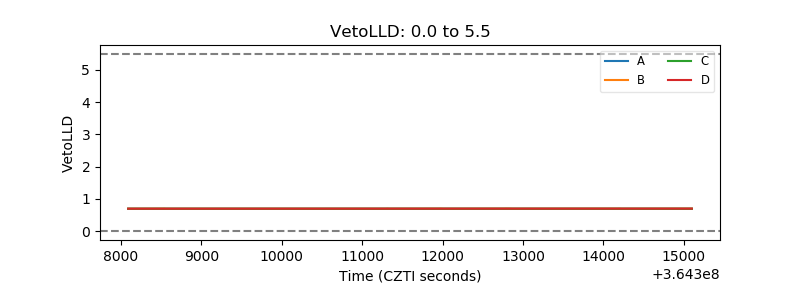 |
| Alpha Counter | 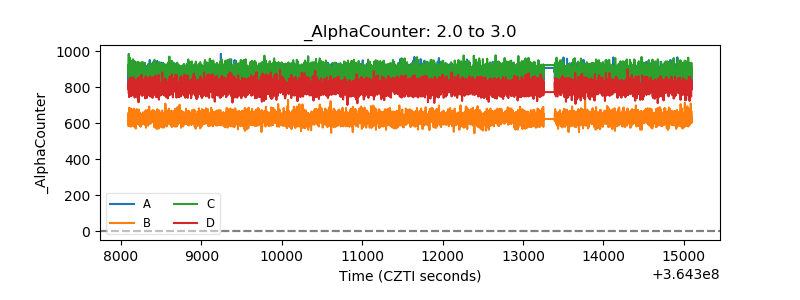 |
| _CPM_Rate | 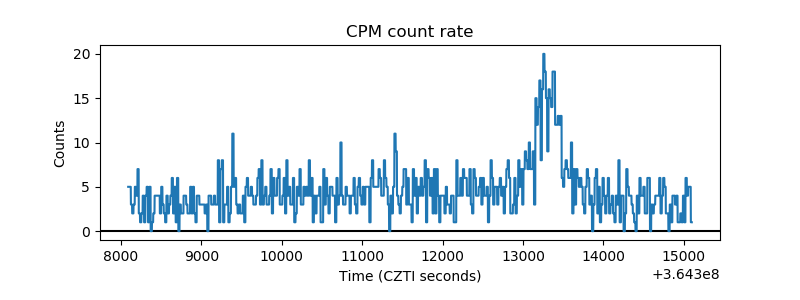 |
| CZT Counter | 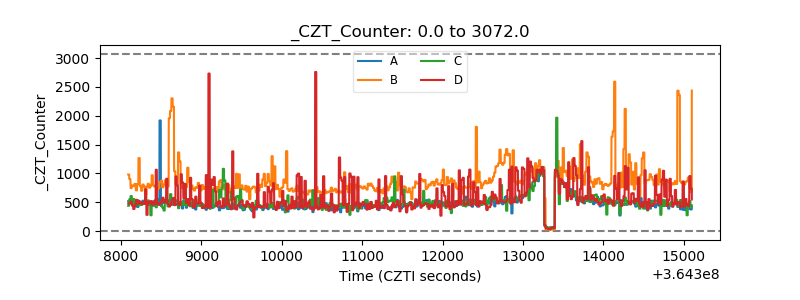 |
| +2.5 Volts monitor |  |
| +5 Volts monitor |  |
| _ROLL_ROT | 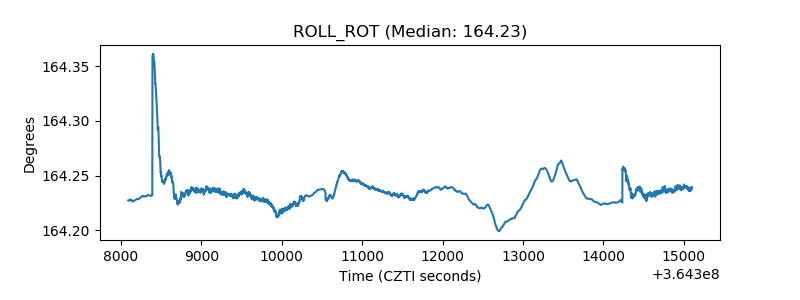 |
| _Roll_DEC | 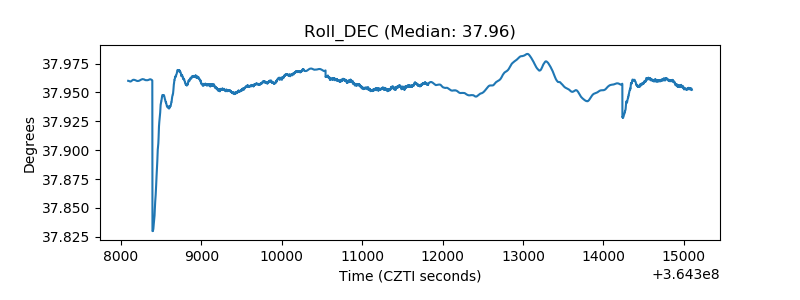 |
| _Roll_RA | 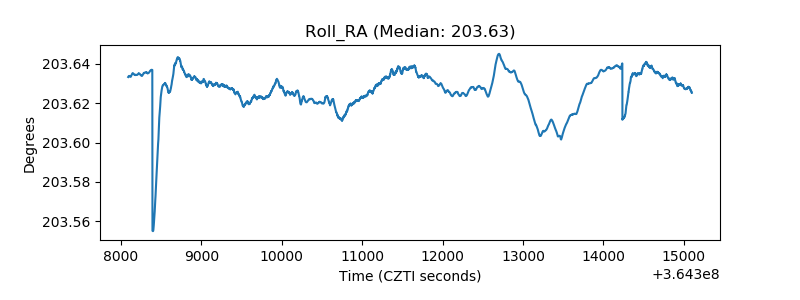 |
| Veto Counter | 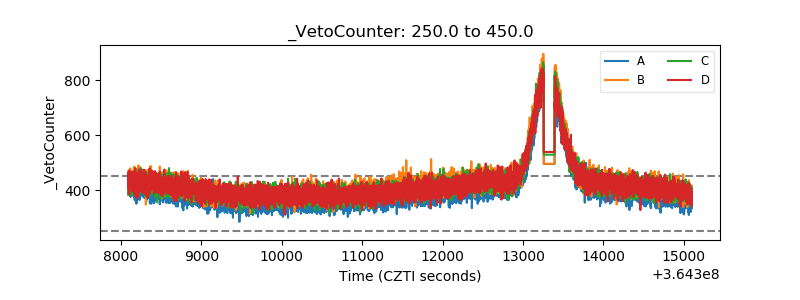 |