| Param | Original file | Final file |
|---|---|---|
| Filename | modeM0/AS1C06_006T05_9000004550_31387cztM0_level2.evt | modeM0/AS1C06_006T05_9000004550_31387cztM0_level2_quad_clean.evt |
| Size (bytes) | 193,746,240 | 42,125,760 |
| Size | 184.8 MB | 40.2 MB |
| Events in quadrant A | 1,096,055 | 290,675 |
| Events in quadrant B | 2,100,931 | 276,128 |
| Events in quadrant C | 1,138,735 | 276,482 |
| Events in quadrant D | 1,382,014 | 274,615 |
| Mode SS | |||
|---|---|---|---|
| Quadrant | BADHDUFLAG | Total packets | Discarded packets |
| A | 0 | 44 | 2 |
| B | 0 | 44 | 0 |
| C | 0 | 44 | 2 |
| D | 0 | 44 | 2 |
| Mode M0 | |||
|---|---|---|---|
| Quadrant | BADHDUFLAG | Total packets | Discarded packets |
| A | 0 | 4794 | 115 |
| B | 0 | 8058 | 341 |
| C | 0 | 4839 | 102 |
| D | 0 | 5688 | 152 |
| Quadrant | Total seconds | Saturated seconds | Saturation percentage |
|---|---|---|---|
| A | 2180 | 50 | 2.293578% |
| B | 2164 | 223 | 10.304991% |
| C | 2190 | 85 | 3.881279% |
| D | 2187 | 47 | 2.149063% |
Noise dominated data is calculated using 1-second bins in cleaned event files. If a bin has >2000 counts, and if more than 50% of those come from <1% of pixels, then it is considered to be noise-dominated and hence unusable.
| Quadrant | # 1 sec bins | Bins with >0 counts | Bins with >2000 counts | High rate bins dominated by noise | Noise dominated (total time) | Noise dominated (detector-on time) | Marked lightcurve |
|---|---|---|---|---|---|---|---|
| A | 2239 | 2197 | 0 | 0 | 0.00% | 0.00% | 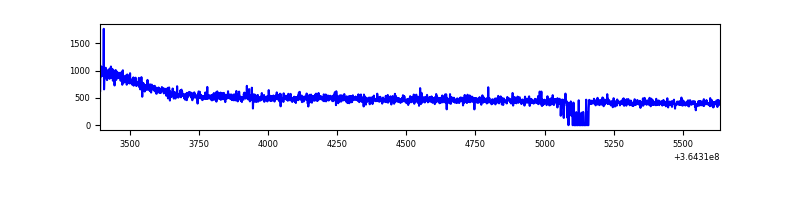 |
| B | 2240 | 2178 | 59 | 59 | 2.63% | 2.71% | 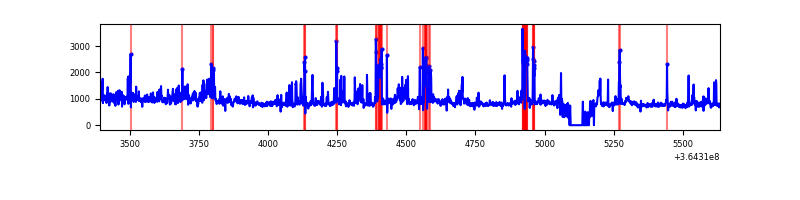 |
| C | 2240 | 2209 | 1 | 1 | 0.04% | 0.05% | 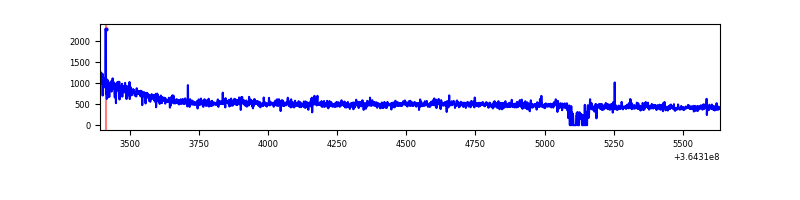 |
| D | 2240 | 2212 | 7 | 7 | 0.31% | 0.32% | 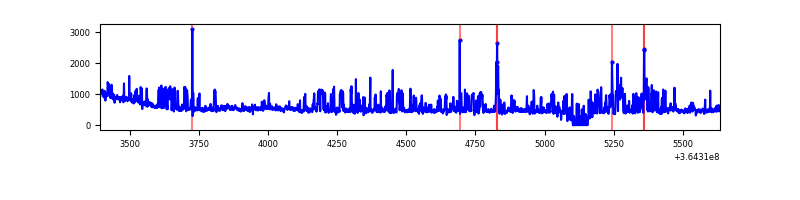 |
Top three noisy pixels from each quadrant. If the there are fewer than three noisy pixels in the level2.evt file, extra rows are filled as -1
| Pixel properties | Quadrant properties | ||||||
|---|---|---|---|---|---|---|---|
| Quadrant | DetID | PixID | Counts | Sigma | Mean | Median | Sigma |
| A | 13 | 254 | 4220 | 66.65 | 283 | 277 | 59.2 |
| A | 3 | 137 | 2784 | 42.38 | 283 | 277 | 59.2 |
| A | 0 | 226 | 2536 | 38.19 | 283 | 277 | 59.2 |
| B | 6 | 159 | 621565 | 11583.47 | 266 | 259 | 53.6 |
| B | 5 | 172 | 182633 | 3400.13 | 266 | 259 | 53.6 |
| B | 15 | 33 | 89987 | 1672.87 | 266 | 259 | 53.6 |
| C | 14 | 238 | 43633 | 659.01 | 269 | 270 | 65.8 |
| C | 3 | 233 | 28631 | 431.02 | 269 | 270 | 65.8 |
| C | 4 | 175 | 5408 | 78.09 | 269 | 270 | 65.8 |
| D | 8 | 195 | 241838 | 3473.75 | 278 | 269 | 69.5 |
| D | 7 | 69 | 29650 | 422.5 | 278 | 269 | 69.5 |
| D | 13 | 249 | 21454 | 304.64 | 278 | 269 | 69.5 |
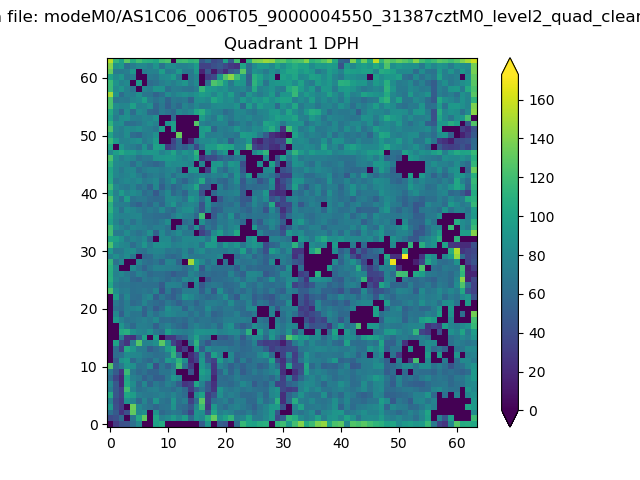
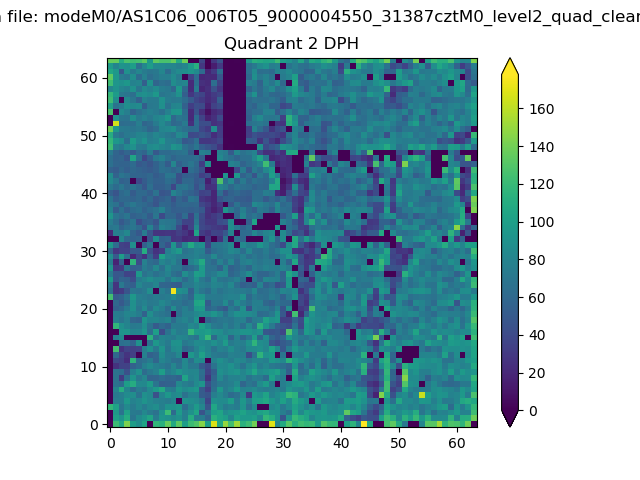
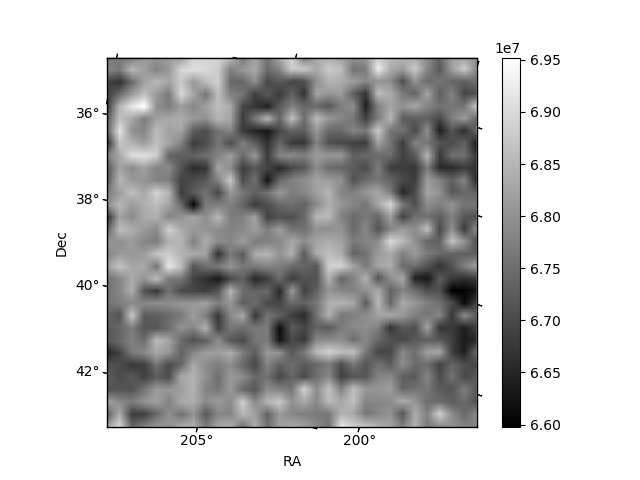
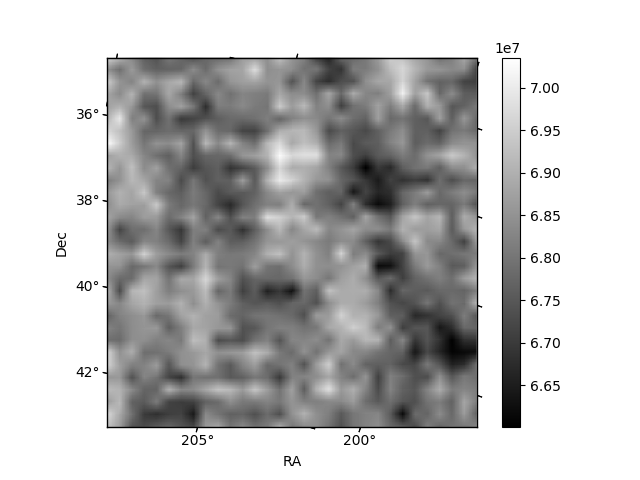
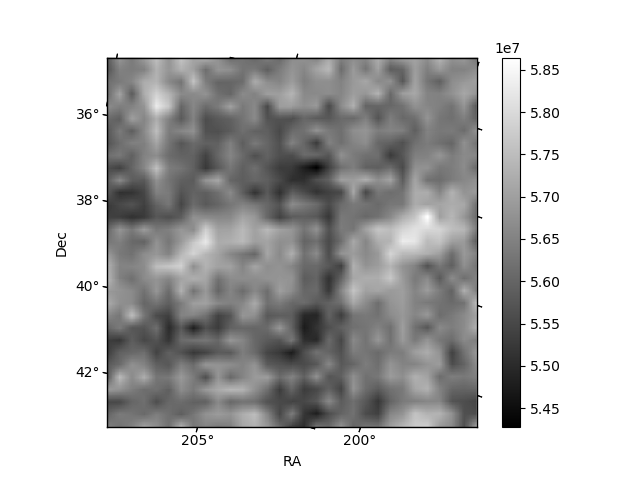
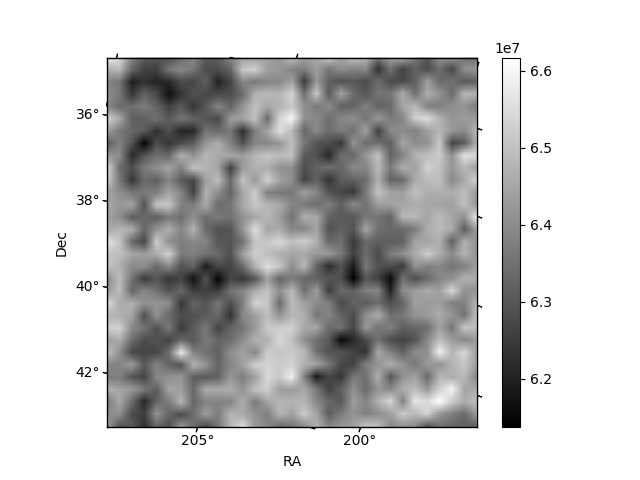
Histogram calculated using DETX and DETY for each event in the final _common_clean file
| Quadrant A |  |
 |
Quadrant B |
|---|---|---|---|
| Quadrant D |  |
 |
Quadrant C |
| Plot type | Count rate plots | Images |
|---|---|---|
| Comparison with Poisson distribution Blue bars denote a histogram of data divided into 1 sec bins. Red curve is a Poisson curve with rate = median count rate of data. |
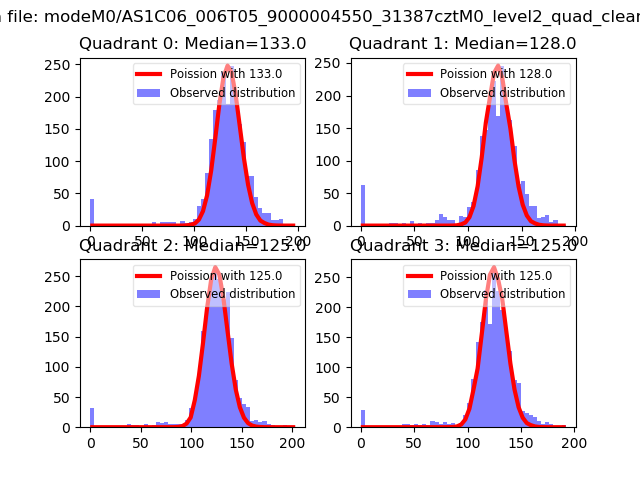 |
 |
| Quadrant-wise count rates Data is divided into 100 sec bins |
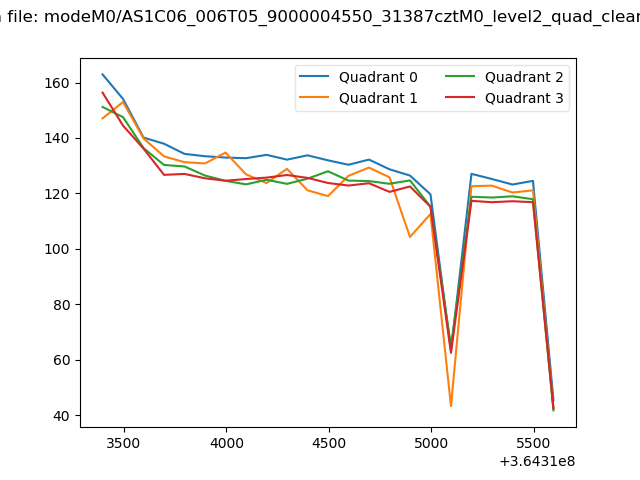 |
|
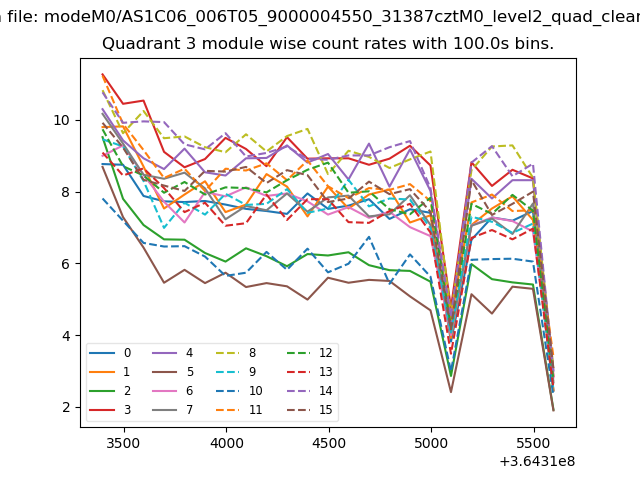
| Module-wise count rates for Quadrant A Data is divided into 100 sec bins |
 |
 |
| Module-wise count rates for Quadrant B Data is divided into 100 sec bins |
 |
 |
| Module-wise count rates for Quadrant C Data is divided into 100 sec bins |
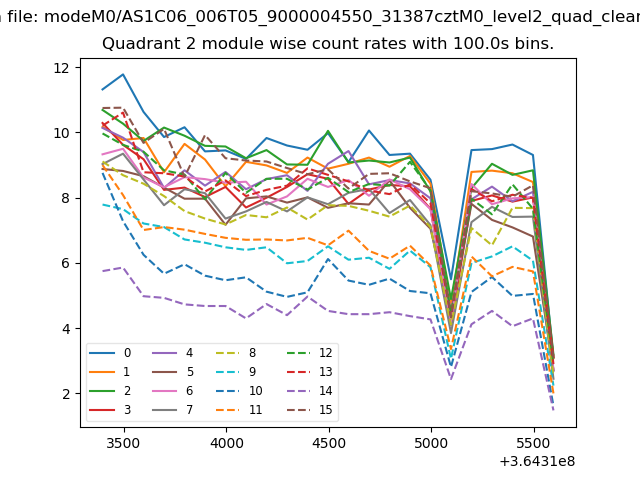 |
 |
| Module-wise count rates for Quadrant D Data is divided into 100 sec bins |
 |
 |
| Parameter | Plot |
|---|---|
| CZT HV Monitor |  |
| D_VDD | 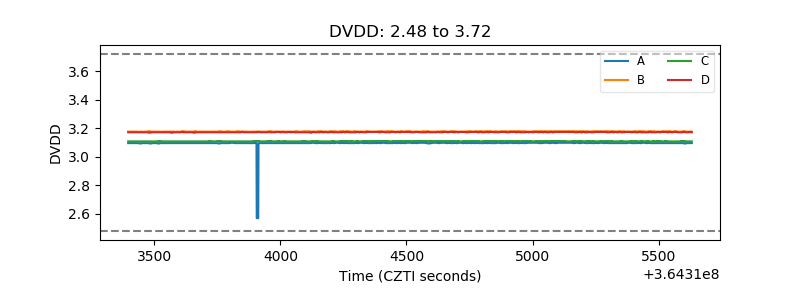 |
| Temperature 1 | 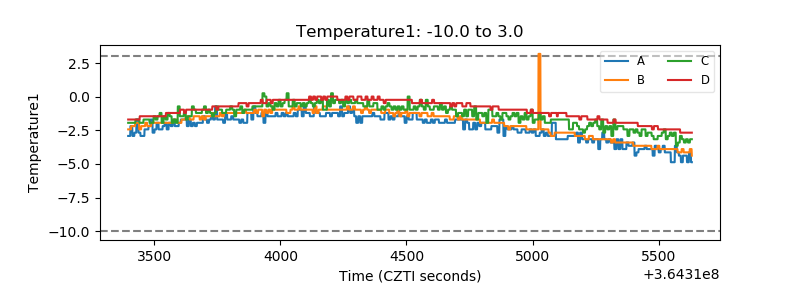 |
| Veto HV Monitor | 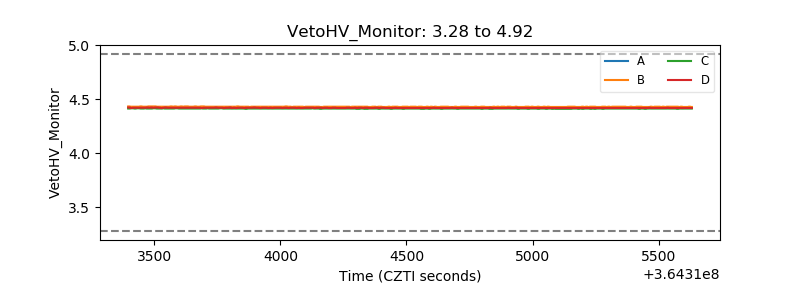 |
| Veto LLD | 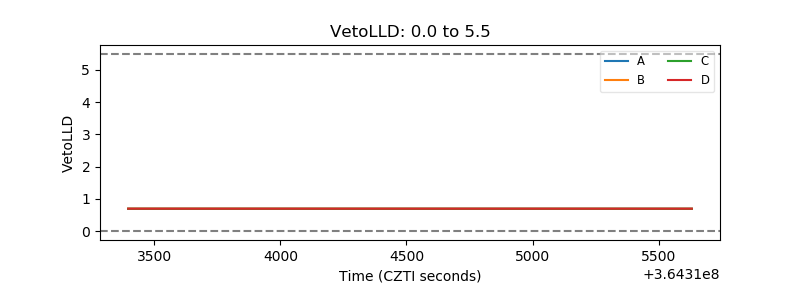 |
| Alpha Counter | 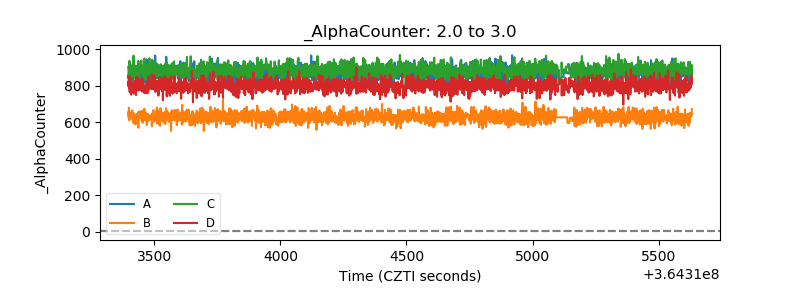 |
| _CPM_Rate | 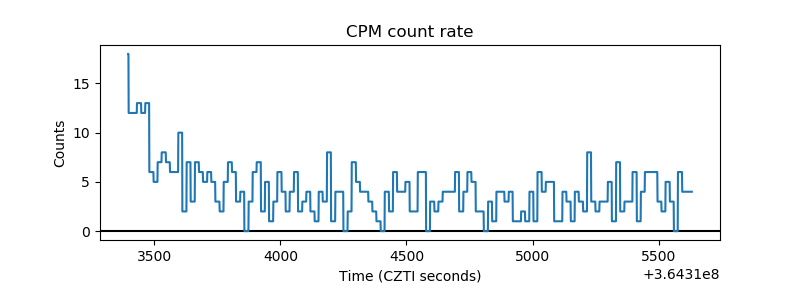 |
| CZT Counter | 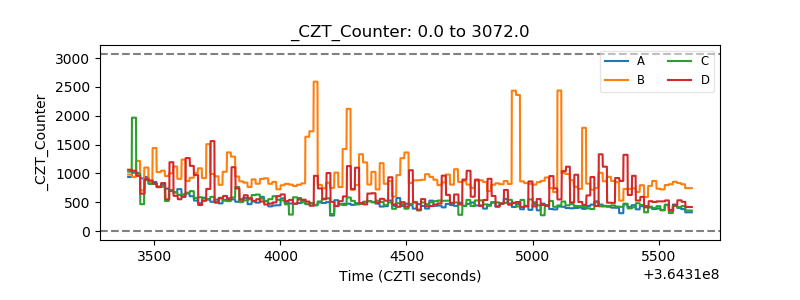 |
| +2.5 Volts monitor |  |
| +5 Volts monitor | 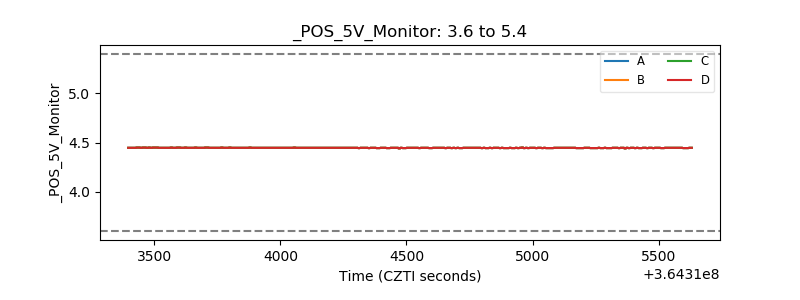 |
| _ROLL_ROT | 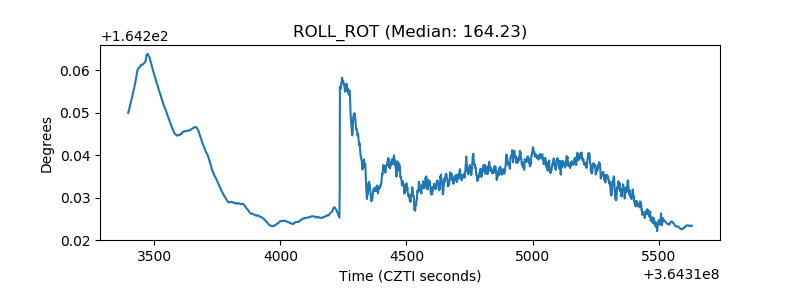 |
| _Roll_DEC | 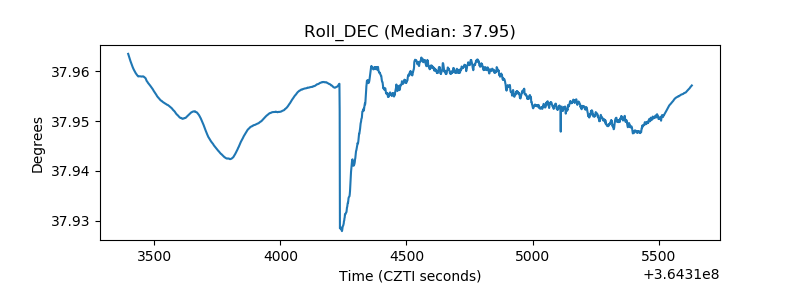 |
| _Roll_RA | 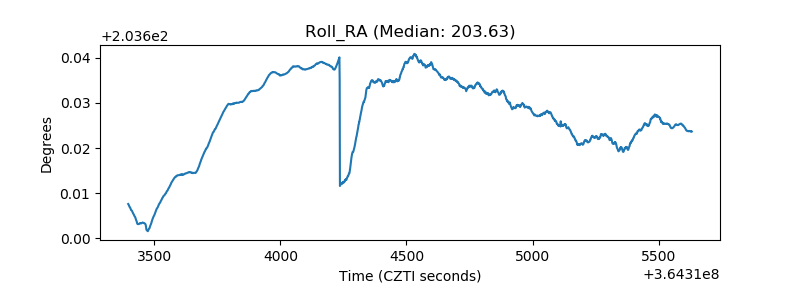 |
| Veto Counter | 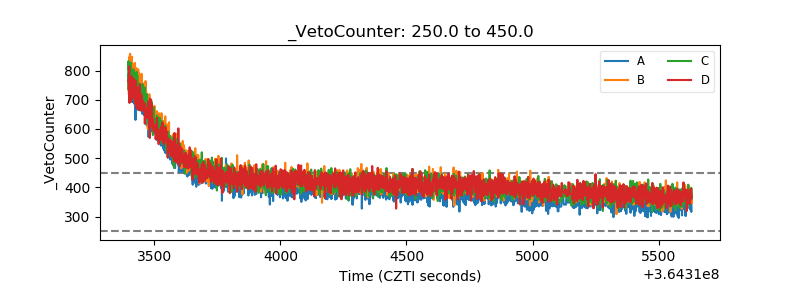 |