| Param | Original file | Final file |
|---|---|---|
| Filename | modeM0/AS1T04_027T01_9000004552cztM0_level2.fits | modeM0/AS1T04_027T01_9000004552cztM0_level2_quad_clean.evt |
| Size (bytes) | 445,394,880 | 356,048,640 |
| Size | 424.8 MB | 339.6 MB |
| Events in quadrant A | 2,781,308 | 2,040,376 |
| Events in quadrant B | 2,589,076 | 1,977,588 |
| Events in quadrant C | 2,663,534 | 1,914,613 |
| Events in quadrant D | 2,385,762 | 1,779,653 |
| Mode M9 | |||
|---|---|---|---|
| Quadrant | BADHDUFLAG | Total packets | Discarded packets |
| A | 0 | 65 | 0 |
| B | 0 | 65 | 0 |
| C | 0 | 65 | 0 |
| D | 0 | 65 | 0 |
| Mode SS | |||
|---|---|---|---|
| Quadrant | BADHDUFLAG | Total packets | Discarded packets |
| A | 0 | 908 | 0 |
| B | 0 | 908 | 0 |
| C | 0 | 908 | 0 |
| D | 0 | 908 | 0 |
| Mode M0 | |||
|---|---|---|---|
| Quadrant | BADHDUFLAG | Total packets | Discarded packets |
| A | 0 | 92633 | 0 |
| B | 0 | 138003 | 0 |
| C | 0 | 96996 | 0 |
| D | 0 | 105508 | 0 |
| Quadrant | Total seconds | Saturated seconds | Saturation percentage |
|---|---|---|---|
| A | 44713 | 319 | 0.713439% |
| B | 44737 | 1010 | 2.257639% |
| C | 44701 | 1054 | 2.357889% |
| D | 44732 | 500 | 1.117768% |
Noise dominated data is calculated using 1-second bins in cleaned event files. If a bin has >2000 counts, and if more than 50% of those come from <1% of pixels, then it is considered to be noise-dominated and hence unusable.
| Quadrant | # 1 sec bins | Bins with >0 counts | Bins with >2000 counts | High rate bins dominated by noise | Noise dominated (total time) | Noise dominated (detector-on time) | Marked lightcurve |
|---|---|---|---|---|---|---|---|
| A | 51427 | 44734 | 0 | 0 | 0.00% | 0.00% |  |
| B | 51427 | 44752 | 0 | 0 | 0.00% | 0.00% |  |
| C | 51427 | 44719 | 0 | 0 | 0.00% | 0.00% |  |
| D | 51427 | 44748 | 0 | 0 | 0.00% | 0.00% |  |
Top three noisy pixels from each quadrant. If the there are fewer than three noisy pixels in the level2.evt file, extra rows are filled as -1
| Pixel properties | Quadrant properties | ||||||
|---|---|---|---|---|---|---|---|
| Quadrant | DetID | PixID | Counts | Sigma | Mean | Median | Sigma |
| A | 0 | 29 | 2651 | 11.08 | 724 | 681 | 177.8 |
| A | 7 | 110 | 2279 | 8.99 | 724 | 681 | 177.8 |
| A | 9 | 19 | 2062 | 7.77 | 724 | 681 | 177.8 |
| B | 2 | 9 | 2060 | 10.36 | 685 | 655 | 135.6 |
| B | 2 | 8 | 1831 | 8.67 | 685 | 655 | 135.6 |
| B | 3 | 80 | 1735 | 7.96 | 685 | 655 | 135.6 |
| C | 12 | 241 | 1923 | 7.07 | 706 | 660 | 178.5 |
| C | 3 | 187 | 1782 | 6.28 | 706 | 660 | 178.5 |
| C | 3 | 126 | 1779 | 6.27 | 706 | 660 | 178.5 |
| D | 3 | 14 | 1745 | 6.15 | 681 | 623 | 182.6 |
| D | 10 | 189 | 1695 | 5.87 | 681 | 623 | 182.6 |
| D | 6 | 67 | 1688 | 5.83 | 681 | 623 | 182.6 |
Histogram calculated using DETX and DETY for each event in the final _common_clean file
| Quadrant A | 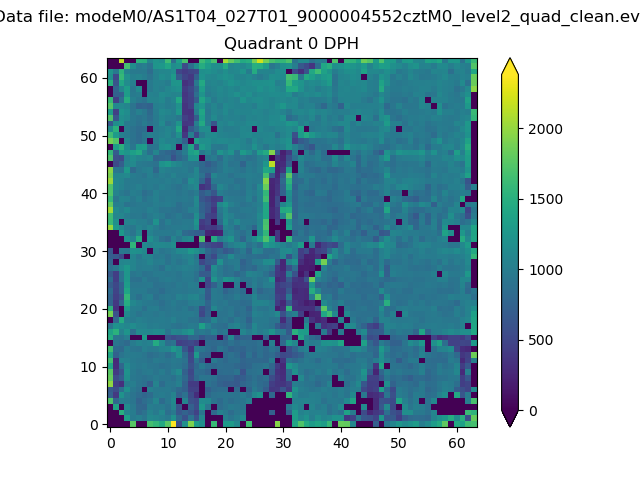 |
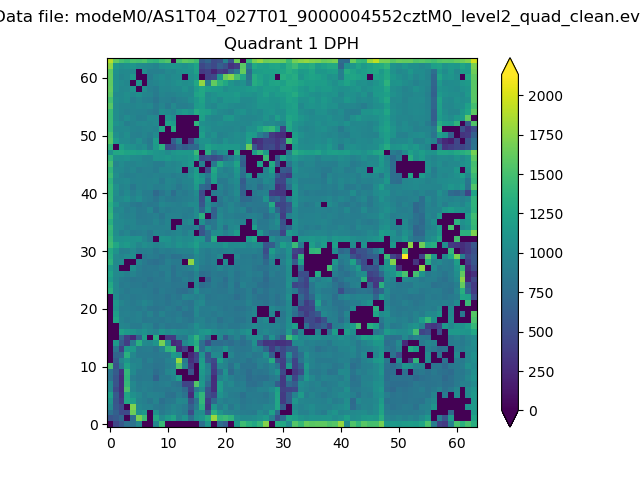 |
Quadrant B |
|---|---|---|---|
| Quadrant D |  |
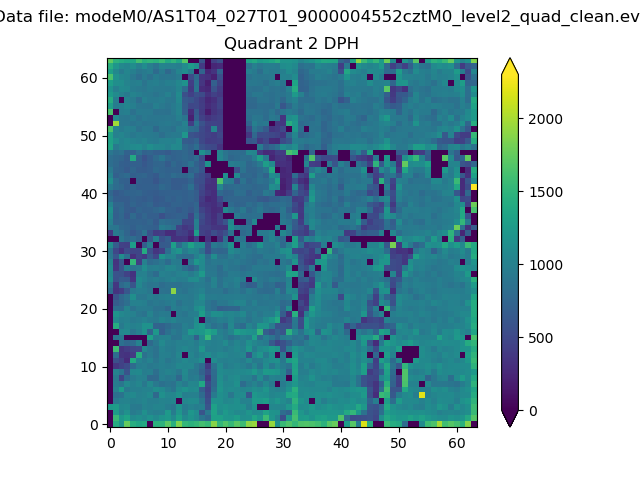 |
Quadrant C |
| Plot type | Count rate plots | Images |
|---|---|---|
| Comparison with Poisson distribution Blue bars denote a histogram of data divided into 1 sec bins. Red curve is a Poisson curve with rate = median count rate of data. |
 |
 |
| Quadrant-wise count rates Data is divided into 100 sec bins |
 |
|
| Module-wise count rates for Quadrant A Data is divided into 100 sec bins |
 |
 |
| Module-wise count rates for Quadrant B Data is divided into 100 sec bins |
 |
 |
| Module-wise count rates for Quadrant C Data is divided into 100 sec bins |
 |
 |
| Module-wise count rates for Quadrant D Data is divided into 100 sec bins |
 |
 |
| Parameter | Plot |
|---|---|
| CZT HV Monitor |  |
| D_VDD |  |
| Temperature 1 |  |
| Veto HV Monitor |  |
| Veto LLD |  |
| Alpha Counter |  |
| _CPM_Rate |  |
| CZT Counter |  |
| +2.5 Volts monitor |  |
| +5 Volts monitor |  |
| _ROLL_ROT |  |
| _Roll_DEC |  |
| _Roll_RA |  |
| Veto Counter |  |