| Param | Original file | Final file |
|---|---|---|
| Filename | modeM0/AS1T04_027T01_9000004552_31387cztM0_level2.evt | modeM0/AS1T04_027T01_9000004552_31387cztM0_level2_quad_clean.evt |
| Size (bytes) | 387,993,600 | 57,294,720 |
| Size | 370.0 MB | 54.6 MB |
| Events in quadrant A | 2,336,581 | 362,400 |
| Events in quadrant B | 3,955,440 | 350,478 |
| Events in quadrant C | 2,441,363 | 347,736 |
| Events in quadrant D | 2,696,273 | 342,883 |
| Mode SS | |||
|---|---|---|---|
| Quadrant | BADHDUFLAG | Total packets | Discarded packets |
| A | 0 | 96 | 0 |
| B | 0 | 96 | 0 |
| C | 0 | 96 | 0 |
| D | 0 | 96 | 0 |
| Mode M0 | |||
|---|---|---|---|
| Quadrant | BADHDUFLAG | Total packets | Discarded packets |
| A | 0 | 9899 | 1 |
| B | 0 | 15075 | 1 |
| C | 0 | 10157 | 1 |
| D | 0 | 11094 | 1 |
| Quadrant | Total seconds | Saturated seconds | Saturation percentage |
|---|---|---|---|
| A | 4708 | 134 | 2.846219% |
| B | 4708 | 336 | 7.136788% |
| C | 4708 | 158 | 3.355990% |
| D | 4708 | 114 | 2.421410% |
Noise dominated data is calculated using 1-second bins in cleaned event files. If a bin has >2000 counts, and if more than 50% of those come from <1% of pixels, then it is considered to be noise-dominated and hence unusable.
| Quadrant | # 1 sec bins | Bins with >0 counts | Bins with >2000 counts | High rate bins dominated by noise | Noise dominated (total time) | Noise dominated (detector-on time) | Marked lightcurve |
|---|---|---|---|---|---|---|---|
| A | 4778 | 4709 | 0 | 0 | 0.00% | 0.00% |  |
| B | 4778 | 4709 | 60 | 60 | 1.26% | 1.27% |  |
| C | 4778 | 4709 | 1 | 1 | 0.02% | 0.02% |  |
| D | 4778 | 4709 | 18 | 18 | 0.38% | 0.38% |  |
Top three noisy pixels from each quadrant. If the there are fewer than three noisy pixels in the level2.evt file, extra rows are filled as -1
| Pixel properties | Quadrant properties | ||||||
|---|---|---|---|---|---|---|---|
| Quadrant | DetID | PixID | Counts | Sigma | Mean | Median | Sigma |
| A | 13 | 254 | 8947 | 68.17 | 605 | 591 | 122.6 |
| A | 3 | 137 | 6438 | 47.7 | 605 | 591 | 122.6 |
| A | 0 | 226 | 5090 | 36.7 | 605 | 591 | 122.6 |
| B | 6 | 159 | 1304927 | 11397.17 | 588 | 572 | 114.4 |
| B | 5 | 172 | 220434 | 1921.11 | 588 | 572 | 114.4 |
| B | 15 | 33 | 31653 | 271.58 | 588 | 572 | 114.4 |
| C | 14 | 238 | 93359 | 683.28 | 576 | 578 | 135.8 |
| C | 3 | 233 | 56845 | 414.38 | 576 | 578 | 135.8 |
| C | 0 | 10 | 25860 | 186.19 | 576 | 578 | 135.8 |
| D | 8 | 195 | 371972 | 2626.01 | 585 | 568 | 141.4 |
| D | 2 | 250 | 49863 | 348.54 | 585 | 568 | 141.4 |
| D | 13 | 249 | 34648 | 240.96 | 585 | 568 | 141.4 |
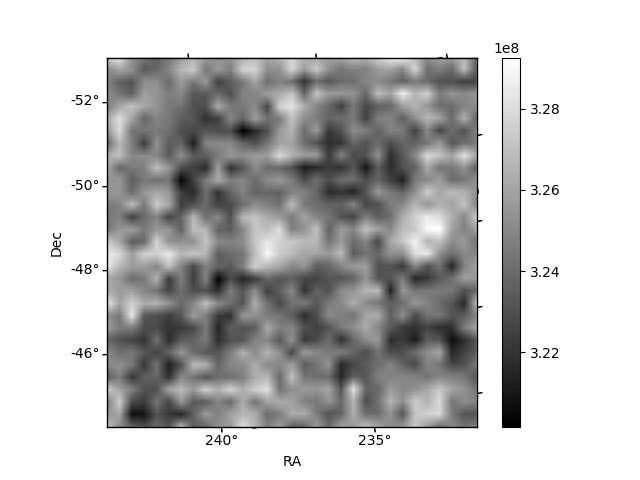
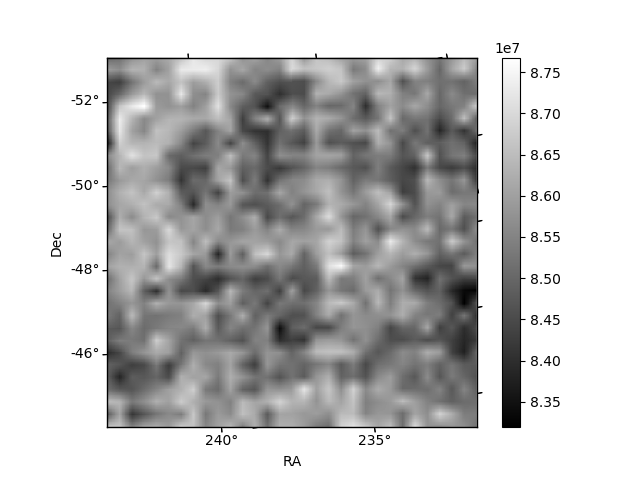
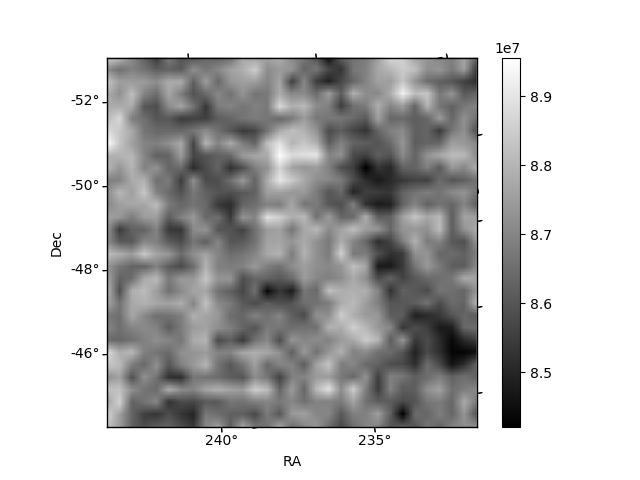
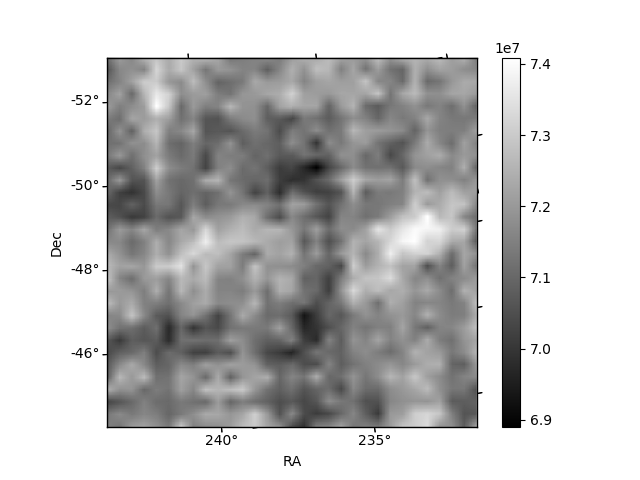
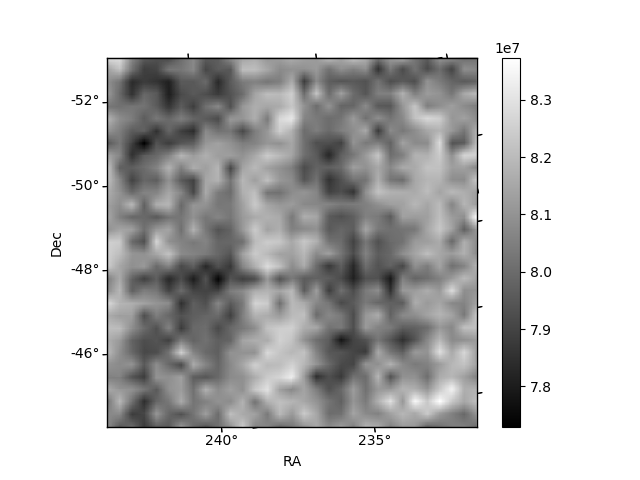
Histogram calculated using DETX and DETY for each event in the final _common_clean file
| Quadrant A | 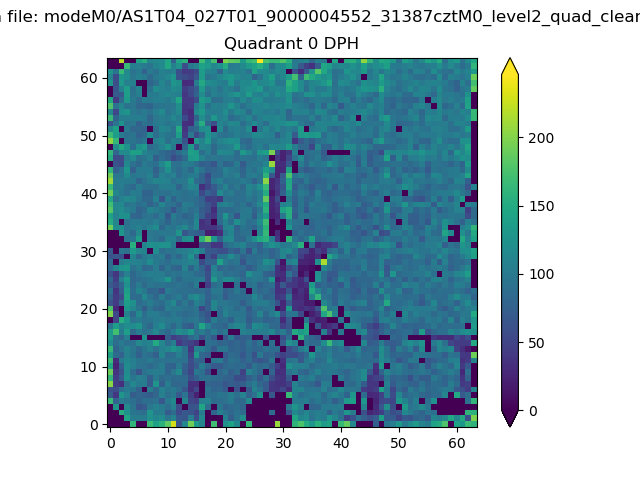 |
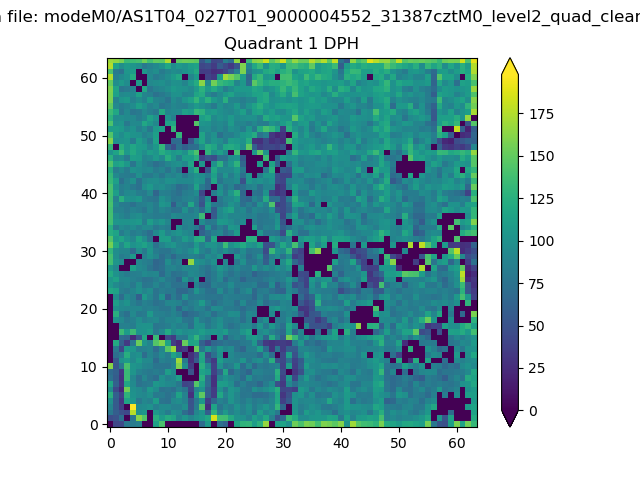 |
Quadrant B |
|---|---|---|---|
| Quadrant D |  |
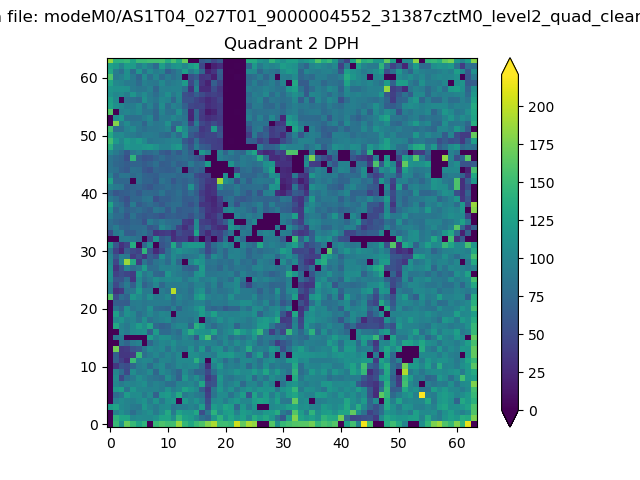 |
Quadrant C |
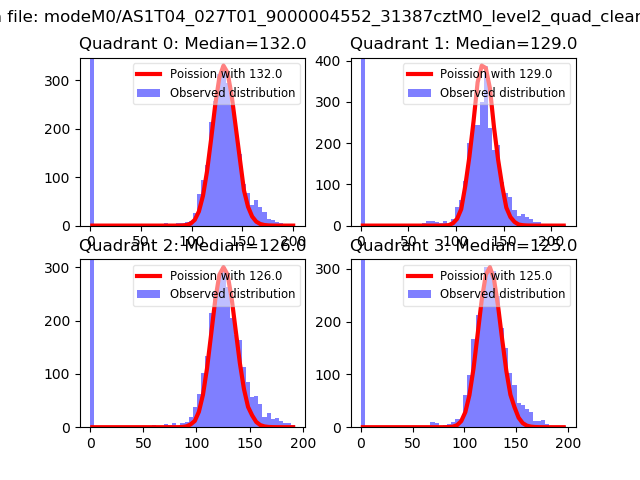
| Plot type | Count rate plots | Images |
|---|---|---|
| Comparison with Poisson distribution Blue bars denote a histogram of data divided into 1 sec bins. Red curve is a Poisson curve with rate = median count rate of data. |
 |
 |
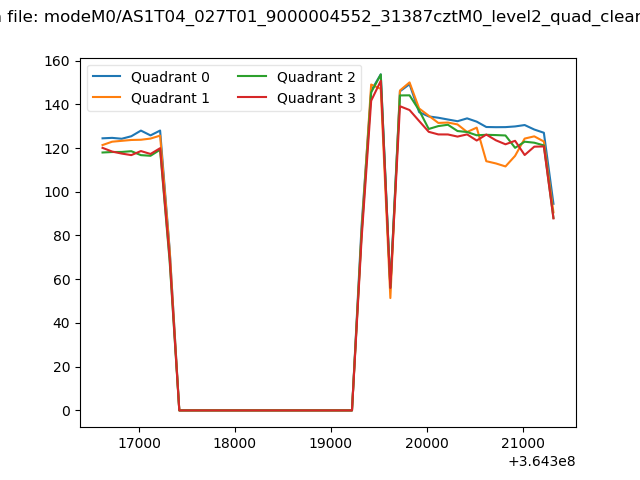
| Quadrant-wise count rates Data is divided into 100 sec bins |
 |
|
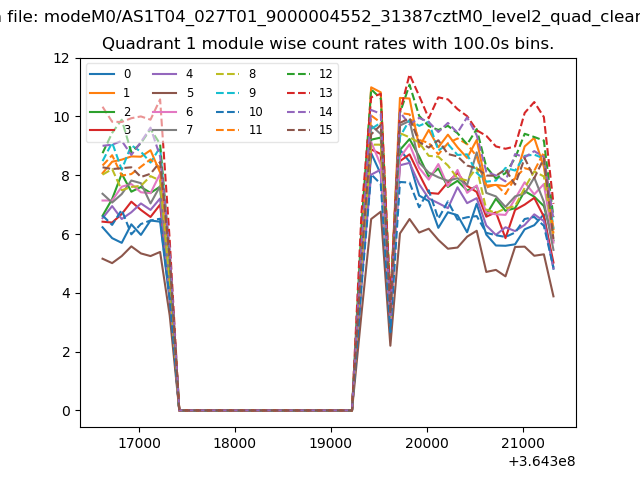
| Module-wise count rates for Quadrant A Data is divided into 100 sec bins |
 |
 |
| Module-wise count rates for Quadrant B Data is divided into 100 sec bins |
 |
 |
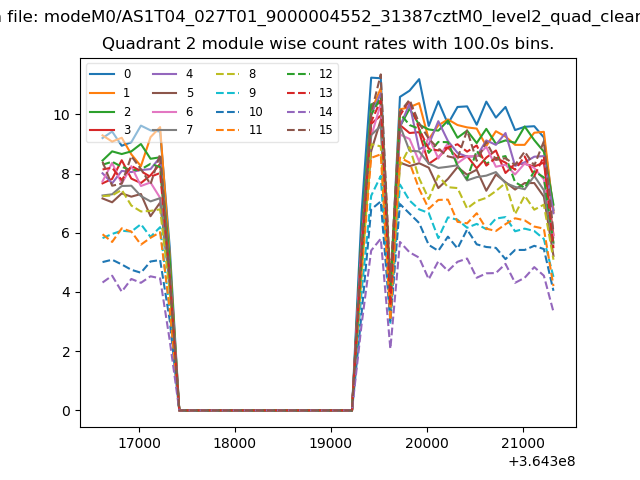
| Module-wise count rates for Quadrant C Data is divided into 100 sec bins |
 |
 |
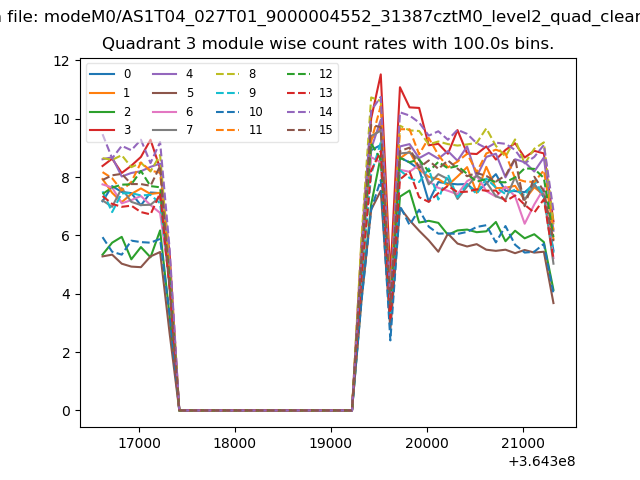
| Module-wise count rates for Quadrant D Data is divided into 100 sec bins |
 |
 |
| Parameter | Plot |
|---|---|
| CZT HV Monitor | 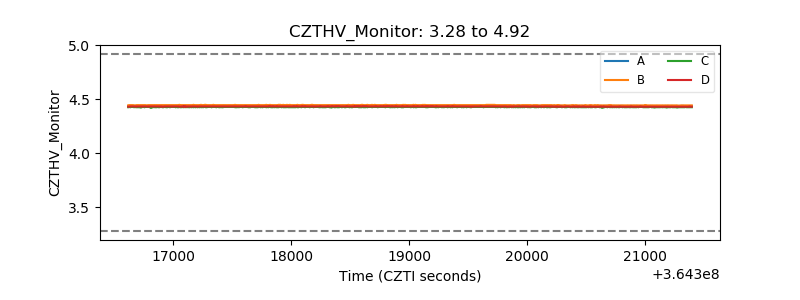 |
| D_VDD | 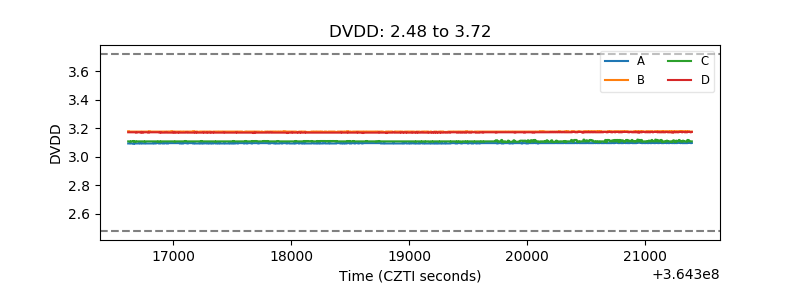 |
| Temperature 1 |  |
| Veto HV Monitor | 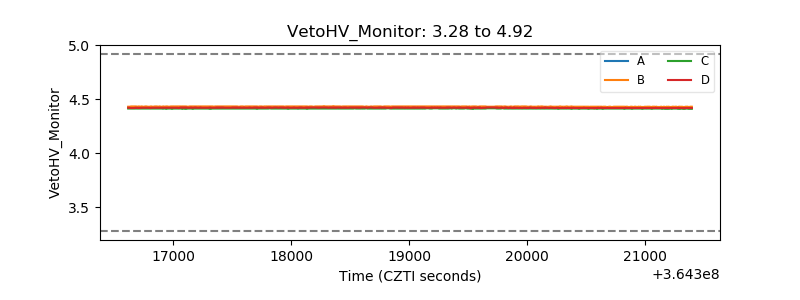 |
| Veto LLD | 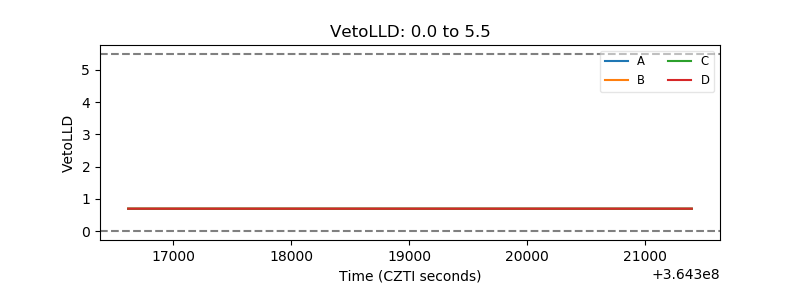 |
| Alpha Counter | 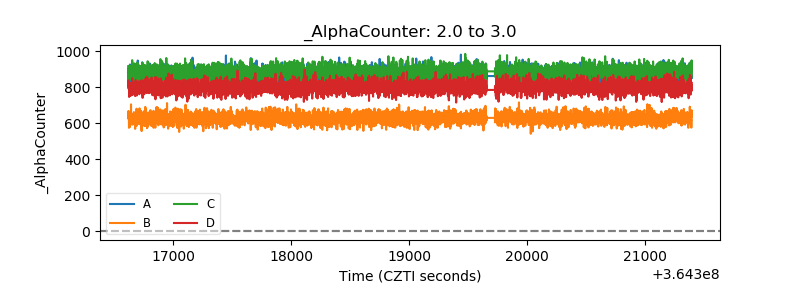 |
| _CPM_Rate | 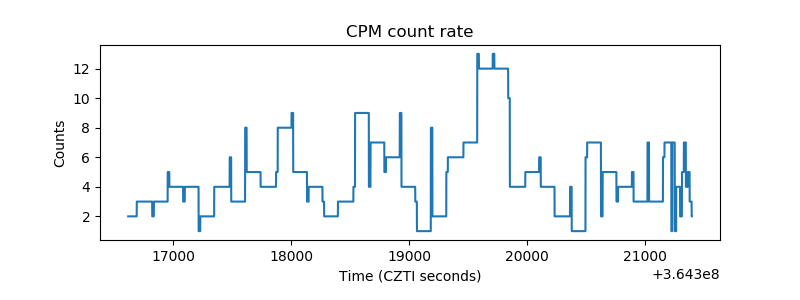 |
| CZT Counter | 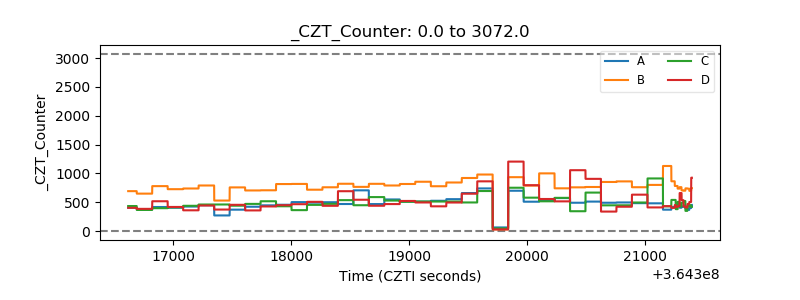 |
| +2.5 Volts monitor | 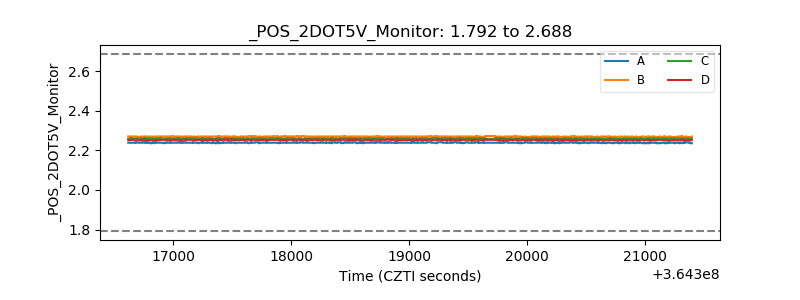 |
| +5 Volts monitor |  |
| _ROLL_ROT | 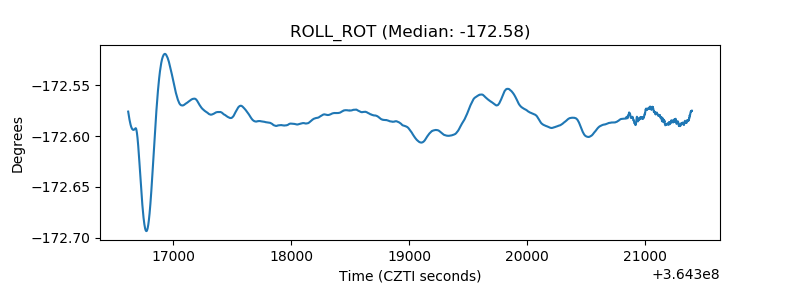 |
| _Roll_DEC | 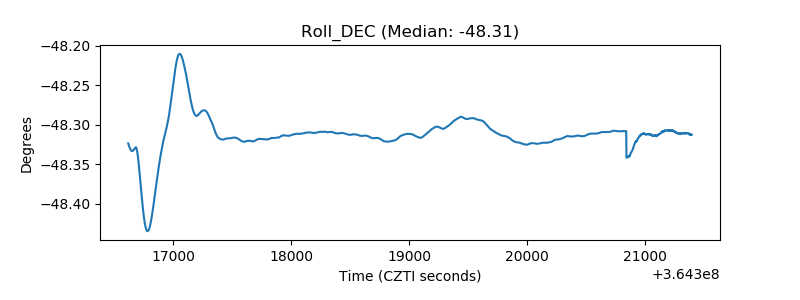 |
| _Roll_RA | 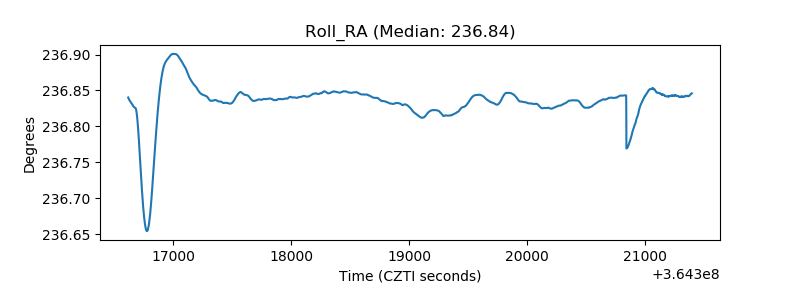 |
| Veto Counter | 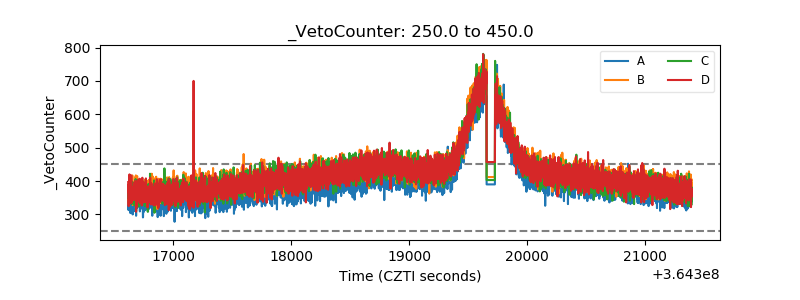 |