| Param | Original file | Final file |
|---|---|---|
| Filename | modeM0/AS1T04_027T01_9000004552_31388cztM0_level2.evt | modeM0/AS1T04_027T01_9000004552_31388cztM0_level2_quad_clean.evt |
| Size (bytes) | 617,028,480 | 109,373,760 |
| Size | 588.4 MB | 104.3 MB |
| Events in quadrant A | 3,589,838 | 718,772 |
| Events in quadrant B | 6,228,926 | 697,340 |
| Events in quadrant C | 3,976,585 | 689,355 |
| Events in quadrant D | 4,381,012 | 682,559 |
| Mode M9 | |||
|---|---|---|---|
| Quadrant | BADHDUFLAG | Total packets | Discarded packets |
| A | 0 | 4 | 0 |
| B | 0 | 4 | 0 |
| C | 0 | 4 | 0 |
| D | 0 | 4 | 0 |
| Mode SS | |||
|---|---|---|---|
| Quadrant | BADHDUFLAG | Total packets | Discarded packets |
| A | 0 | 152 | 0 |
| B | 0 | 152 | 0 |
| C | 0 | 152 | 0 |
| D | 0 | 152 | 0 |
| Mode M0 | |||
|---|---|---|---|
| Quadrant | BADHDUFLAG | Total packets | Discarded packets |
| A | 0 | 15605 | 2 |
| B | 0 | 24018 | 2 |
| C | 0 | 16778 | 3 |
| D | 0 | 18144 | 2 |
| Quadrant | Total seconds | Saturated seconds | Saturation percentage |
|---|---|---|---|
| A | 7539 | 87 | 1.153999% |
| B | 7540 | 342 | 4.535809% |
| C | 7539 | 137 | 1.817217% |
| D | 7539 | 92 | 1.220321% |
Noise dominated data is calculated using 1-second bins in cleaned event files. If a bin has >2000 counts, and if more than 50% of those come from <1% of pixels, then it is considered to be noise-dominated and hence unusable.
| Quadrant | # 1 sec bins | Bins with >0 counts | Bins with >2000 counts | High rate bins dominated by noise | Noise dominated (total time) | Noise dominated (detector-on time) | Marked lightcurve |
|---|---|---|---|---|---|---|---|
| A | 7914 | 7540 | 3 | 3 | 0.04% | 0.04% | 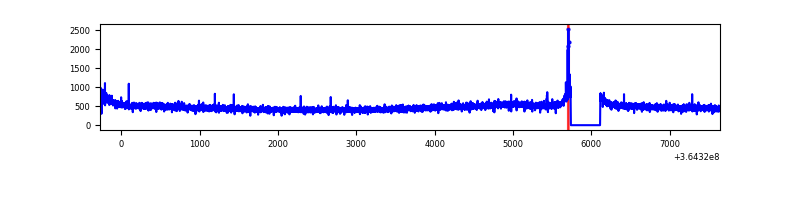 |
| B | 7915 | 7541 | 120 | 120 | 1.52% | 1.59% |  |
| C | 7914 | 7540 | 4 | 4 | 0.05% | 0.05% | 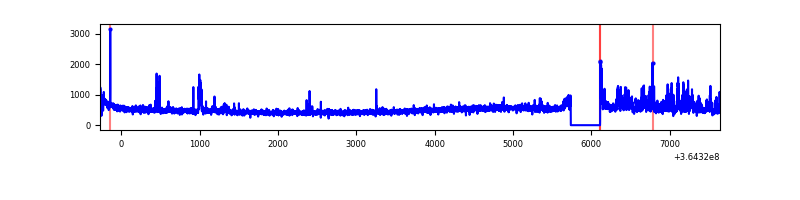 |
| D | 7914 | 7540 | 33 | 33 | 0.42% | 0.44% | 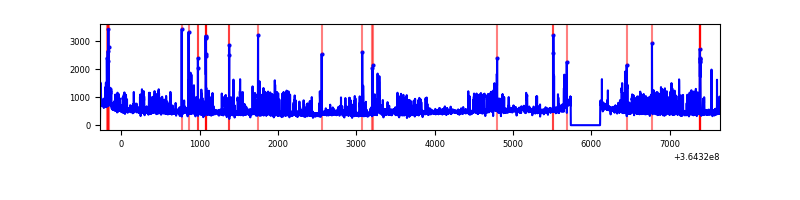 |
Top three noisy pixels from each quadrant. If the there are fewer than three noisy pixels in the level2.evt file, extra rows are filled as -1
| Pixel properties | Quadrant properties | ||||||
|---|---|---|---|---|---|---|---|
| Quadrant | DetID | PixID | Counts | Sigma | Mean | Median | Sigma |
| A | 5 | 16 | 21696 | 112.08 | 923 | 901 | 185.5 |
| A | 13 | 254 | 14844 | 75.15 | 923 | 901 | 185.5 |
| A | 3 | 137 | 9678 | 47.31 | 923 | 901 | 185.5 |
| B | 6 | 159 | 2082651 | 12020.71 | 898 | 876 | 173.2 |
| B | 5 | 172 | 397557 | 2290.54 | 898 | 876 | 173.2 |
| B | 4 | 80 | 53790 | 305.54 | 898 | 876 | 173.2 |
| C | 3 | 233 | 336991 | 1642.81 | 872 | 877 | 204.6 |
| C | 14 | 238 | 140785 | 683.82 | 872 | 877 | 204.6 |
| C | 0 | 10 | 44506 | 213.24 | 872 | 877 | 204.6 |
| D | 8 | 195 | 768325 | 3628.68 | 888 | 865 | 211.5 |
| D | 2 | 250 | 90849 | 425.46 | 888 | 865 | 211.5 |
| D | 13 | 249 | 80684 | 377.4 | 888 | 865 | 211.5 |
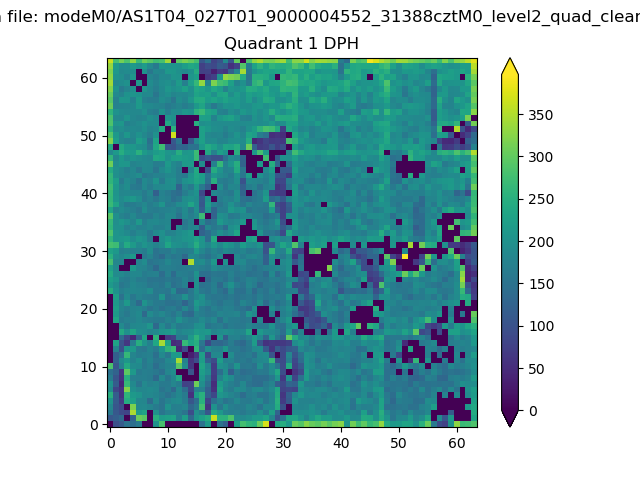
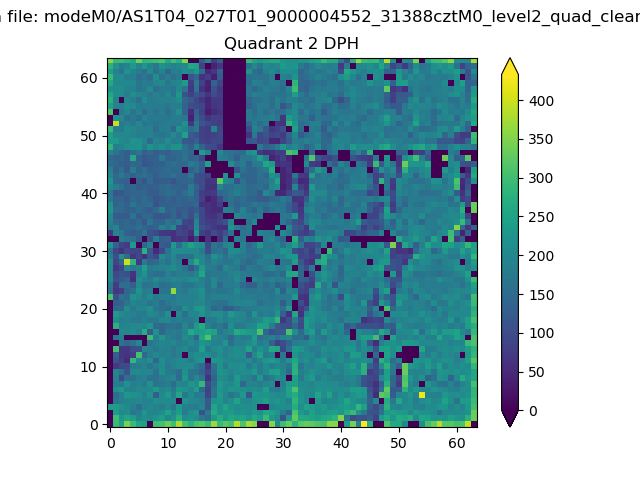
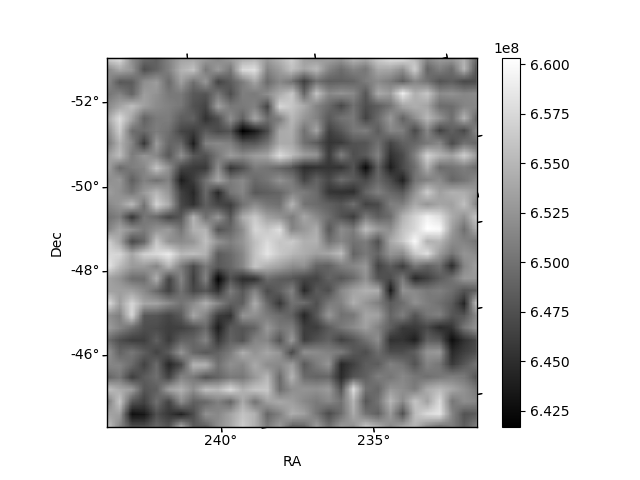
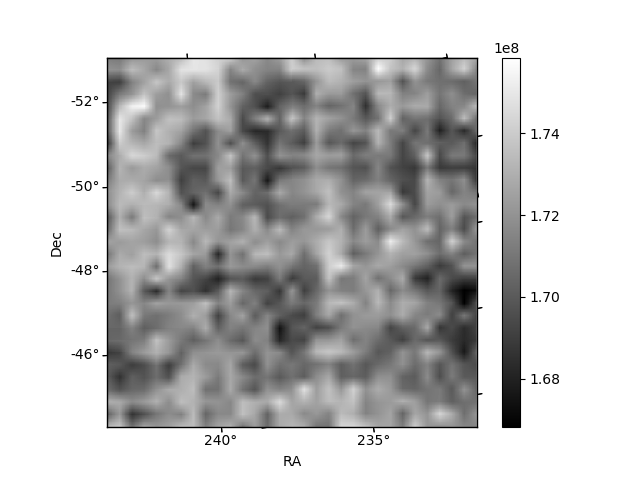
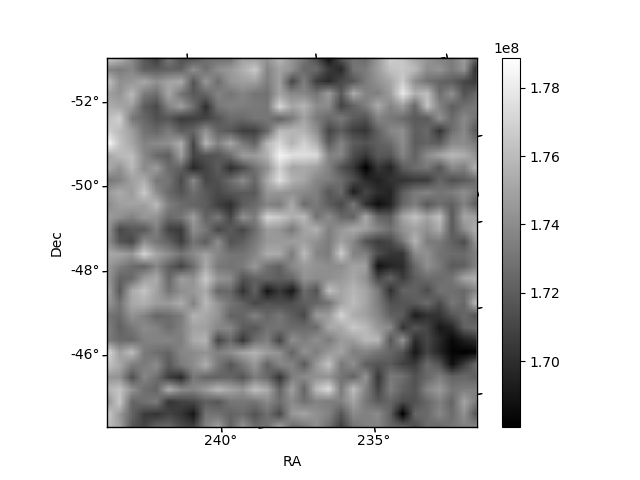
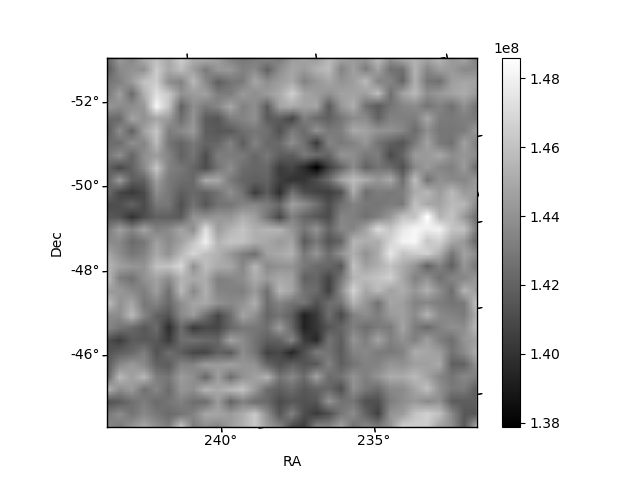
Histogram calculated using DETX and DETY for each event in the final _common_clean file
| Quadrant A | 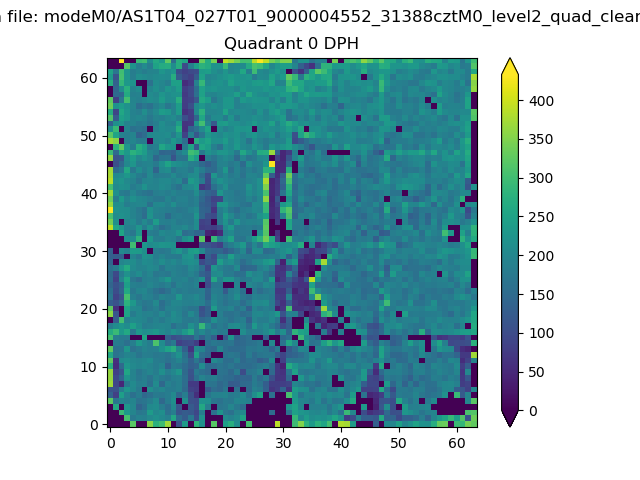 |
 |
Quadrant B |
|---|---|---|---|
| Quadrant D | 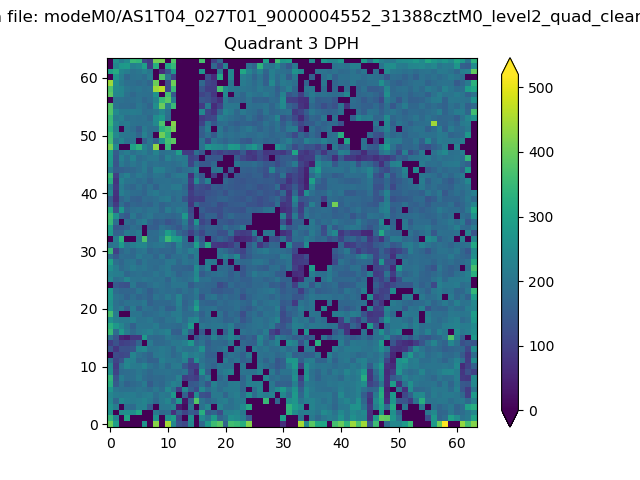 |
 |
Quadrant C |
| Plot type | Count rate plots | Images |
|---|---|---|
| Comparison with Poisson distribution Blue bars denote a histogram of data divided into 1 sec bins. Red curve is a Poisson curve with rate = median count rate of data. |
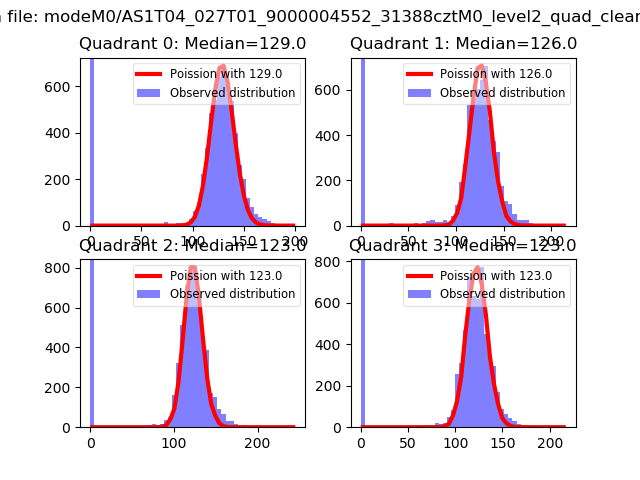 |
 |
| Quadrant-wise count rates Data is divided into 100 sec bins |
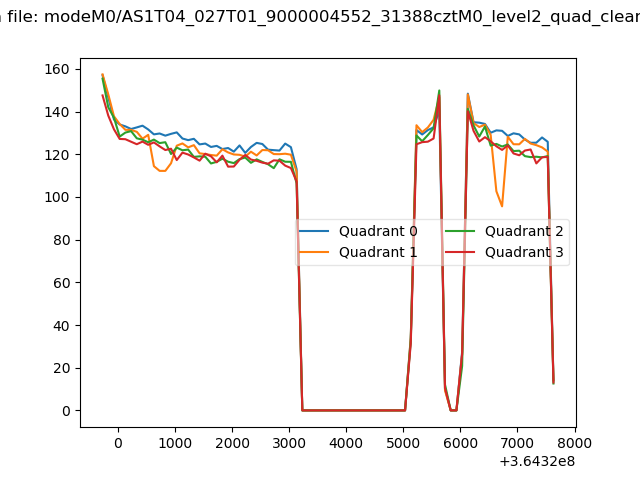 |
|
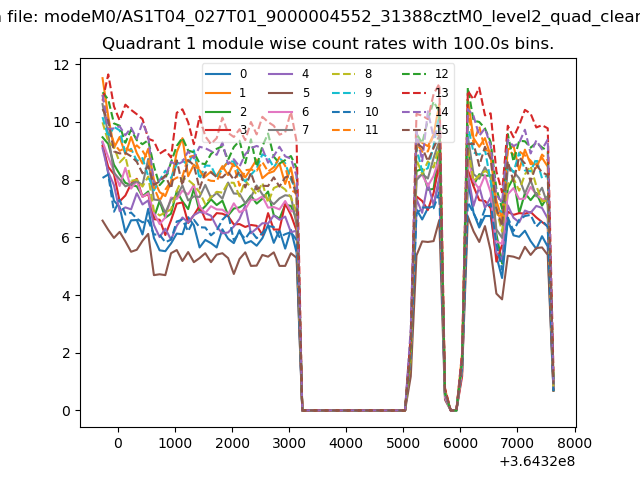
| Module-wise count rates for Quadrant A Data is divided into 100 sec bins |
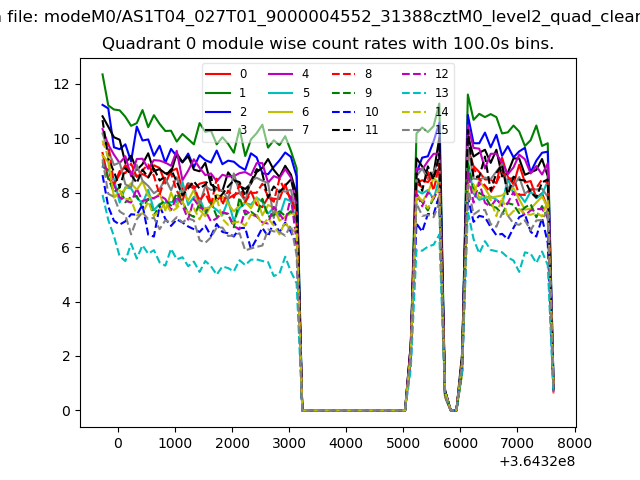 |
 |
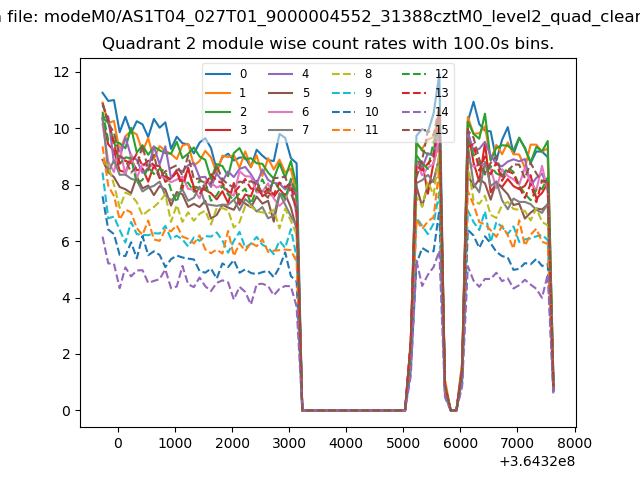
| Module-wise count rates for Quadrant B Data is divided into 100 sec bins |
 |
 |
| Module-wise count rates for Quadrant C Data is divided into 100 sec bins |
 |
 |
| Module-wise count rates for Quadrant D Data is divided into 100 sec bins |
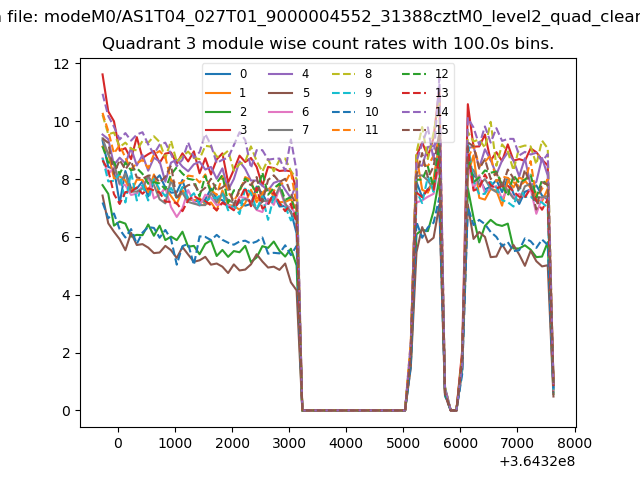 |
 |
| Parameter | Plot |
|---|---|
| CZT HV Monitor | 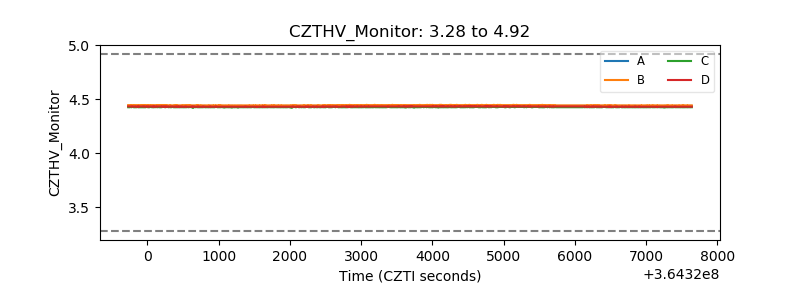 |
| D_VDD | 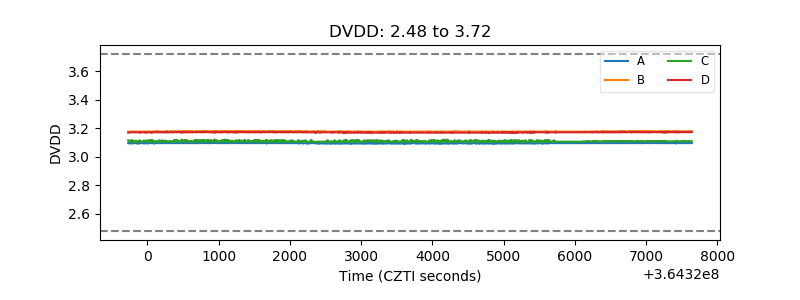 |
| Temperature 1 |  |
| Veto HV Monitor | 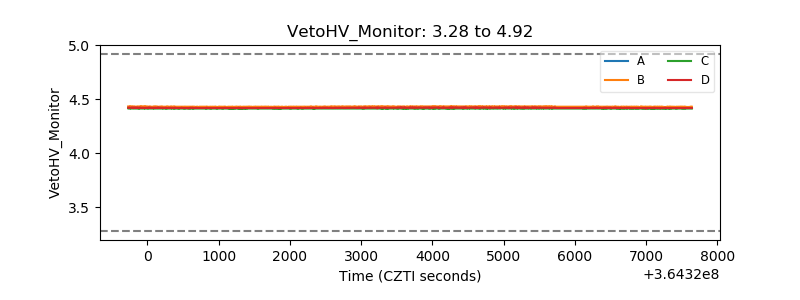 |
| Veto LLD | 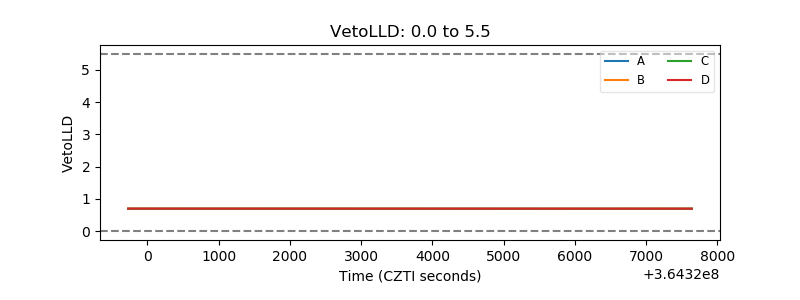 |
| Alpha Counter | 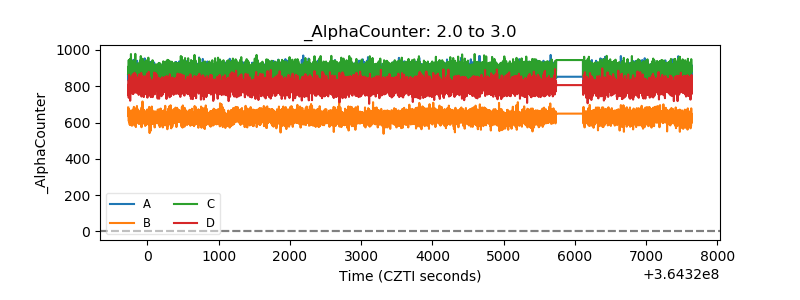 |
| _CPM_Rate | 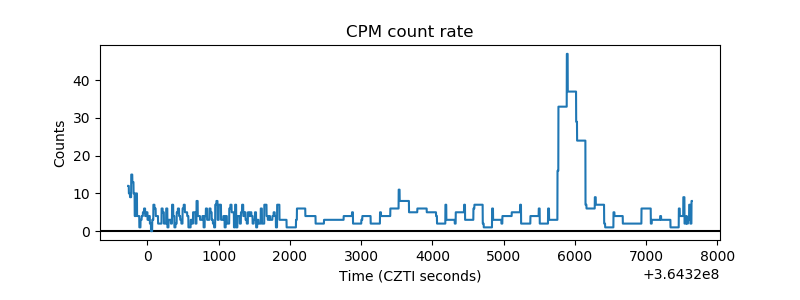 |
| CZT Counter | 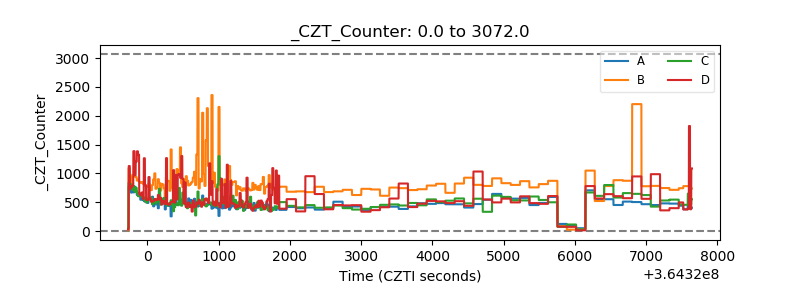 |
| +2.5 Volts monitor |  |
| +5 Volts monitor |  |
| _ROLL_ROT | 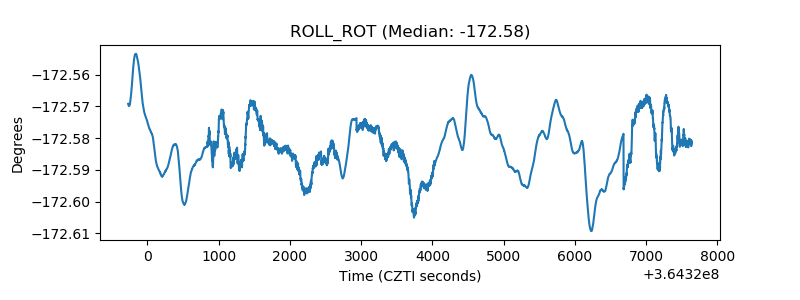 |
| _Roll_DEC | 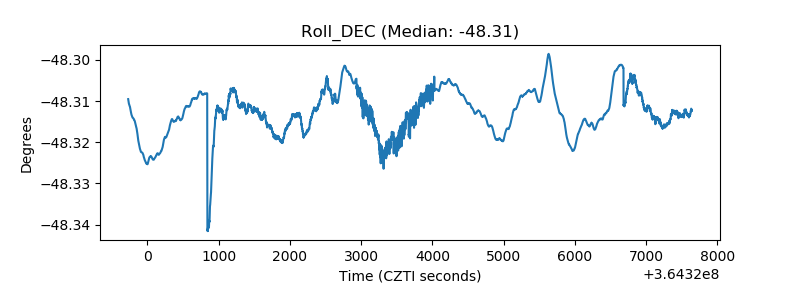 |
| _Roll_RA | 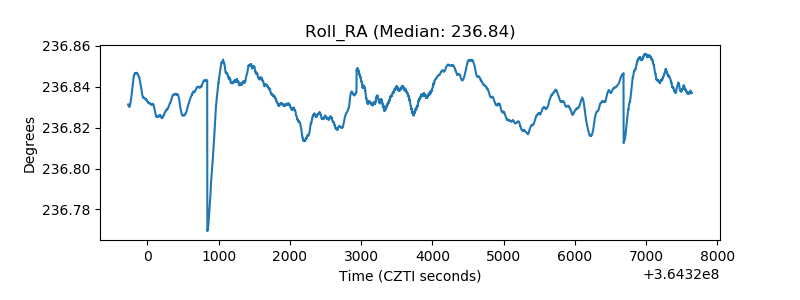 |
| Veto Counter | 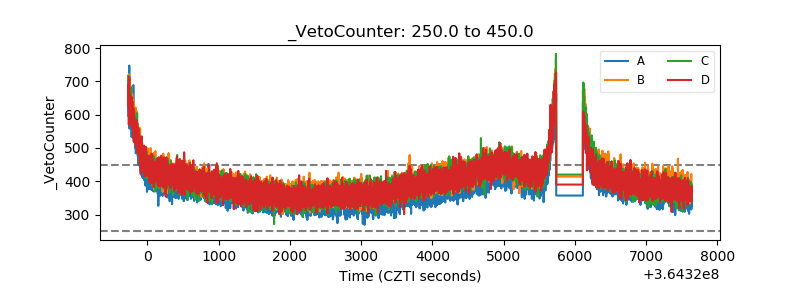 |