| Param | Original file | Final file |
|---|---|---|
| Filename | modeM0/AS1T04_027T01_9000004552_31394cztM0_level2.evt | modeM0/AS1T04_027T01_9000004552_31394cztM0_level2_quad_clean.evt |
| Size (bytes) | 459,659,520 | 70,781,760 |
| Size | 438.4 MB | 67.5 MB |
| Events in quadrant A | 2,775,600 | 444,193 |
| Events in quadrant B | 4,485,125 | 446,327 |
| Events in quadrant C | 3,013,687 | 430,127 |
| Events in quadrant D | 3,260,614 | 424,978 |
| Mode M9 | |||
|---|---|---|---|
| Quadrant | BADHDUFLAG | Total packets | Discarded packets |
| A | 0 | 12 | 0 |
| B | 0 | 12 | 0 |
| C | 0 | 12 | 0 |
| D | 0 | 12 | 0 |
| Mode SS | |||
|---|---|---|---|
| Quadrant | BADHDUFLAG | Total packets | Discarded packets |
| A | 0 | 120 | 4 |
| B | 0 | 121 | 5 |
| C | 0 | 121 | 5 |
| D | 0 | 121 | 5 |
| Mode M0 | |||
|---|---|---|---|
| Quadrant | BADHDUFLAG | Total packets | Discarded packets |
| A | 0 | 12294 | 568 |
| B | 0 | 18125 | 808 |
| C | 0 | 13024 | 683 |
| D | 0 | 13964 | 649 |
| Quadrant | Total seconds | Saturated seconds | Saturation percentage |
|---|---|---|---|
| A | 5688 | 11 | 0.193390% |
| B | 5684 | 41 | 0.721323% |
| C | 5682 | 125 | 2.199930% |
| D | 5686 | 48 | 0.844179% |
Noise dominated data is calculated using 1-second bins in cleaned event files. If a bin has >2000 counts, and if more than 50% of those come from <1% of pixels, then it is considered to be noise-dominated and hence unusable.
| Quadrant | # 1 sec bins | Bins with >0 counts | Bins with >2000 counts | High rate bins dominated by noise | Noise dominated (total time) | Noise dominated (detector-on time) | Marked lightcurve |
|---|---|---|---|---|---|---|---|
| A | 7236 | 5698 | 0 | 0 | 0.00% | 0.00% | 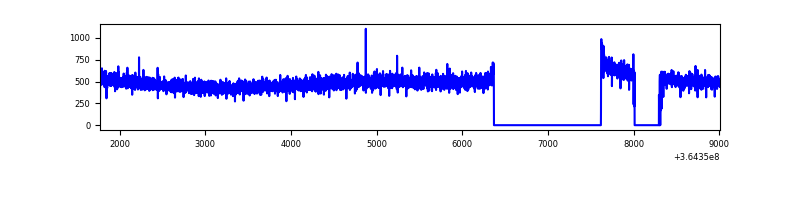 |
| B | 7237 | 5695 | 2 | 2 | 0.03% | 0.04% | 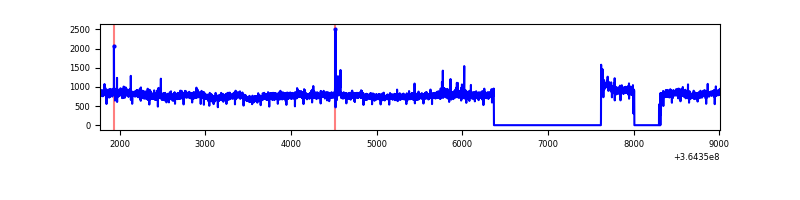 |
| C | 7237 | 5695 | 20 | 20 | 0.28% | 0.35% | 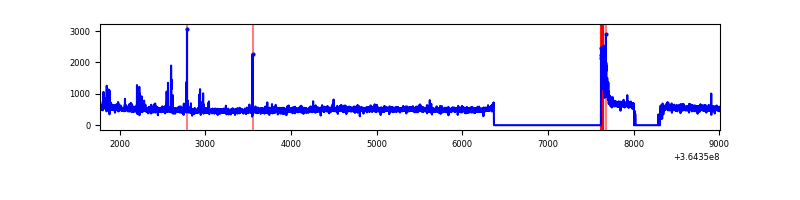 |
| D | 7237 | 5697 | 33 | 33 | 0.46% | 0.58% | 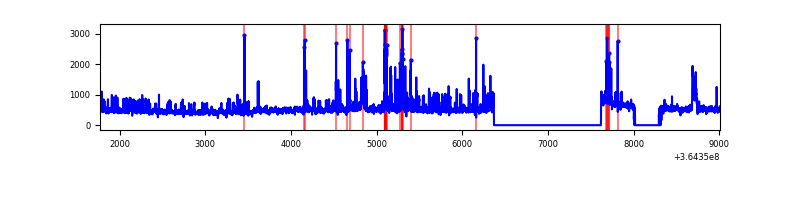 |
Top three noisy pixels from each quadrant. If the there are fewer than three noisy pixels in the level2.evt file, extra rows are filled as -1
| Pixel properties | Quadrant properties | ||||||
|---|---|---|---|---|---|---|---|
| Quadrant | DetID | PixID | Counts | Sigma | Mean | Median | Sigma |
| A | 13 | 254 | 12413 | 82.02 | 718 | 705 | 142.7 |
| A | 3 | 137 | 6962 | 43.83 | 718 | 705 | 142.7 |
| A | 0 | 226 | 5934 | 36.63 | 718 | 705 | 142.7 |
| B | 6 | 159 | 1597932 | 11738.91 | 716 | 699 | 136.1 |
| B | 4 | 80 | 32228 | 231.72 | 716 | 699 | 136.1 |
| B | 0 | 190 | 24201 | 172.73 | 716 | 699 | 136.1 |
| C | 14 | 238 | 134479 | 841.43 | 690 | 696 | 159.0 |
| C | 0 | 10 | 115802 | 723.96 | 690 | 696 | 159.0 |
| C | 14 | 254 | 28593 | 175.46 | 690 | 696 | 159.0 |
| D | 8 | 195 | 248131 | 1424.37 | 691 | 678 | 173.7 |
| D | 2 | 250 | 128309 | 734.66 | 691 | 678 | 173.7 |
| D | 10 | 203 | 111538 | 638.12 | 691 | 678 | 173.7 |
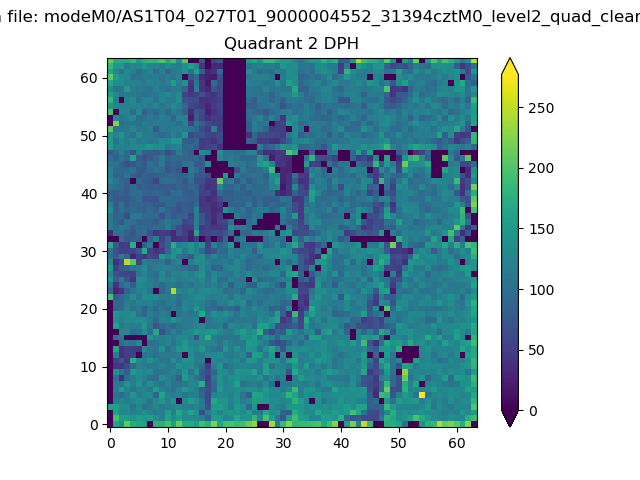
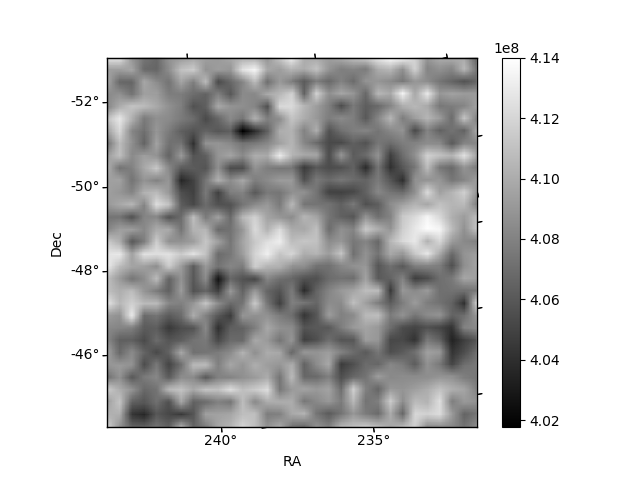
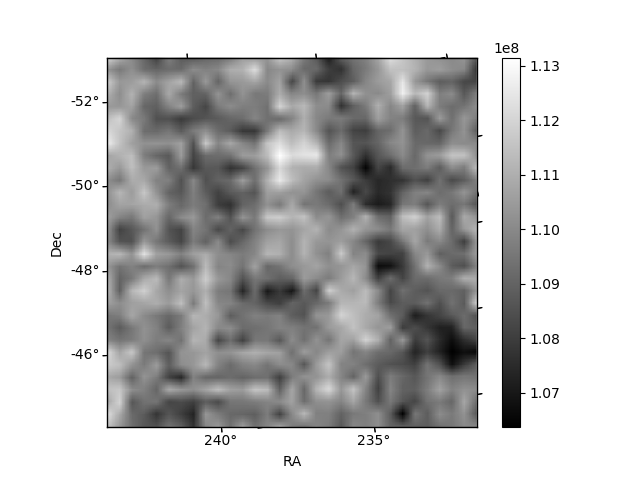
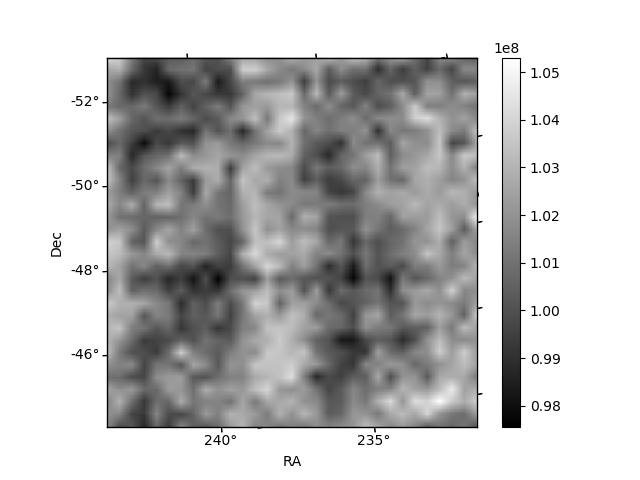
Histogram calculated using DETX and DETY for each event in the final _common_clean file
| Quadrant A | 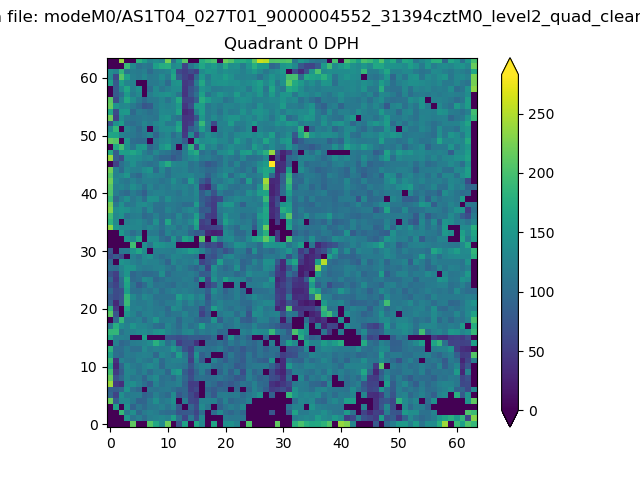 |
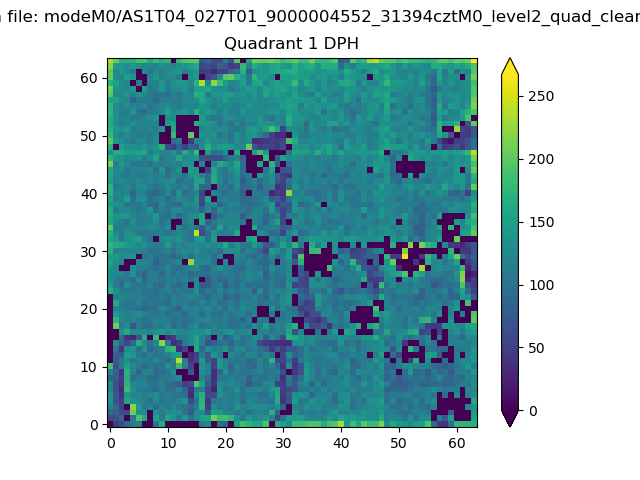 |
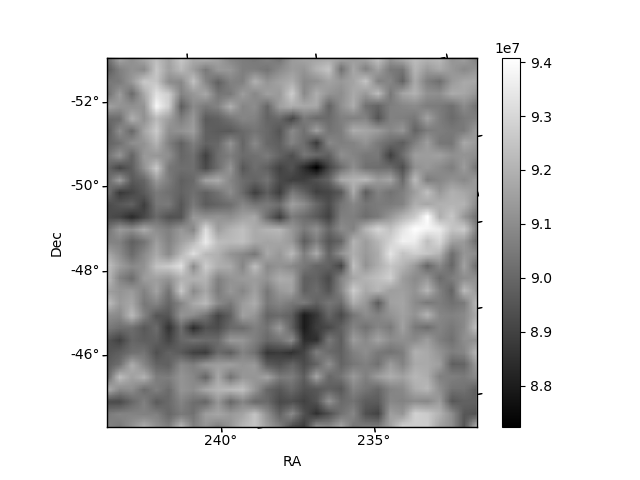
Quadrant B |
|---|---|---|---|
| Quadrant D | 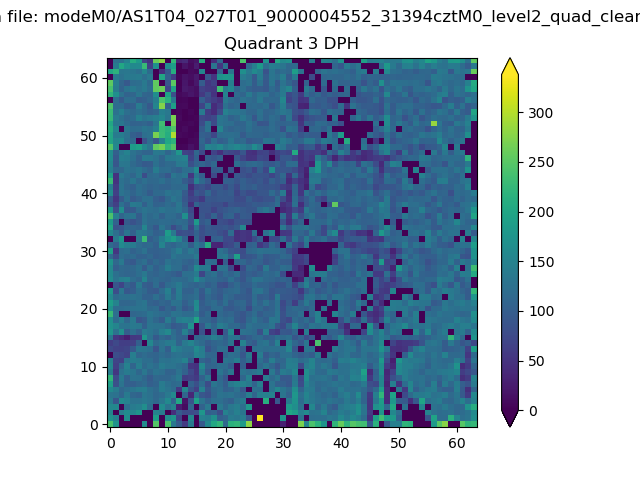 |
 |
Quadrant C |
| Plot type | Count rate plots | Images |
|---|---|---|
| Comparison with Poisson distribution Blue bars denote a histogram of data divided into 1 sec bins. Red curve is a Poisson curve with rate = median count rate of data. |
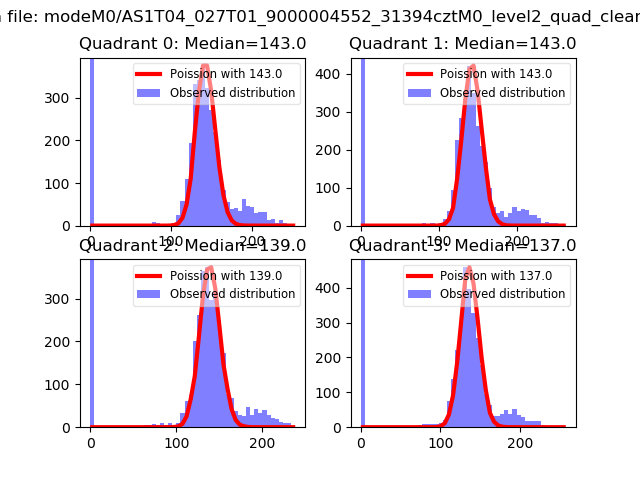 |
 |
| Quadrant-wise count rates Data is divided into 100 sec bins |
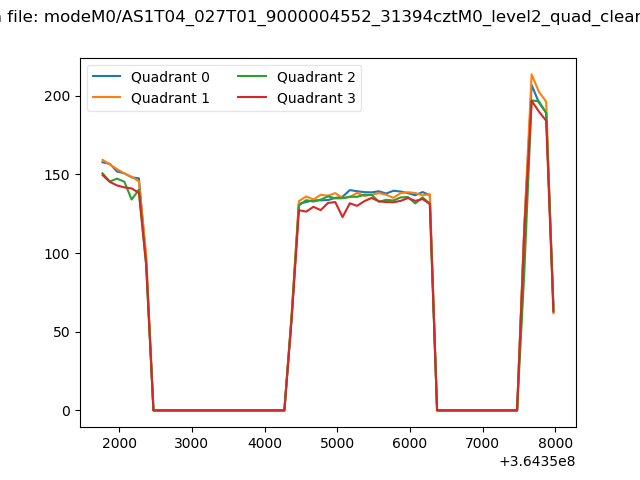 |
|
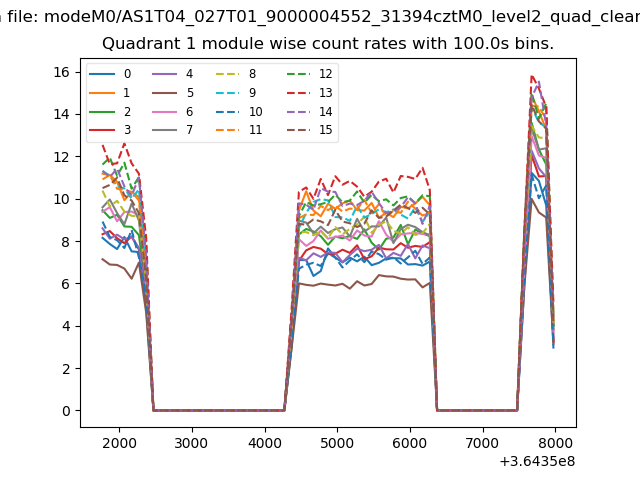
| Module-wise count rates for Quadrant A Data is divided into 100 sec bins |
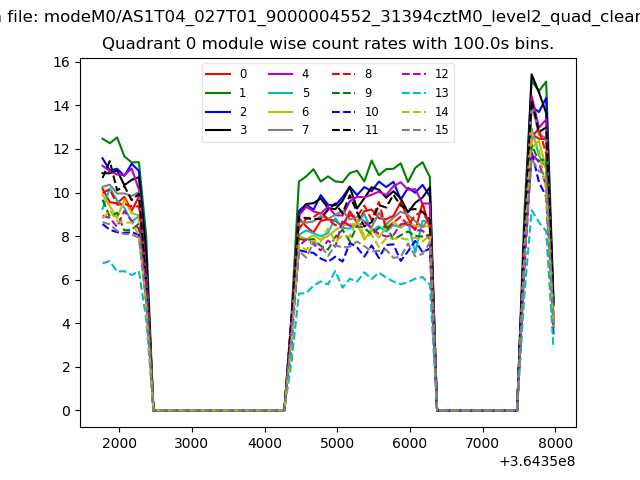 |
 |
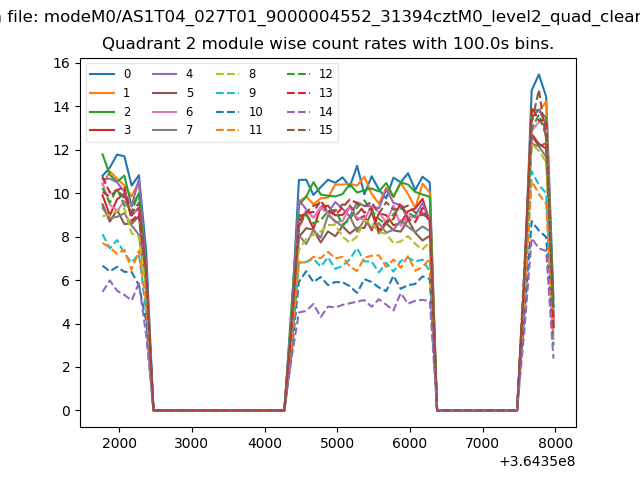
| Module-wise count rates for Quadrant B Data is divided into 100 sec bins |
 |
 |
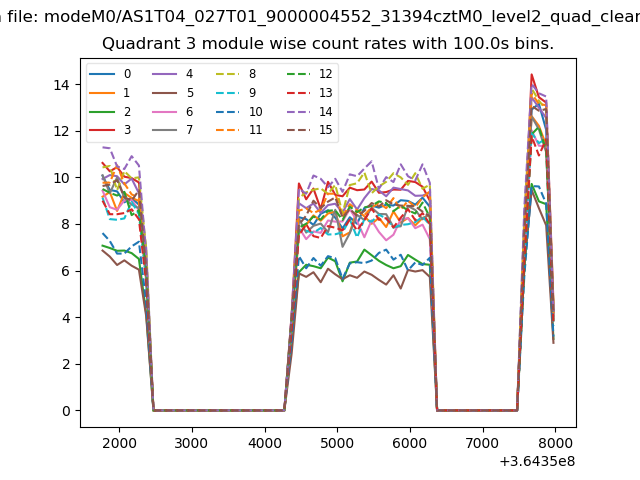
| Module-wise count rates for Quadrant C Data is divided into 100 sec bins |
 |
 |
| Module-wise count rates for Quadrant D Data is divided into 100 sec bins |
 |
 |
| Parameter | Plot |
|---|---|
| CZT HV Monitor | 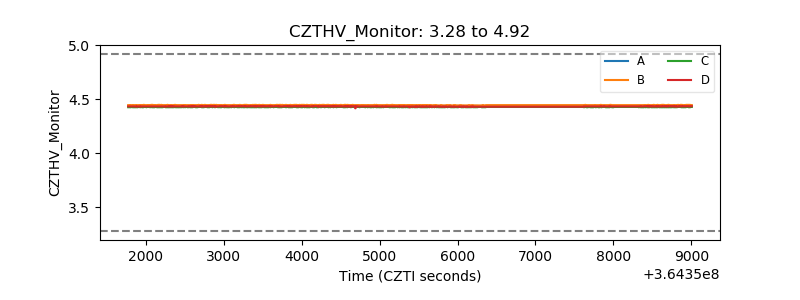 |
| D_VDD | 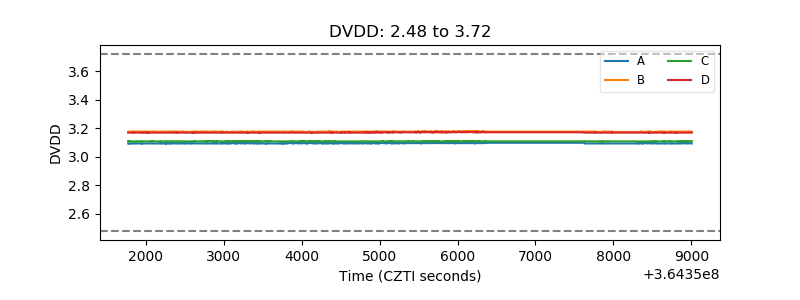 |
| Temperature 1 | 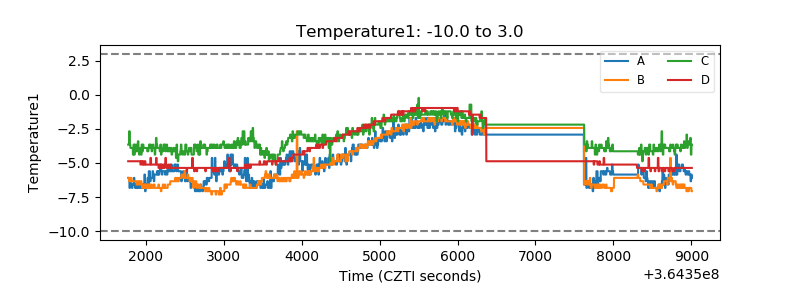 |
| Veto HV Monitor |  |
| Veto LLD | 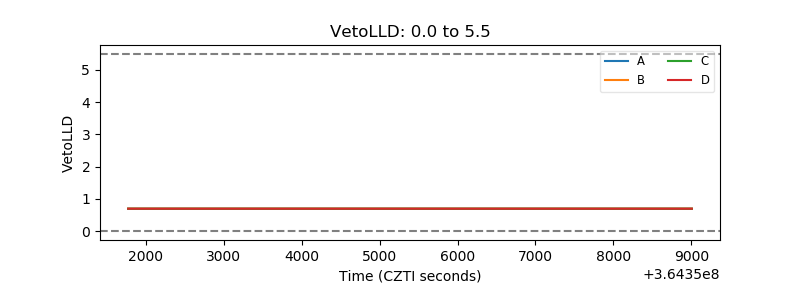 |
| Alpha Counter | 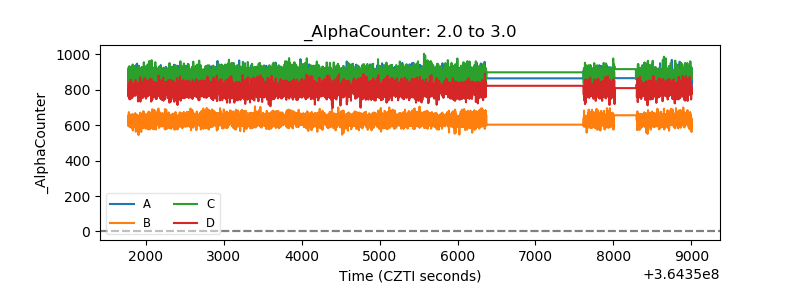 |
| _CPM_Rate | 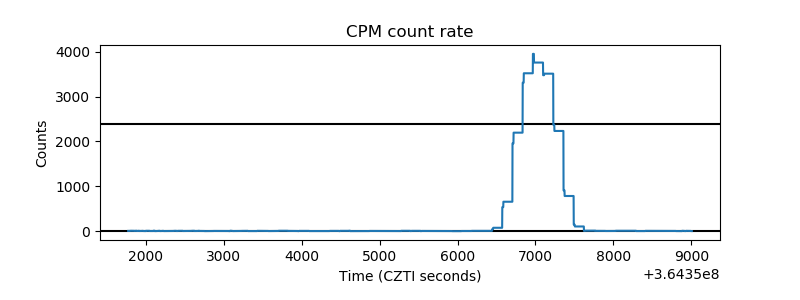 |
| CZT Counter | 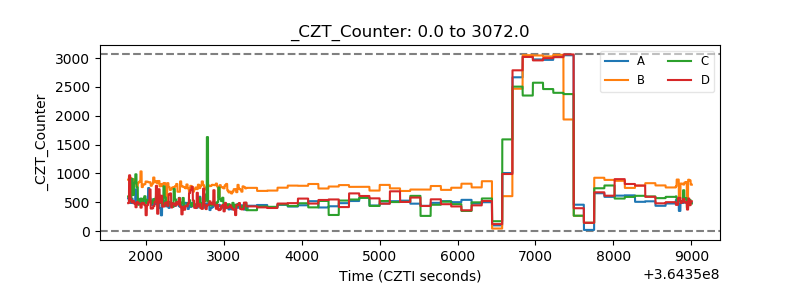 |
| +2.5 Volts monitor |  |
| +5 Volts monitor |  |
| _ROLL_ROT | 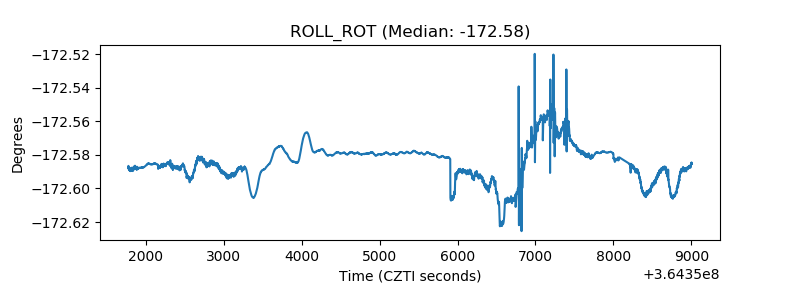 |
| _Roll_DEC | 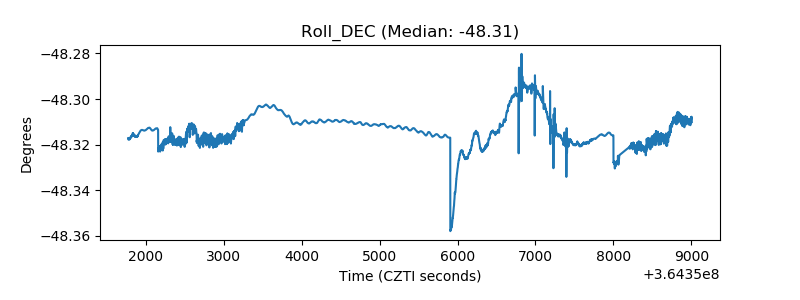 |
| _Roll_RA | 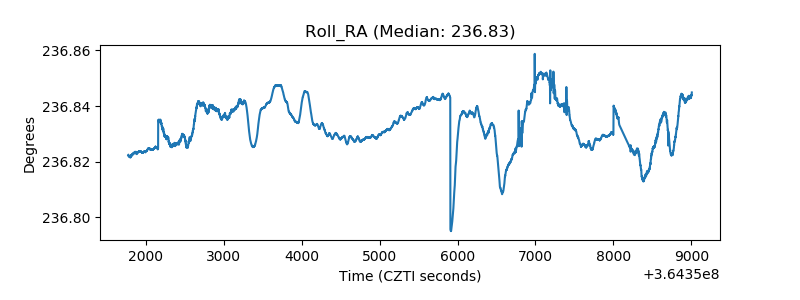 |
| Veto Counter | 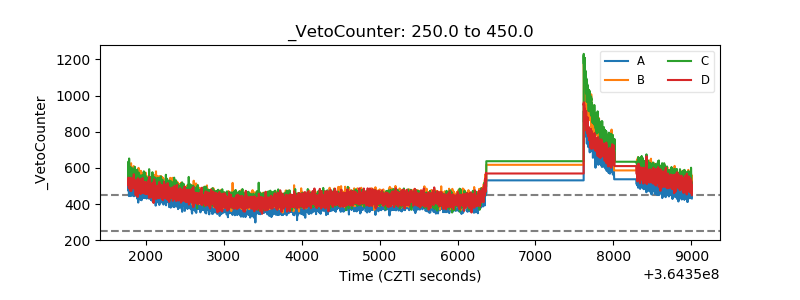 |