| Param | Original file | Final file |
|---|---|---|
| Filename | modeM0/AS1A10_094T26_9000004554cztM0_level2.fits | modeM0/AS1A10_094T26_9000004554cztM0_level2_quad_clean.evt |
| Size (bytes) | 68,860,800 | 22,052,160 |
| Size | 65.7 MB | 21.0 MB |
| Events in quadrant A | 444,888 | 67,265 |
| Events in quadrant B | 409,242 | 65,579 |
| Events in quadrant C | 434,640 | 65,249 |
| Events in quadrant D | 389,926 | 61,165 |
| Mode M9 | |||
|---|---|---|---|
| Quadrant | BADHDUFLAG | Total packets | Discarded packets |
| A | 0 | 26 | 0 |
| B | 0 | 26 | 0 |
| C | 0 | 26 | 0 |
| D | 0 | 26 | 0 |
| Mode SS | |||
|---|---|---|---|
| Quadrant | BADHDUFLAG | Total packets | Discarded packets |
| A | 0 | 120 | 0 |
| B | 0 | 120 | 0 |
| C | 0 | 120 | 0 |
| D | 0 | 120 | 0 |
| Mode M0 | |||
|---|---|---|---|
| Quadrant | BADHDUFLAG | Total packets | Discarded packets |
| A | 0 | 12638 | 0 |
| B | 0 | 17939 | 0 |
| C | 0 | 13470 | 0 |
| D | 0 | 14159 | 0 |
| Quadrant | Total seconds | Saturated seconds | Saturation percentage |
|---|---|---|---|
| A | 5821 | 21 | 0.360763% |
| B | 5821 | 93 | 1.597664% |
| C | 5821 | 163 | 2.800206% |
| D | 5821 | 38 | 0.652809% |
Noise dominated data is calculated using 1-second bins in cleaned event files. If a bin has >2000 counts, and if more than 50% of those come from <1% of pixels, then it is considered to be noise-dominated and hence unusable.
| Quadrant | # 1 sec bins | Bins with >0 counts | Bins with >2000 counts | High rate bins dominated by noise | Noise dominated (total time) | Noise dominated (detector-on time) | Marked lightcurve |
|---|---|---|---|---|---|---|---|
| A | 7200 | 5820 | 0 | 0 | 0.00% | 0.00% | 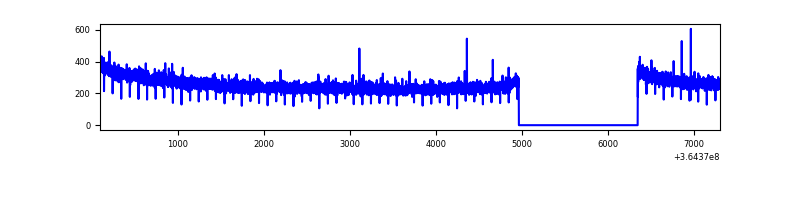 |
| B | 7200 | 5820 | 0 | 0 | 0.00% | 0.00% | 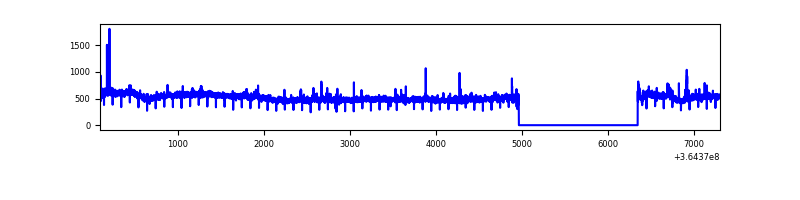 |
| C | 7200 | 5820 | 0 | 0 | 0.00% | 0.00% |  |
| D | 7200 | 5820 | 0 | 0 | 0.00% | 0.00% |  |
Top three noisy pixels from each quadrant. If the there are fewer than three noisy pixels in the level2.evt file, extra rows are filled as -1
| Pixel properties | Quadrant properties | ||||||
|---|---|---|---|---|---|---|---|
| Quadrant | DetID | PixID | Counts | Sigma | Mean | Median | Sigma |
| A | 0 | 29 | 437 | 11.1 | 116 | 110 | 29.5 |
| A | 7 | 110 | 349 | 8.11 | 116 | 110 | 29.5 |
| A | 9 | 19 | 344 | 7.94 | 116 | 110 | 29.5 |
| B | 2 | 9 | 345 | 10.43 | 108 | 104 | 23.1 |
| B | 3 | 17 | 279 | 7.57 | 108 | 104 | 23.1 |
| B | 2 | 8 | 276 | 7.44 | 108 | 104 | 23.1 |
| C | 3 | 202 | 360 | 8.16 | 115 | 110 | 30.6 |
| C | 3 | 203 | 347 | 7.74 | 115 | 110 | 30.6 |
| C | 3 | 187 | 336 | 7.38 | 115 | 110 | 30.6 |
| D | 6 | 67 | 284 | 5.98 | 111 | 102 | 30.4 |
| D | 4 | 246 | 284 | 5.98 | 111 | 102 | 30.4 |
| D | 6 | 231 | 279 | 5.82 | 111 | 102 | 30.4 |
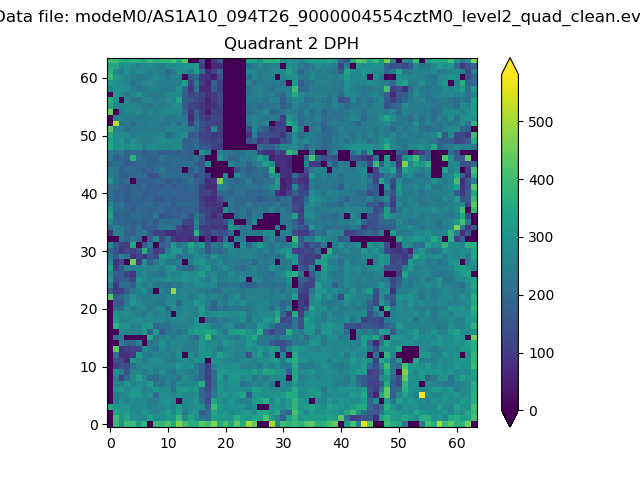
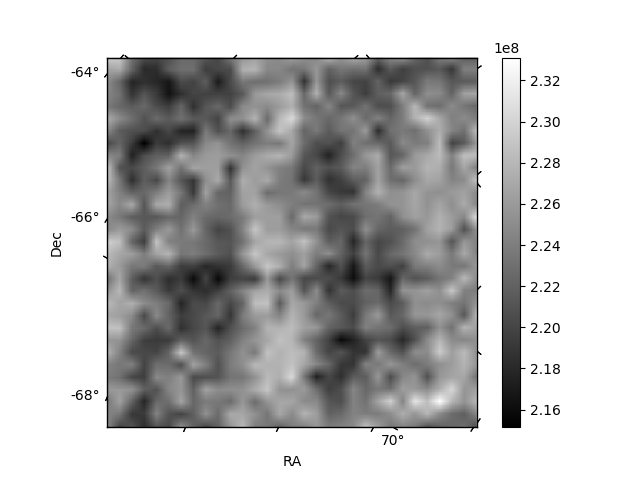
Histogram calculated using DETX and DETY for each event in the final _common_clean file
| Quadrant A | 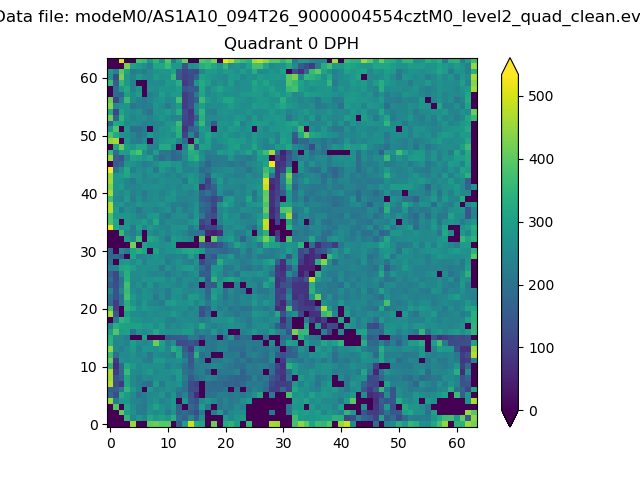 |
 |
Quadrant B |
|---|---|---|---|
| Quadrant D |  |
 |
Quadrant C |
| Plot type | Count rate plots | Images |
|---|---|---|
| Comparison with Poisson distribution Blue bars denote a histogram of data divided into 1 sec bins. Red curve is a Poisson curve with rate = median count rate of data. |
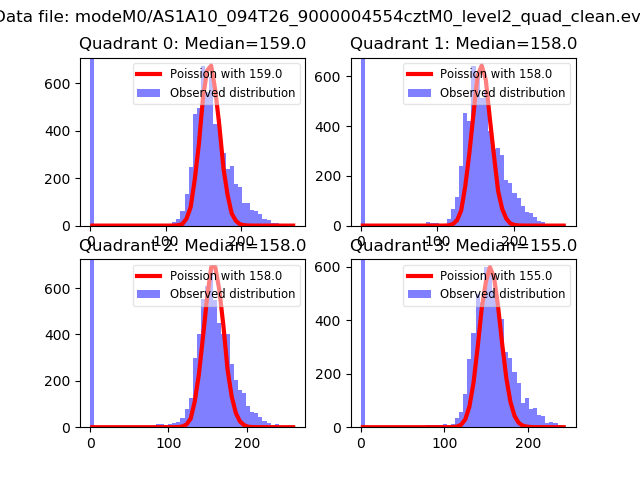 |
 |
| Quadrant-wise count rates Data is divided into 100 sec bins |
 |
|
| Module-wise count rates for Quadrant A Data is divided into 100 sec bins |
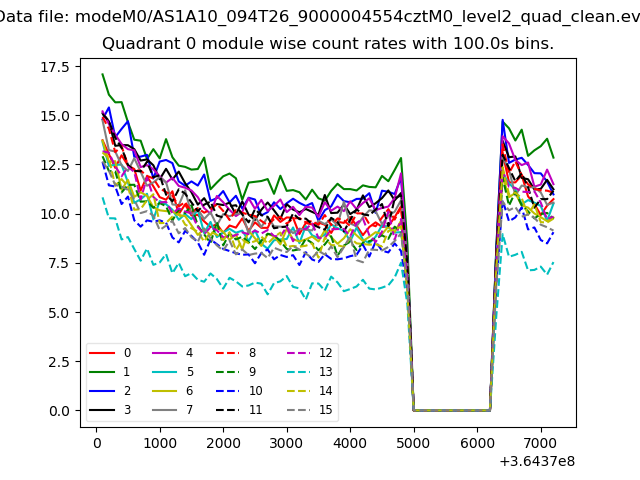 |
 |
| Module-wise count rates for Quadrant B Data is divided into 100 sec bins |
 |
 |
| Module-wise count rates for Quadrant C Data is divided into 100 sec bins |
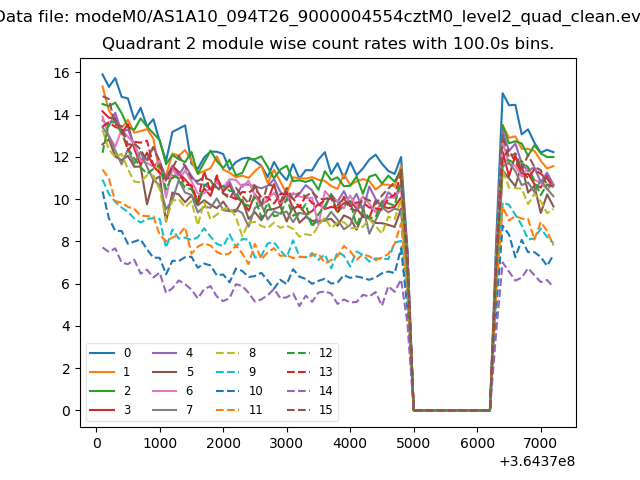 |
 |
| Module-wise count rates for Quadrant D Data is divided into 100 sec bins |
 |
 |
| Parameter | Plot |
|---|---|
| CZT HV Monitor | 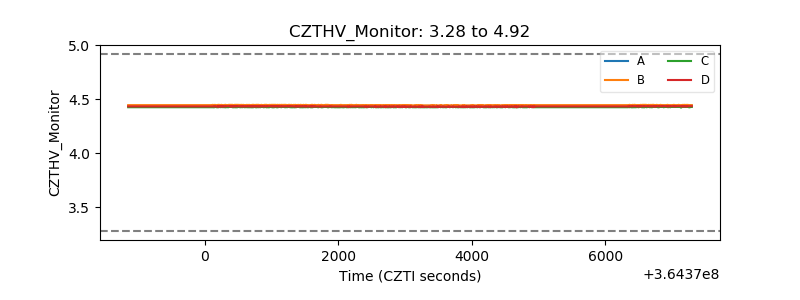 |
| D_VDD |  |
| Temperature 1 |  |
| Veto HV Monitor |  |
| Veto LLD | 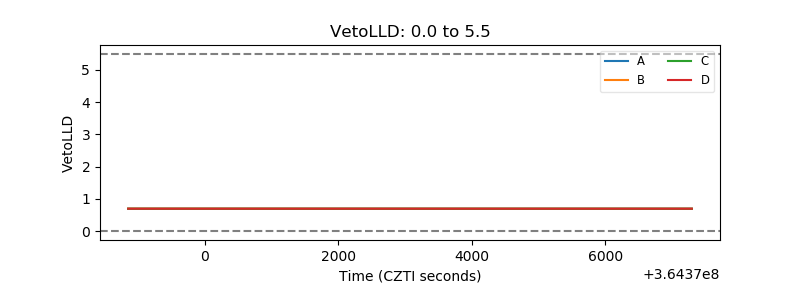 |
| Alpha Counter | 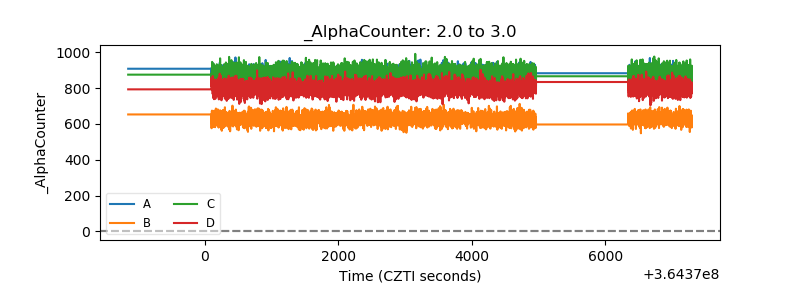 |
| _CPM_Rate |  |
| CZT Counter | 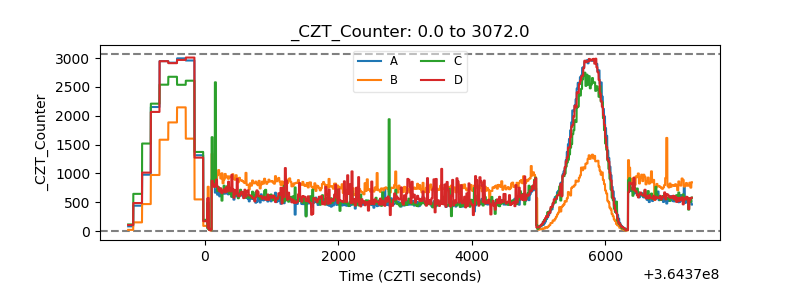 |
| +2.5 Volts monitor |  |
| +5 Volts monitor |  |
| _ROLL_ROT | 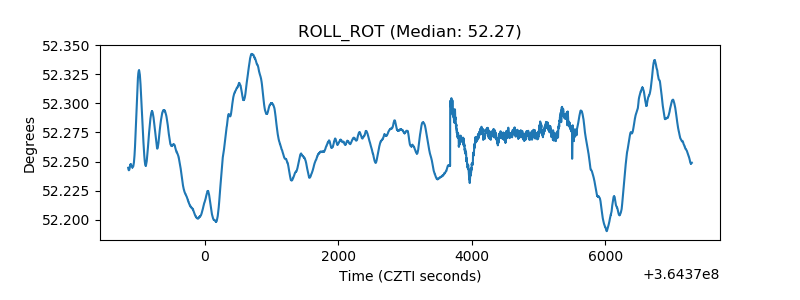 |
| _Roll_DEC | 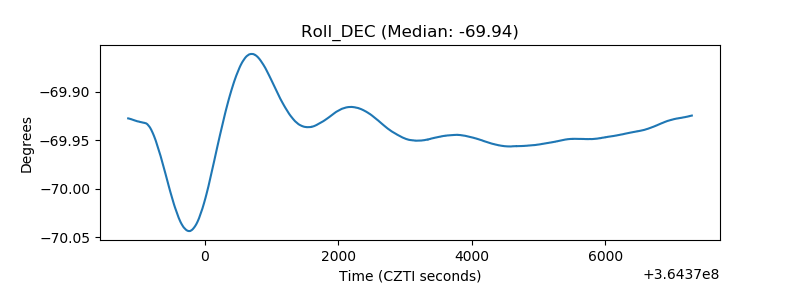 |
| _Roll_RA |  |
| Veto Counter | 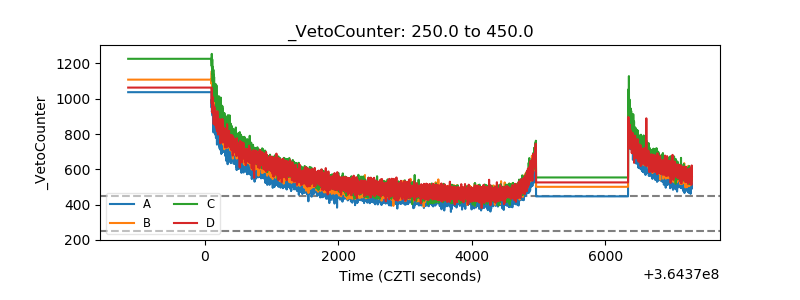 |