| Param | Original file | Final file |
|---|---|---|
| Filename | modeM0/AS1T04_026T01_9000004556cztM0_level2.fits | modeM0/AS1T04_026T01_9000004556cztM0_level2_quad_clean.evt |
| Size (bytes) | 942,675,840 | 808,945,920 |
| Size | 899.0 MB | 771.5 MB |
| Events in quadrant A | 5,943,300 | 4,802,444 |
| Events in quadrant B | 5,517,284 | 4,741,481 |
| Events in quadrant C | 5,699,280 | 4,539,113 |
| Events in quadrant D | 4,995,250 | 4,023,178 |
| Mode M9 | |||
|---|---|---|---|
| Quadrant | BADHDUFLAG | Total packets | Discarded packets |
| A | 0 | 138 | 0 |
| B | 0 | 138 | 0 |
| C | 0 | 138 | 0 |
| D | 0 | 138 | 0 |
| Mode M0 | |||
|---|---|---|---|
| Quadrant | BADHDUFLAG | Total packets | Discarded packets |
| A | 0 | 194049 | 0 |
| B | 0 | 284775 | 0 |
| C | 0 | 207949 | 0 |
| D | 0 | 252261 | 0 |
| Mode SS | |||
|---|---|---|---|
| Quadrant | BADHDUFLAG | Total packets | Discarded packets |
| A | 0 | 1814 | 0 |
| B | 0 | 1814 | 0 |
| C | 0 | 1814 | 0 |
| D | 0 | 1814 | 0 |
| Quadrant | Total seconds | Saturated seconds | Saturation percentage |
|---|---|---|---|
| A | 93522 | 1302 | 1.392186% |
| B | 93524 | 2495 | 2.667764% |
| C | 93525 | 3169 | 3.388399% |
| D | 93521 | 5344 | 5.714225% |
Noise dominated data is calculated using 1-second bins in cleaned event files. If a bin has >2000 counts, and if more than 50% of those come from <1% of pixels, then it is considered to be noise-dominated and hence unusable.
| Quadrant | # 1 sec bins | Bins with >0 counts | Bins with >2000 counts | High rate bins dominated by noise | Noise dominated (total time) | Noise dominated (detector-on time) | Marked lightcurve |
|---|---|---|---|---|---|---|---|
| A | 107843 | 93525 | 0 | 0 | 0.00% | 0.00% |  |
| B | 107843 | 93520 | 0 | 0 | 0.00% | 0.00% | 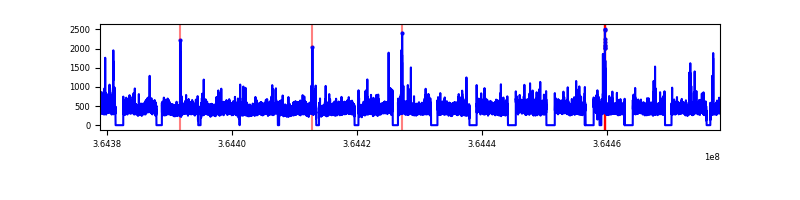 |
| C | 107843 | 93511 | 0 | 0 | 0.00% | 0.00% | 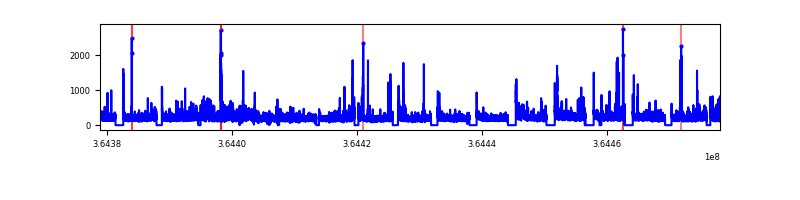 |
| D | 107843 | 93479 | 0 | 0 | 0.00% | 0.00% | 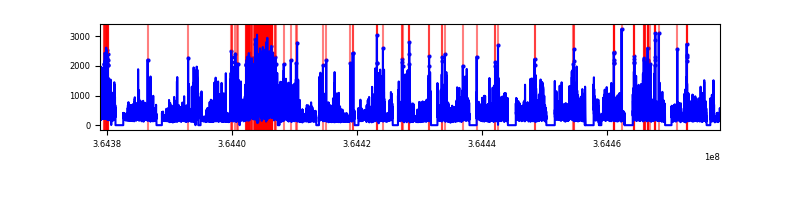 |
Top three noisy pixels from each quadrant. If the there are fewer than three noisy pixels in the level2.evt file, extra rows are filled as -1
| Pixel properties | Quadrant properties | ||||||
|---|---|---|---|---|---|---|---|
| Quadrant | DetID | PixID | Counts | Sigma | Mean | Median | Sigma |
| A | 0 | 29 | 5828 | 11.58 | 1547 | 1454 | 377.6 |
| A | 7 | 110 | 4664 | 8.5 | 1547 | 1454 | 377.6 |
| A | 0 | 30 | 4419 | 7.85 | 1547 | 1454 | 377.6 |
| B | 2 | 9 | 4432 | 10.69 | 1457 | 1394 | 284.1 |
| B | 2 | 8 | 3719 | 8.18 | 1457 | 1394 | 284.1 |
| B | 3 | 80 | 3692 | 8.09 | 1457 | 1394 | 284.1 |
| C | 12 | 241 | 4043 | 6.89 | 1511 | 1417 | 381.0 |
| C | 3 | 187 | 3916 | 6.56 | 1511 | 1417 | 381.0 |
| C | 9 | 209 | 3834 | 6.34 | 1511 | 1417 | 381.0 |
| D | 6 | 67 | 3563 | 6.02 | 1429 | 1310 | 374.0 |
| D | 3 | 14 | 3513 | 5.89 | 1429 | 1310 | 374.0 |
| D | 10 | 189 | 3511 | 5.88 | 1429 | 1310 | 374.0 |
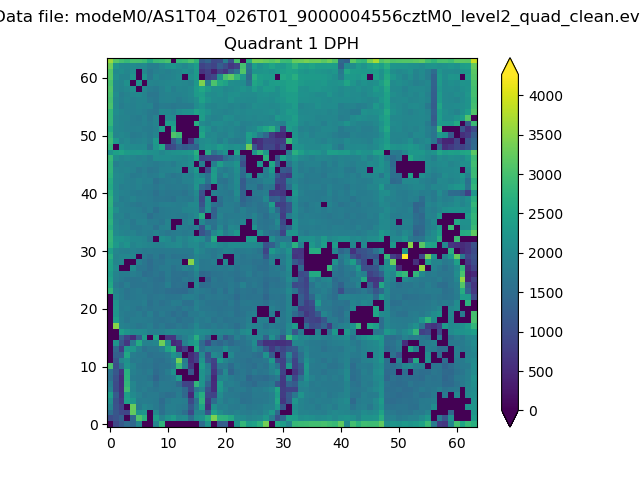
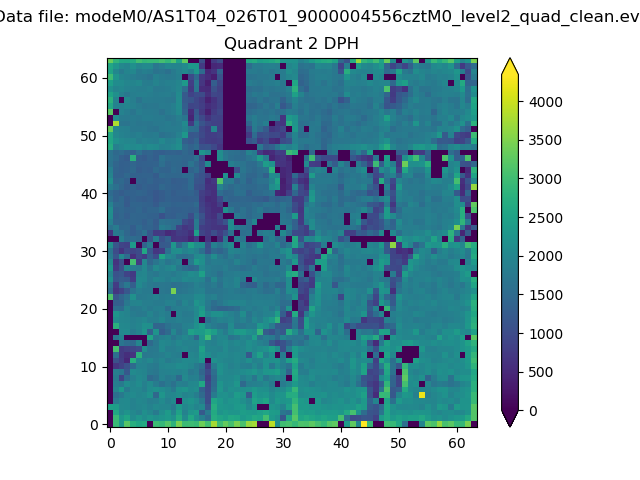
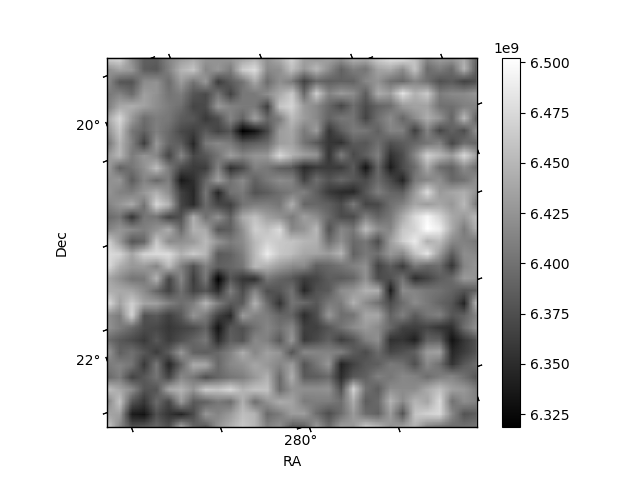
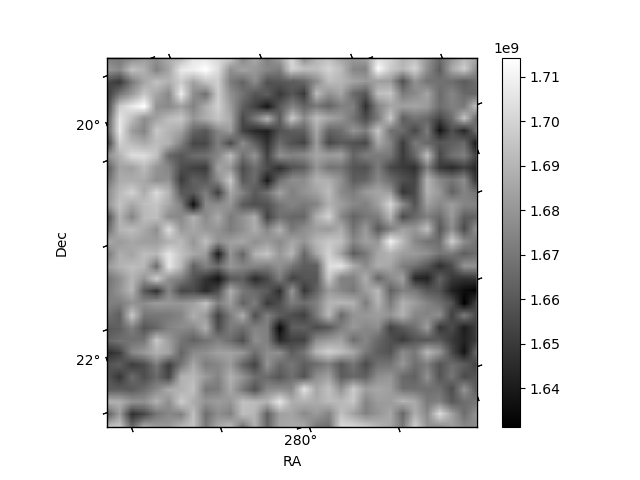
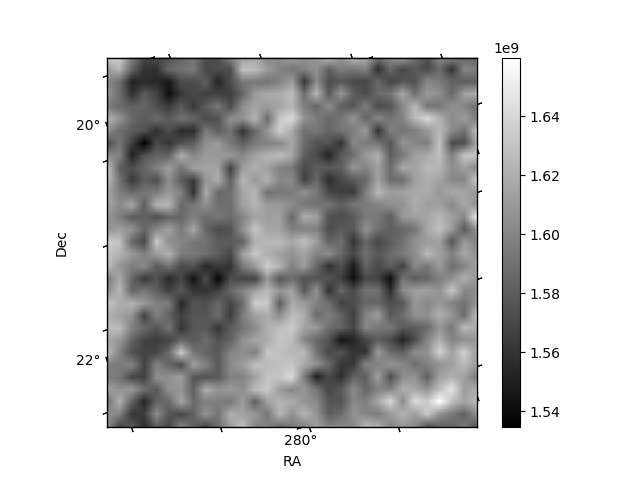
Histogram calculated using DETX and DETY for each event in the final _common_clean file
| Quadrant A | 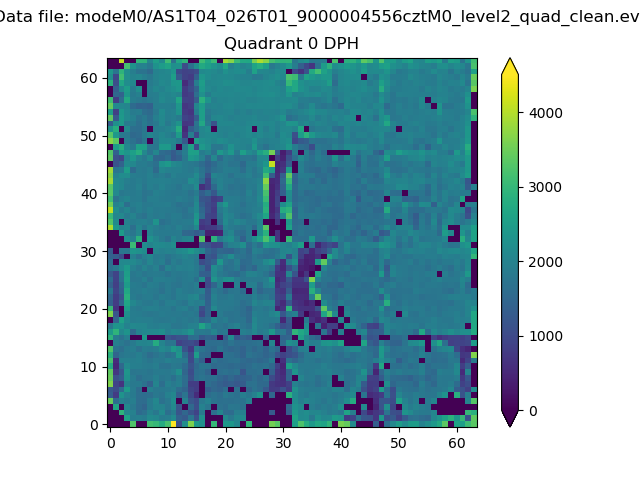 |
 |
Quadrant B |
|---|---|---|---|
| Quadrant D | 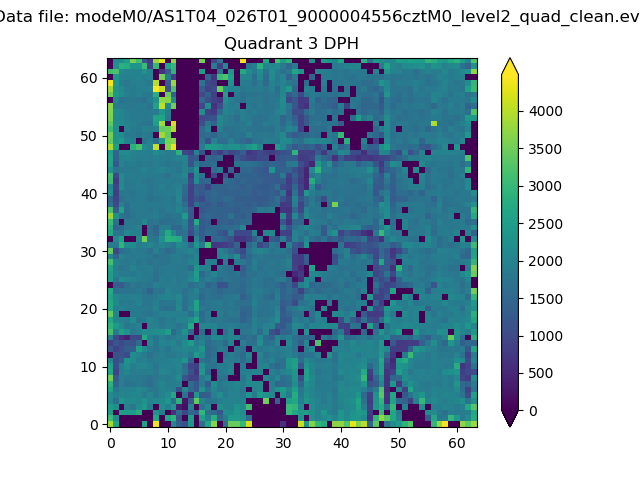 |
 |
Quadrant C |
| Plot type | Count rate plots | Images |
|---|---|---|
| Comparison with Poisson distribution Blue bars denote a histogram of data divided into 1 sec bins. Red curve is a Poisson curve with rate = median count rate of data. |
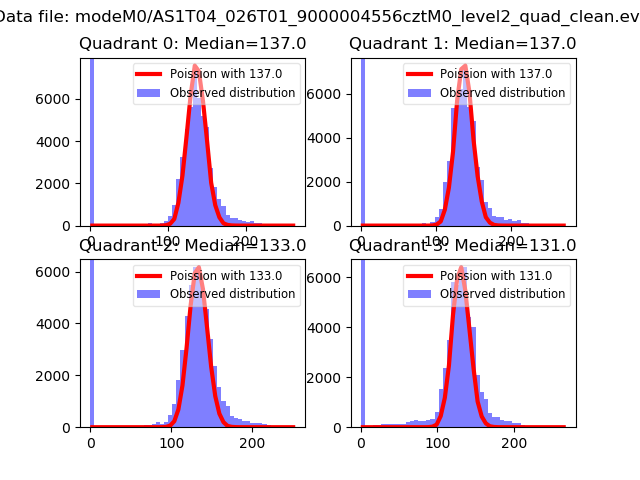 |
 |
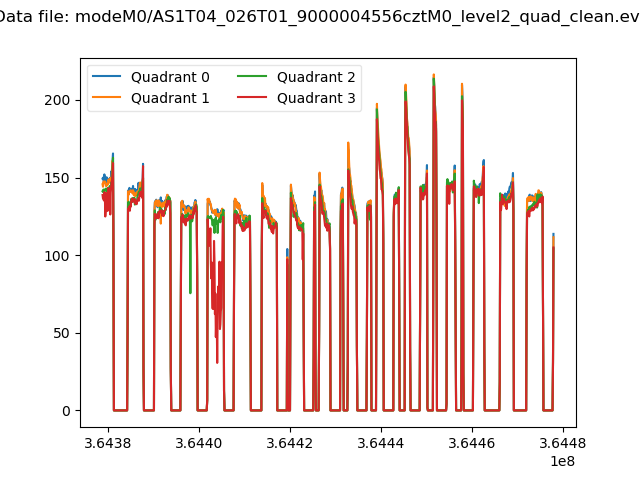
| Quadrant-wise count rates Data is divided into 100 sec bins |
 |
|
| Module-wise count rates for Quadrant A Data is divided into 100 sec bins |
 |
 |
| Module-wise count rates for Quadrant B Data is divided into 100 sec bins |
 |
 |
| Module-wise count rates for Quadrant C Data is divided into 100 sec bins |
 |
 |
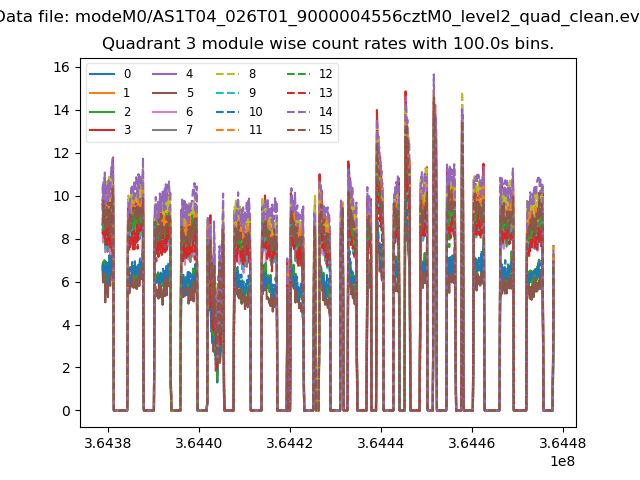
| Module-wise count rates for Quadrant D Data is divided into 100 sec bins |
 |
 |
| Parameter | Plot |
|---|---|
| CZT HV Monitor |  |
| D_VDD | 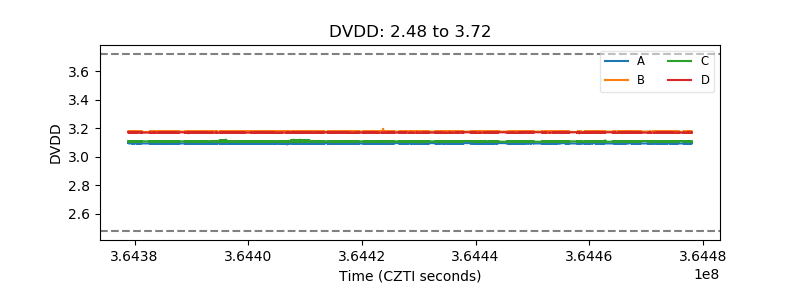 |
| Temperature 1 | 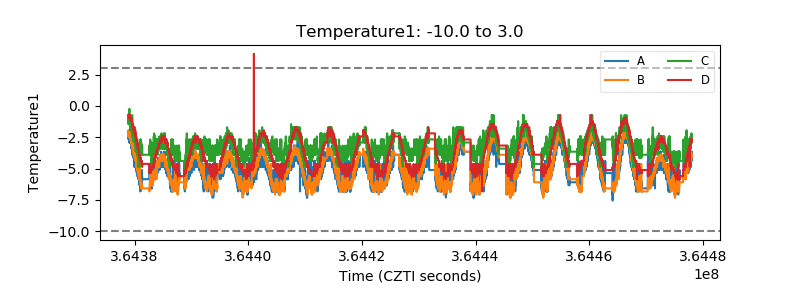 |
| Veto HV Monitor | 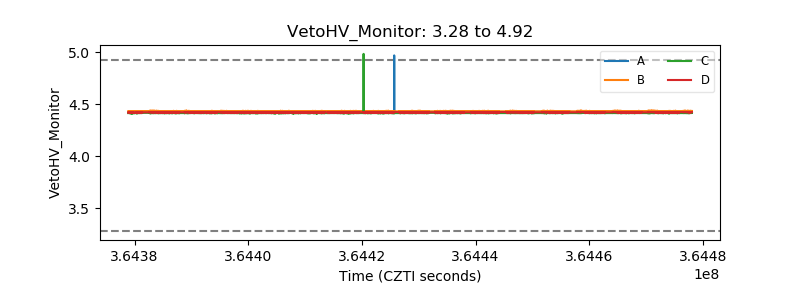 |
| Veto LLD | 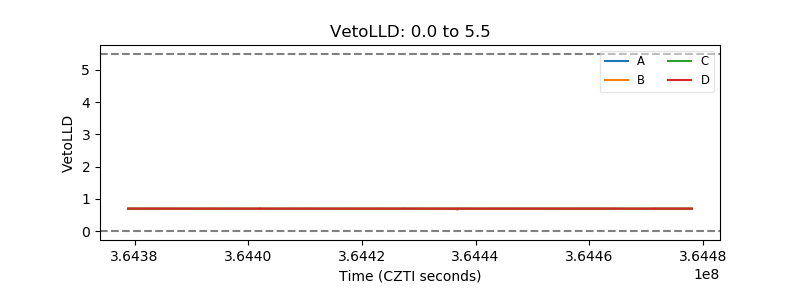 |
| Alpha Counter |  |
| _CPM_Rate | 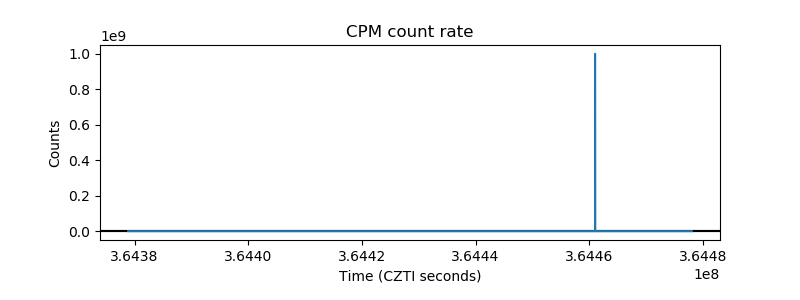 |
| CZT Counter | 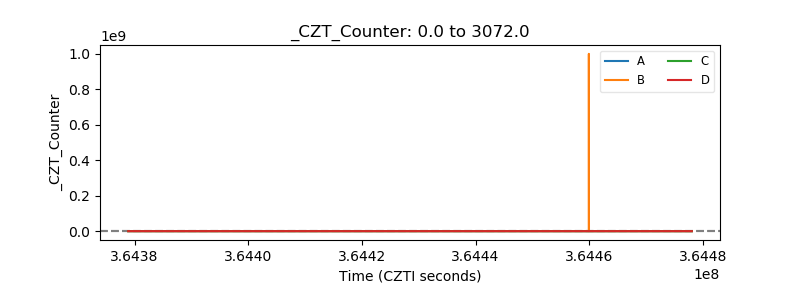 |
| +2.5 Volts monitor |  |
| +5 Volts monitor |  |
| _ROLL_ROT | 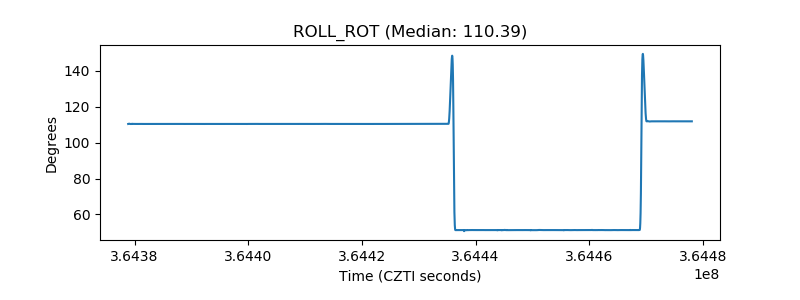 |
| _Roll_DEC |  |
| _Roll_RA | 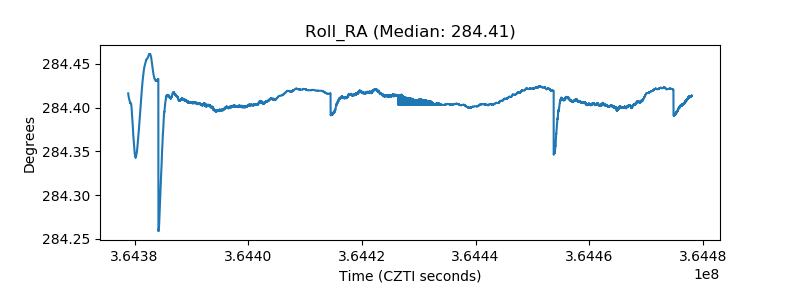 |
| Veto Counter | 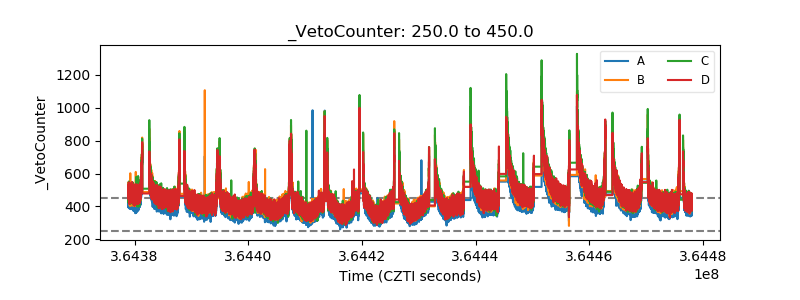 |