| Param | Original file | Final file |
|---|---|---|
| Filename | modeM0/AS1T04_026T01_9000004556_31398cztM0_level2.evt | modeM0/AS1T04_026T01_9000004556_31398cztM0_level2_quad_clean.evt |
| Size (bytes) | 348,422,400 | 56,491,200 |
| Size | 332.3 MB | 53.9 MB |
| Events in quadrant A | 2,054,653 | 372,452 |
| Events in quadrant B | 3,244,460 | 364,884 |
| Events in quadrant C | 2,175,322 | 356,609 |
| Events in quadrant D | 2,815,285 | 344,376 |
| Mode M9 | |||
|---|---|---|---|
| Quadrant | BADHDUFLAG | Total packets | Discarded packets |
| A | 0 | 13 | 0 |
| B | 0 | 13 | 0 |
| C | 0 | 13 | 0 |
| D | 0 | 13 | 0 |
| Mode M0 | |||
|---|---|---|---|
| Quadrant | BADHDUFLAG | Total packets | Discarded packets |
| A | 0 | 8236 | 1 |
| B | 0 | 12118 | 1 |
| C | 0 | 8604 | 1 |
| D | 0 | 10949 | 1 |
| Mode SS | |||
|---|---|---|---|
| Quadrant | BADHDUFLAG | Total packets | Discarded packets |
| A | 0 | 78 | 0 |
| B | 0 | 78 | 0 |
| C | 0 | 78 | 0 |
| D | 0 | 78 | 0 |
| Quadrant | Total seconds | Saturated seconds | Saturation percentage |
|---|---|---|---|
| A | 3857 | 58 | 1.503759% |
| B | 3857 | 152 | 3.940887% |
| C | 3857 | 137 | 3.551983% |
| D | 3856 | 149 | 3.864108% |
Noise dominated data is calculated using 1-second bins in cleaned event files. If a bin has >2000 counts, and if more than 50% of those come from <1% of pixels, then it is considered to be noise-dominated and hence unusable.
| Quadrant | # 1 sec bins | Bins with >0 counts | Bins with >2000 counts | High rate bins dominated by noise | Noise dominated (total time) | Noise dominated (detector-on time) | Marked lightcurve |
|---|---|---|---|---|---|---|---|
| A | 5107 | 3858 | 0 | 0 | 0.00% | 0.00% |  |
| B | 5107 | 3857 | 4 | 4 | 0.08% | 0.10% | 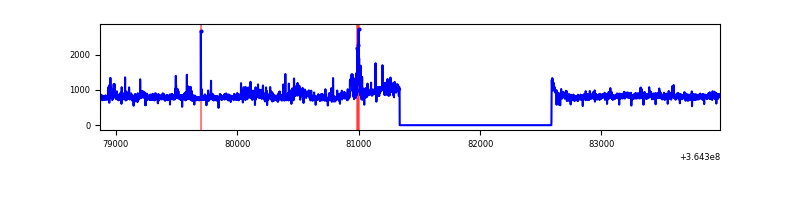 |
| C | 5107 | 3858 | 11 | 11 | 0.22% | 0.29% | 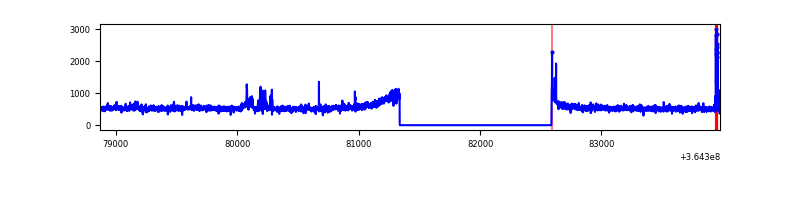 |
| D | 5106 | 3857 | 96 | 96 | 1.88% | 2.49% | 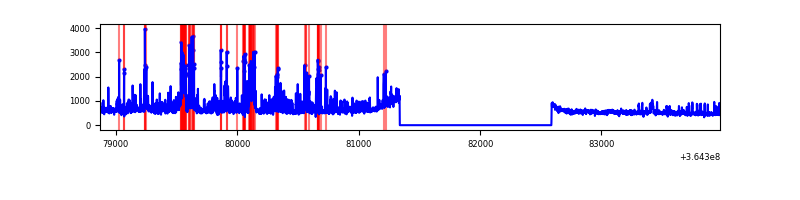 |
Top three noisy pixels from each quadrant. If the there are fewer than three noisy pixels in the level2.evt file, extra rows are filled as -1
| Pixel properties | Quadrant properties | ||||||
|---|---|---|---|---|---|---|---|
| Quadrant | DetID | PixID | Counts | Sigma | Mean | Median | Sigma |
| A | 13 | 254 | 7677 | 66.89 | 532 | 522 | 107.0 |
| A | 3 | 137 | 5293 | 44.6 | 532 | 522 | 107.0 |
| A | 0 | 226 | 4552 | 37.68 | 532 | 522 | 107.0 |
| B | 6 | 159 | 1045206 | 10341.54 | 518 | 506 | 101.0 |
| B | 4 | 80 | 121854 | 1201.23 | 518 | 506 | 101.0 |
| B | 0 | 190 | 19899 | 191.97 | 518 | 506 | 101.0 |
| C | 14 | 238 | 91950 | 764.89 | 506 | 511 | 119.5 |
| C | 3 | 233 | 31513 | 259.33 | 506 | 511 | 119.5 |
| C | 10 | 22 | 28682 | 235.65 | 506 | 511 | 119.5 |
| D | 13 | 249 | 239462 | 1778.49 | 507 | 500 | 134.4 |
| D | 8 | 195 | 236306 | 1755.0 | 507 | 500 | 134.4 |
| D | 10 | 203 | 176304 | 1308.43 | 507 | 500 | 134.4 |
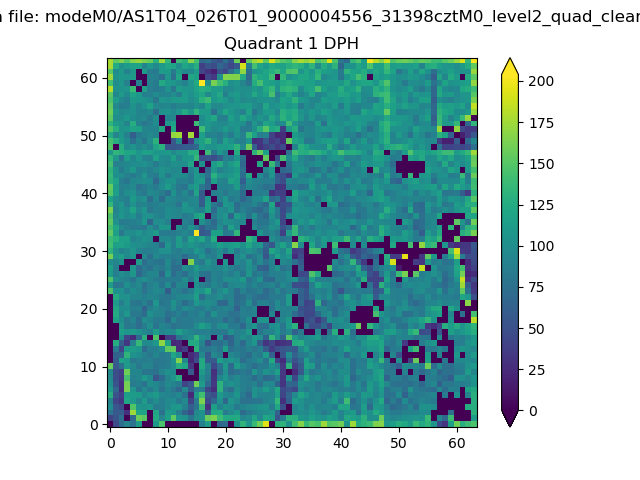
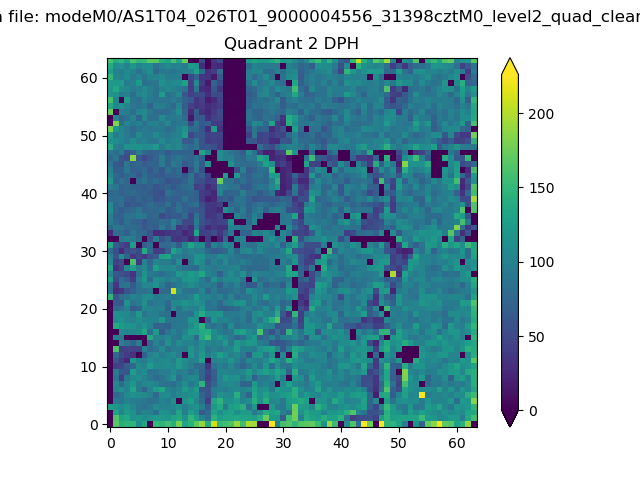
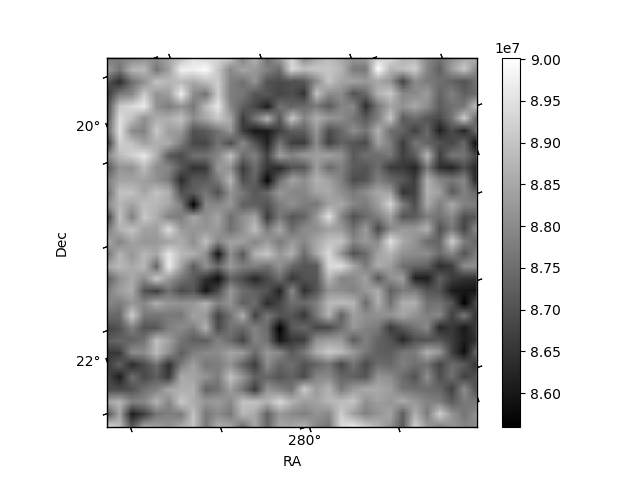
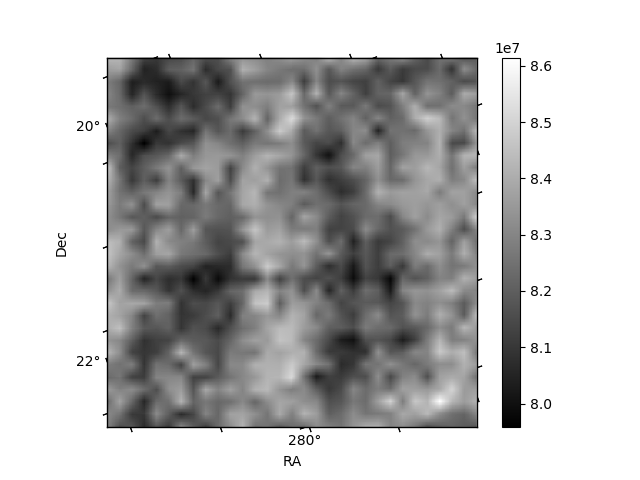
Histogram calculated using DETX and DETY for each event in the final _common_clean file
| Quadrant A | 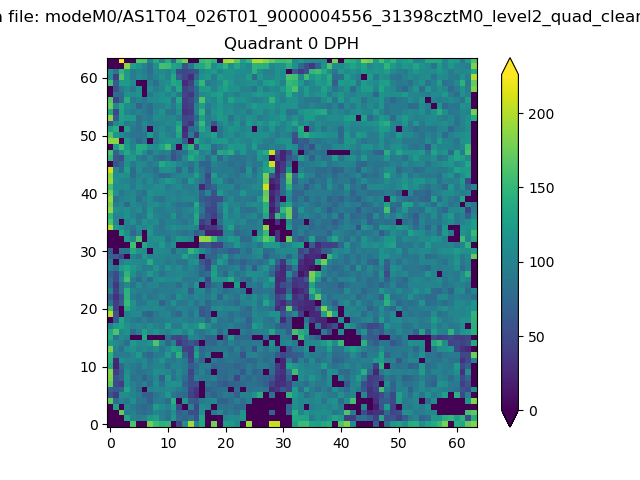 |
 |
Quadrant B |
|---|---|---|---|
| Quadrant D | 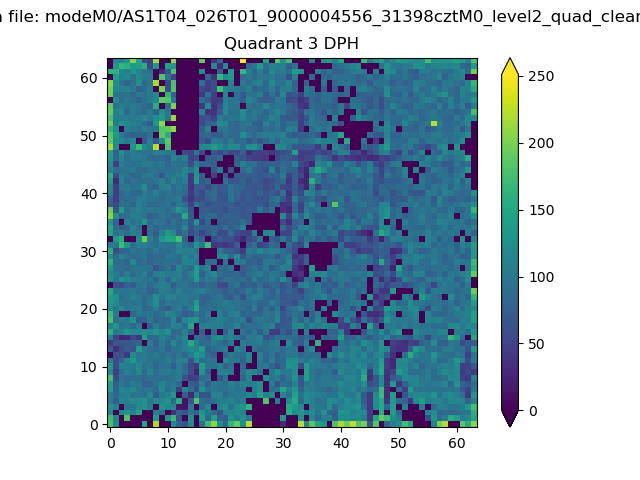 |
 |
Quadrant C |
| Plot type | Count rate plots | Images |
|---|---|---|
| Comparison with Poisson distribution Blue bars denote a histogram of data divided into 1 sec bins. Red curve is a Poisson curve with rate = median count rate of data. |
 |
 |
| Quadrant-wise count rates Data is divided into 100 sec bins |
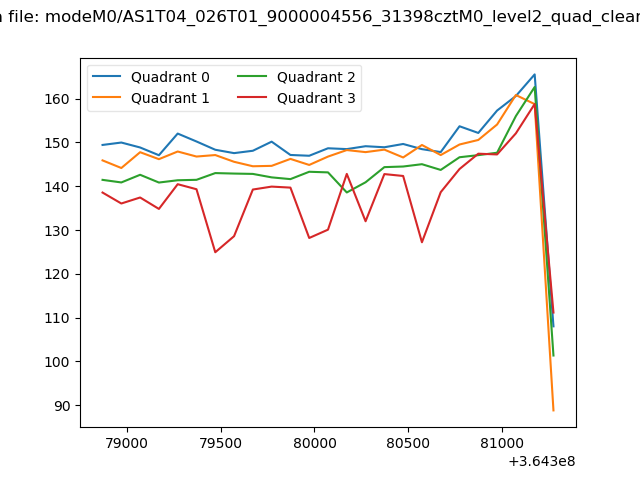 |
|
| Module-wise count rates for Quadrant A Data is divided into 100 sec bins |
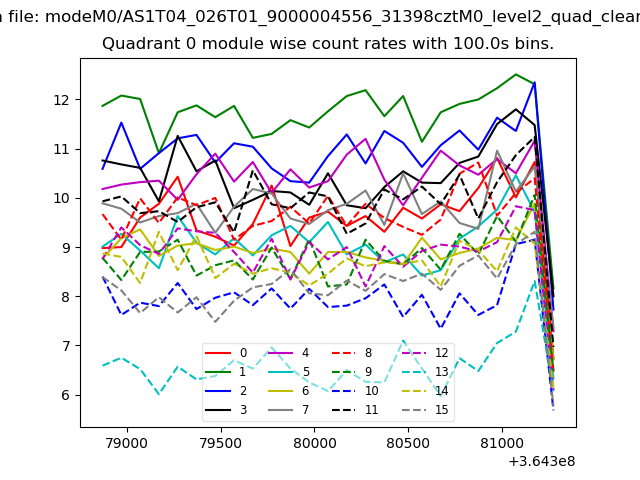 |
 |
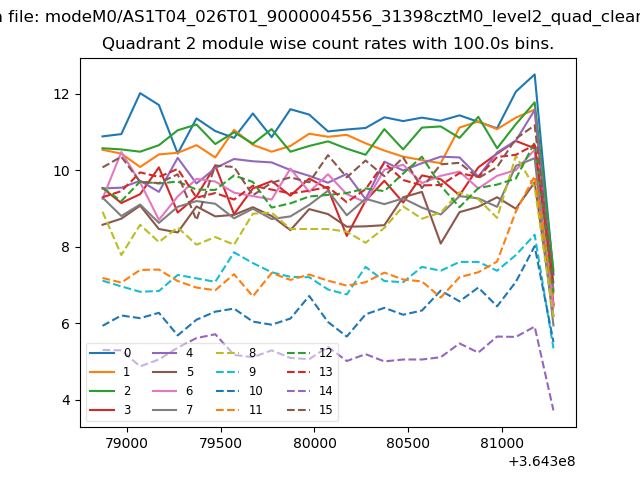
| Module-wise count rates for Quadrant B Data is divided into 100 sec bins |
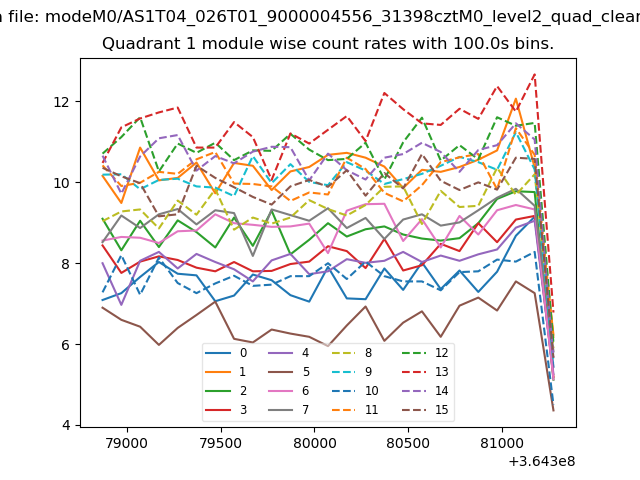 |
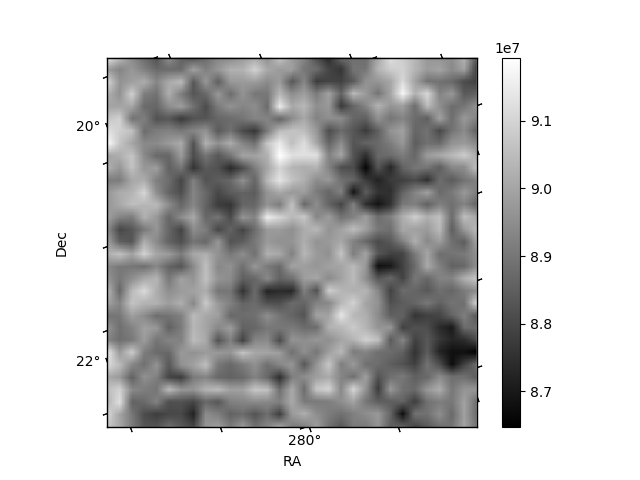 |
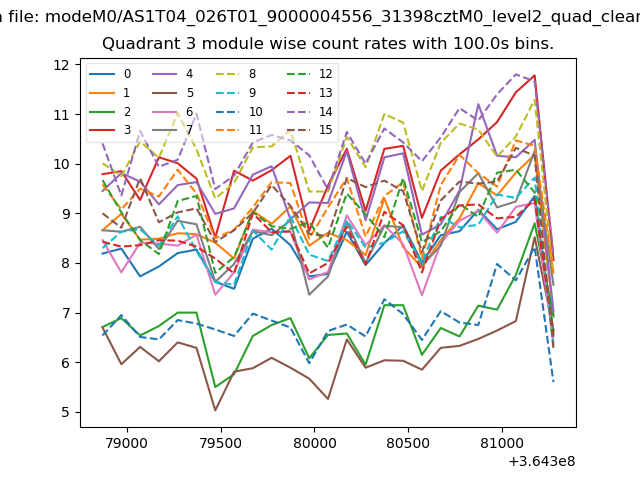
| Module-wise count rates for Quadrant C Data is divided into 100 sec bins |
 |
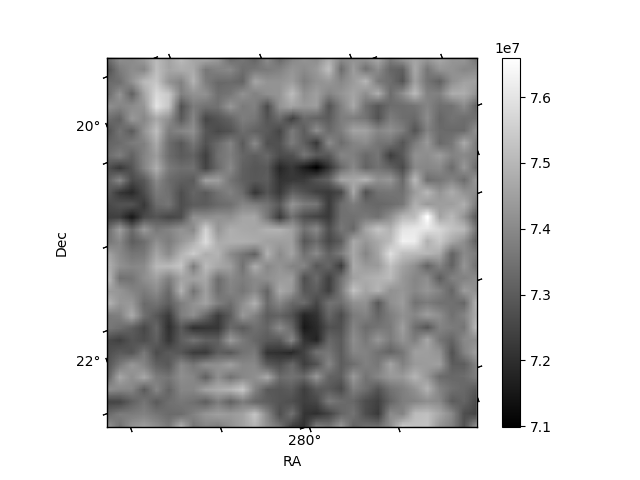 |
| Module-wise count rates for Quadrant D Data is divided into 100 sec bins |
 |
 |
| Parameter | Plot |
|---|---|
| CZT HV Monitor | 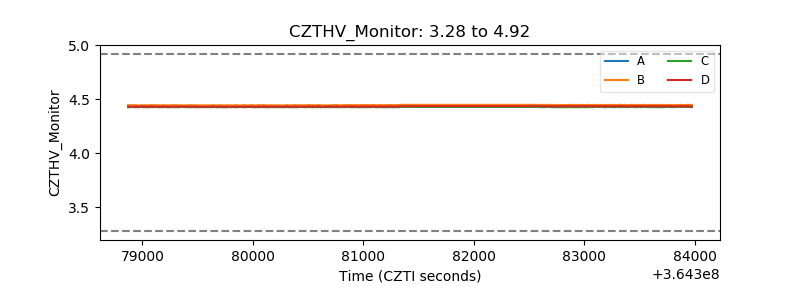 |
| D_VDD | 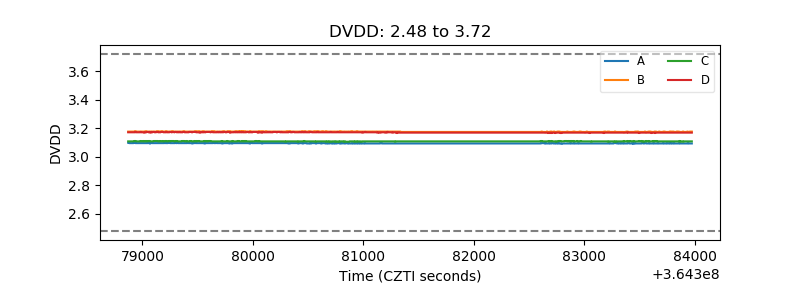 |
| Temperature 1 | 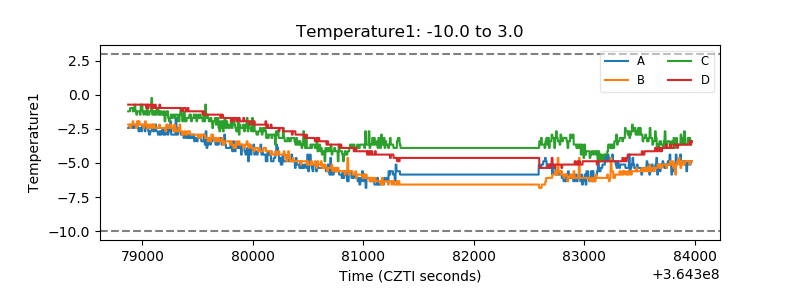 |
| Veto HV Monitor | 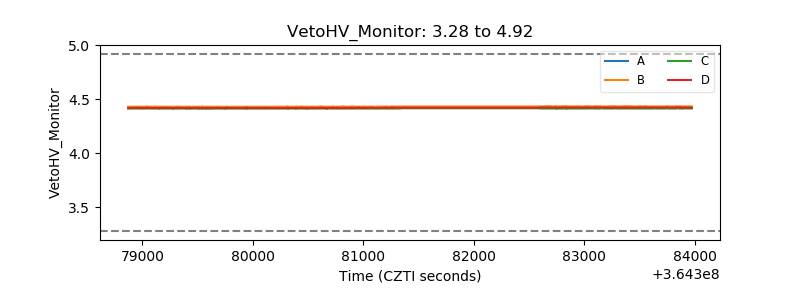 |
| Veto LLD | 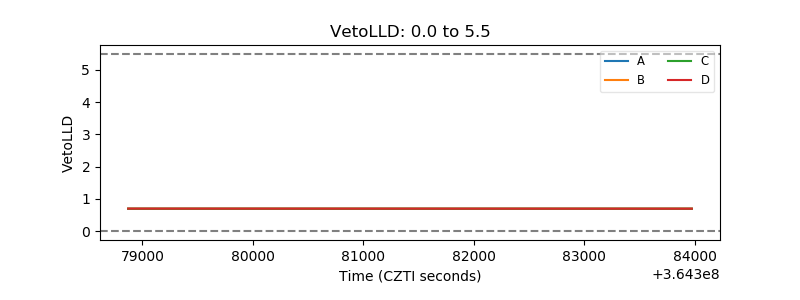 |
| Alpha Counter | 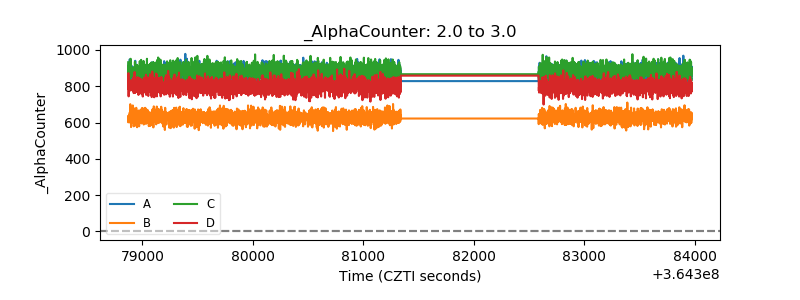 |
| _CPM_Rate | 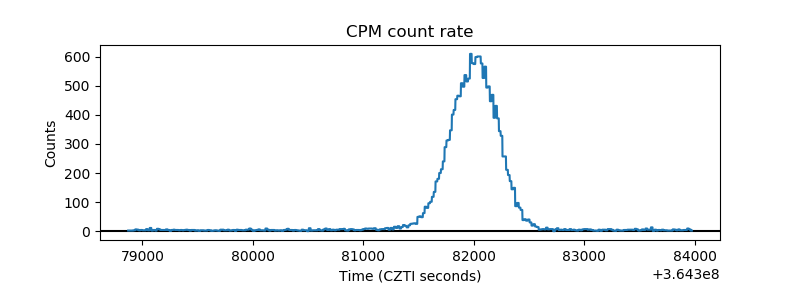 |
| CZT Counter | 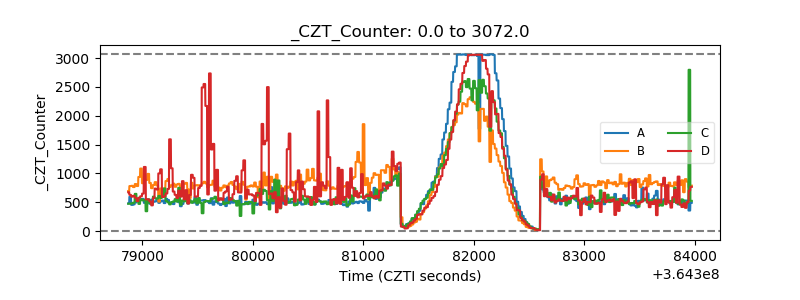 |
| +2.5 Volts monitor |  |
| +5 Volts monitor |  |
| _ROLL_ROT | 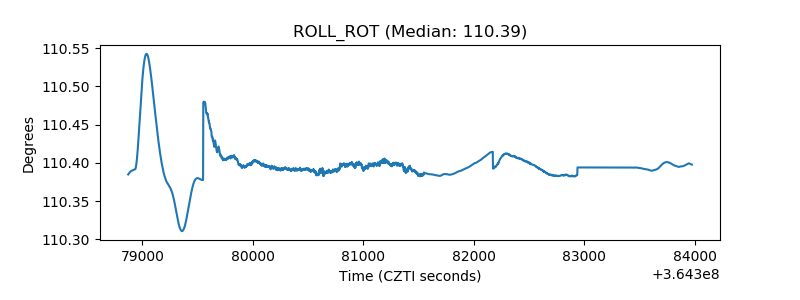 |
| _Roll_DEC | 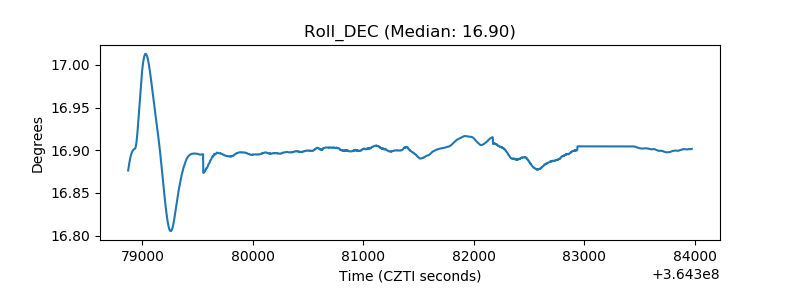 |
| _Roll_RA | 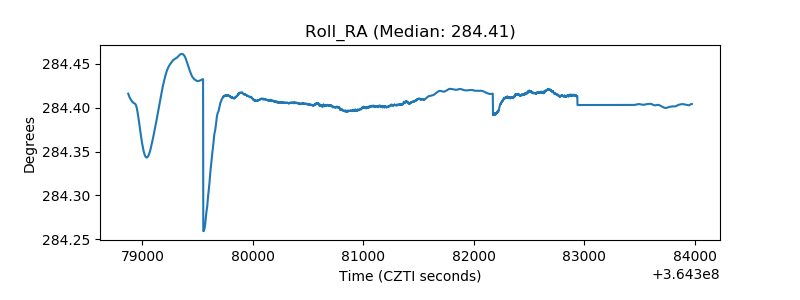 |
| Veto Counter | 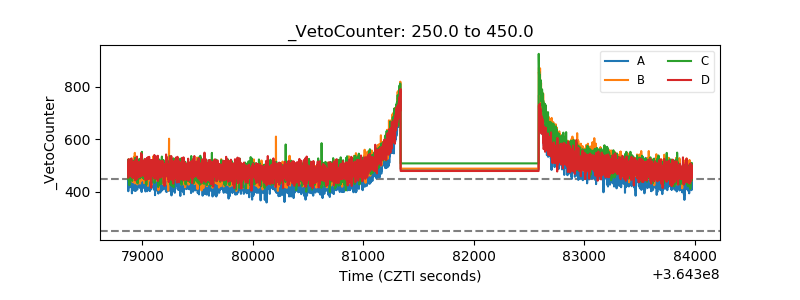 |