| Param | Original file | Final file |
|---|---|---|
| Filename | modeM0/AS1T04_026T01_9000004556_31399cztM0_level2.evt | modeM0/AS1T04_026T01_9000004556_31399cztM0_level2_quad_clean.evt |
| Size (bytes) | 601,905,600 | 89,000,640 |
| Size | 574.0 MB | 84.9 MB |
| Events in quadrant A | 3,756,285 | 562,571 |
| Events in quadrant B | 5,838,837 | 555,277 |
| Events in quadrant C | 3,954,392 | 540,144 |
| Events in quadrant D | 4,190,783 | 534,651 |
| Mode M9 | |||
|---|---|---|---|
| Quadrant | BADHDUFLAG | Total packets | Discarded packets |
| A | 0 | 22 | 0 |
| B | 0 | 22 | 0 |
| C | 0 | 22 | 0 |
| D | 0 | 22 | 0 |
| Mode M0 | |||
|---|---|---|---|
| Quadrant | BADHDUFLAG | Total packets | Discarded packets |
| A | 0 | 15319 | 2 |
| B | 0 | 22296 | 2 |
| C | 0 | 15904 | 2 |
| D | 0 | 16720 | 2 |
| Mode SS | |||
|---|---|---|---|
| Quadrant | BADHDUFLAG | Total packets | Discarded packets |
| A | 0 | 148 | 0 |
| B | 0 | 148 | 0 |
| C | 0 | 148 | 0 |
| D | 0 | 148 | 0 |
| Quadrant | Total seconds | Saturated seconds | Saturation percentage |
|---|---|---|---|
| A | 7214 | 149 | 2.065428% |
| B | 7215 | 298 | 4.130284% |
| C | 7215 | 256 | 3.548164% |
| D | 7215 | 108 | 1.496881% |
Noise dominated data is calculated using 1-second bins in cleaned event files. If a bin has >2000 counts, and if more than 50% of those come from <1% of pixels, then it is considered to be noise-dominated and hence unusable.
| Quadrant | # 1 sec bins | Bins with >0 counts | Bins with >2000 counts | High rate bins dominated by noise | Noise dominated (total time) | Noise dominated (detector-on time) | Marked lightcurve |
|---|---|---|---|---|---|---|---|
| A | 9339 | 7215 | 0 | 0 | 0.00% | 0.00% | 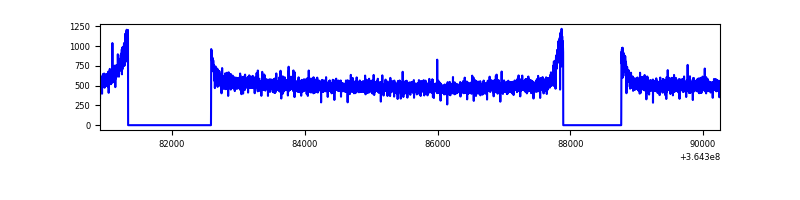 |
| B | 9340 | 7216 | 3 | 3 | 0.03% | 0.04% | 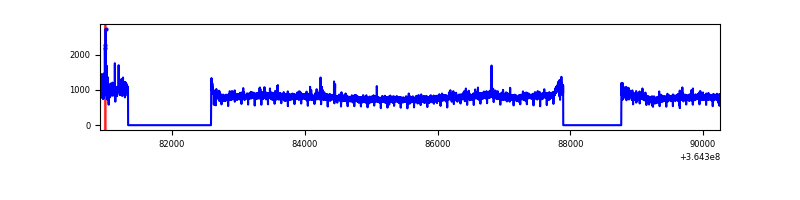 |
| C | 9340 | 7216 | 13 | 13 | 0.14% | 0.18% | 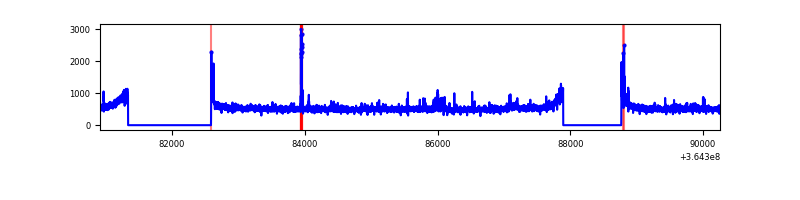 |
| D | 9340 | 7217 | 7 | 7 | 0.07% | 0.10% | 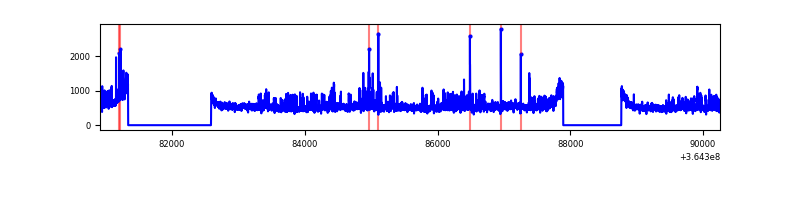 |
Top three noisy pixels from each quadrant. If the there are fewer than three noisy pixels in the level2.evt file, extra rows are filled as -1
| Pixel properties | Quadrant properties | ||||||
|---|---|---|---|---|---|---|---|
| Quadrant | DetID | PixID | Counts | Sigma | Mean | Median | Sigma |
| A | 13 | 254 | 12556 | 59.62 | 973 | 953 | 194.6 |
| A | 3 | 137 | 10066 | 46.83 | 973 | 953 | 194.6 |
| A | 0 | 226 | 8153 | 37.0 | 973 | 953 | 194.6 |
| B | 6 | 159 | 1973962 | 10667.87 | 950 | 926 | 185.0 |
| B | 4 | 80 | 113322 | 607.71 | 950 | 926 | 185.0 |
| B | 12 | 111 | 23077 | 119.77 | 950 | 926 | 185.0 |
| C | 14 | 238 | 168402 | 767.96 | 923 | 929 | 218.1 |
| C | 3 | 233 | 78334 | 354.95 | 923 | 929 | 218.1 |
| C | 10 | 22 | 37261 | 166.6 | 923 | 929 | 218.1 |
| D | 8 | 195 | 346994 | 1438.55 | 934 | 917 | 240.6 |
| D | 10 | 203 | 241805 | 1001.31 | 934 | 917 | 240.6 |
| D | 2 | 250 | 37026 | 150.1 | 934 | 917 | 240.6 |
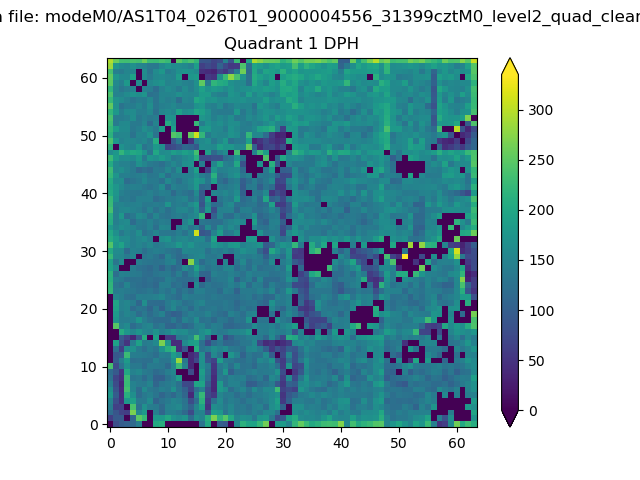
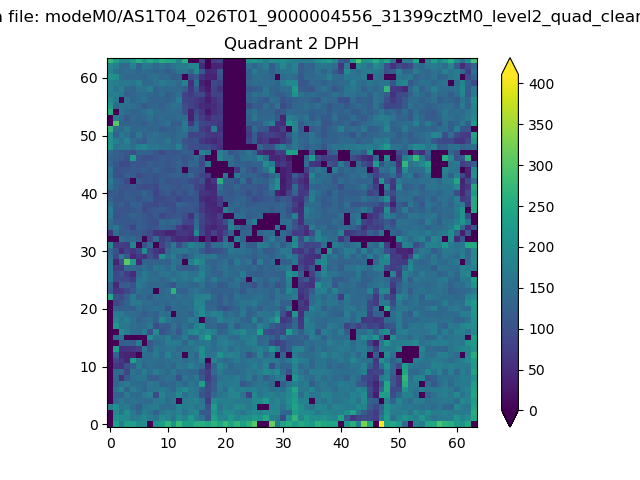
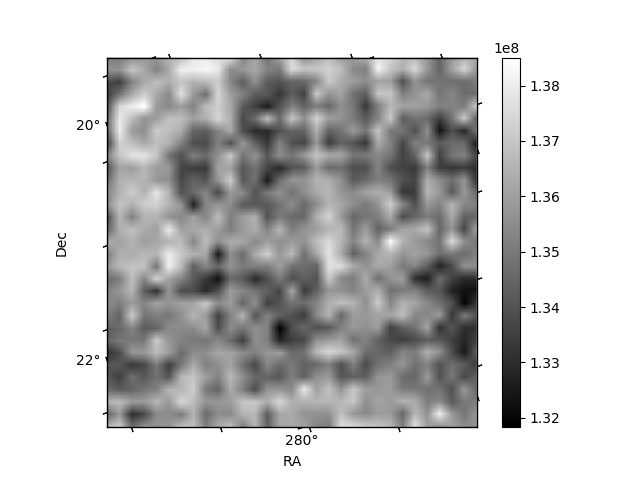
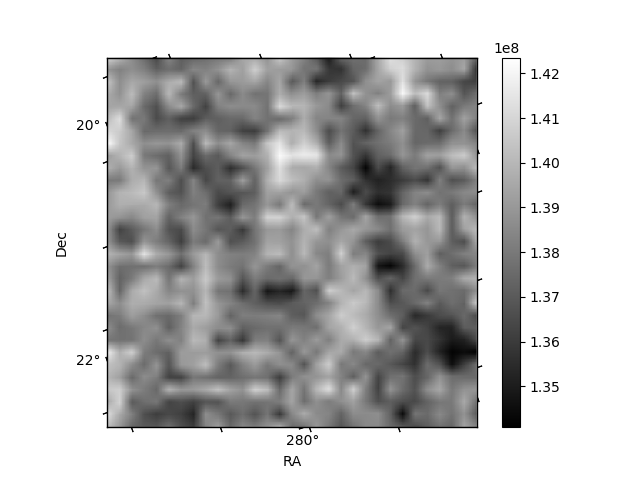
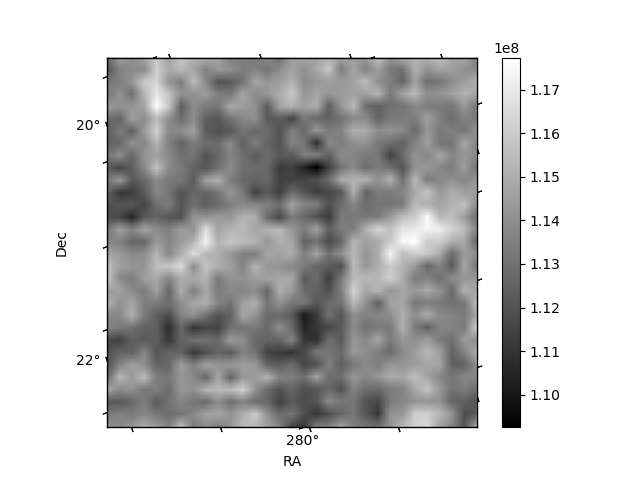
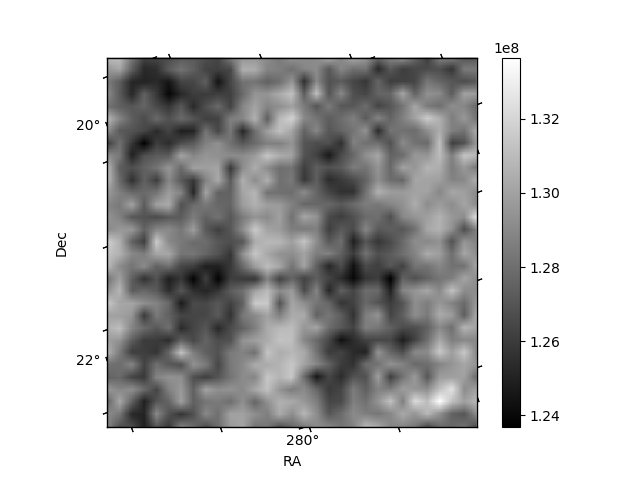
Histogram calculated using DETX and DETY for each event in the final _common_clean file
| Quadrant A |  |
 |
Quadrant B |
|---|---|---|---|
| Quadrant D |  |
 |
Quadrant C |
| Plot type | Count rate plots | Images |
|---|---|---|
| Comparison with Poisson distribution Blue bars denote a histogram of data divided into 1 sec bins. Red curve is a Poisson curve with rate = median count rate of data. |
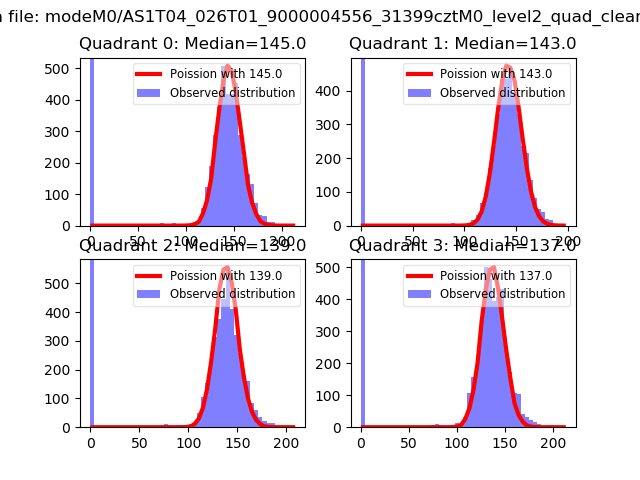 |
 |
| Quadrant-wise count rates Data is divided into 100 sec bins |
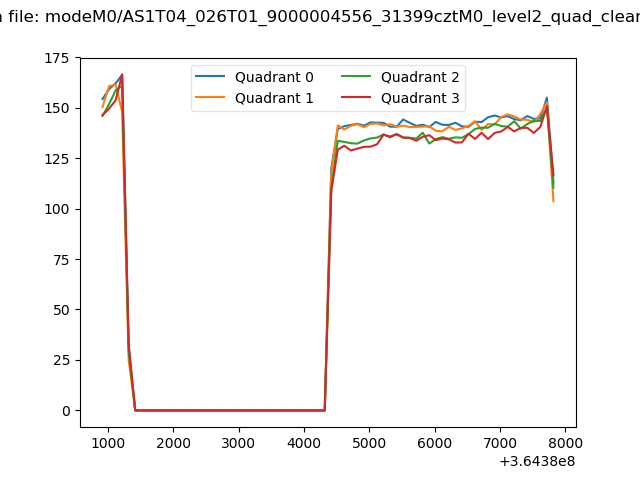 |
|
| Module-wise count rates for Quadrant A Data is divided into 100 sec bins |
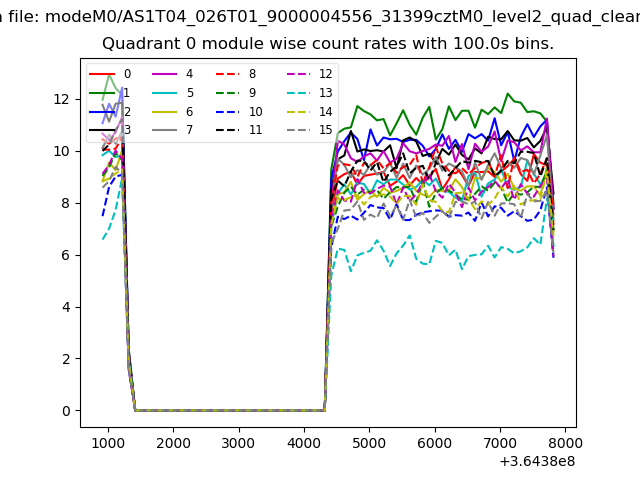 |
 |
| Module-wise count rates for Quadrant B Data is divided into 100 sec bins |
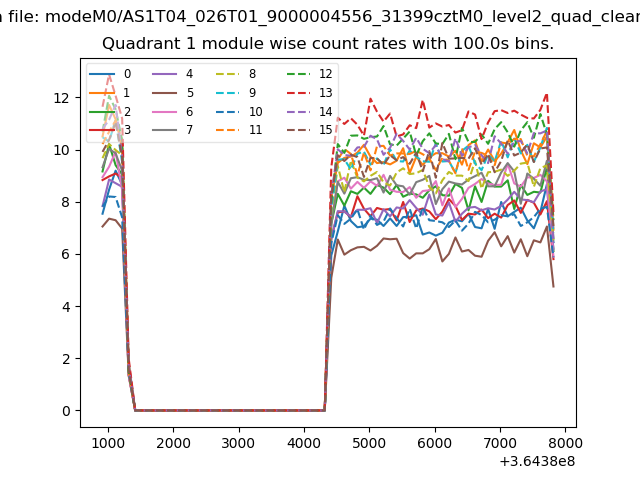 |
 |
| Module-wise count rates for Quadrant C Data is divided into 100 sec bins |
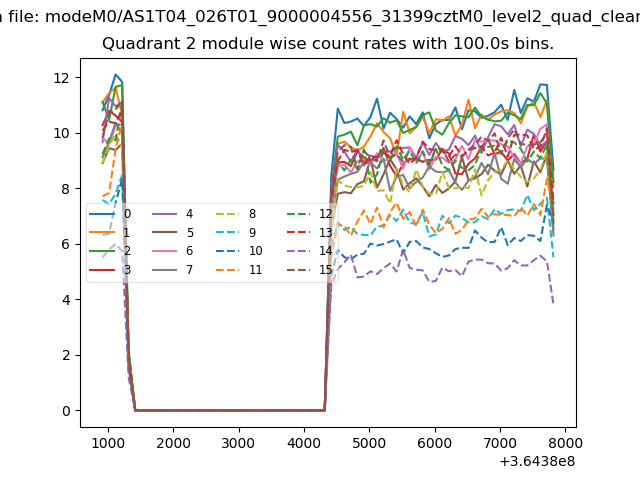 |
 |
| Module-wise count rates for Quadrant D Data is divided into 100 sec bins |
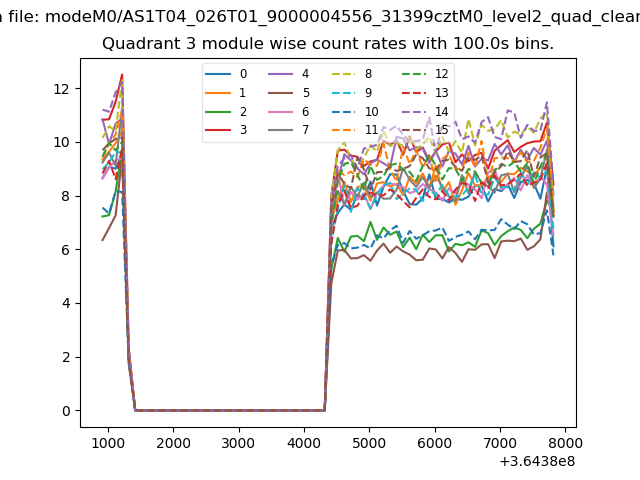 |
 |
| Parameter | Plot |
|---|---|
| CZT HV Monitor |  |
| D_VDD | 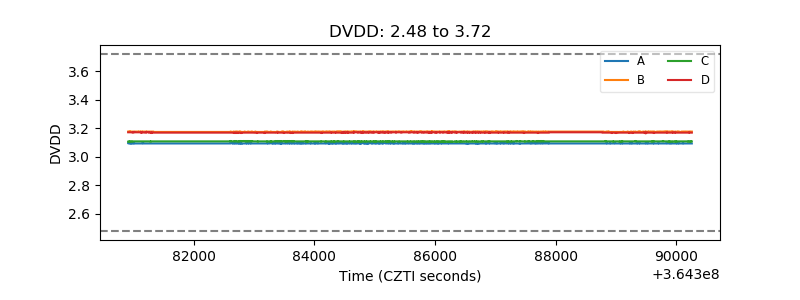 |
| Temperature 1 | 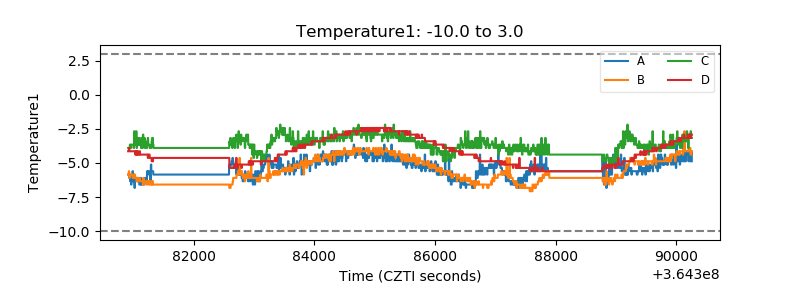 |
| Veto HV Monitor | 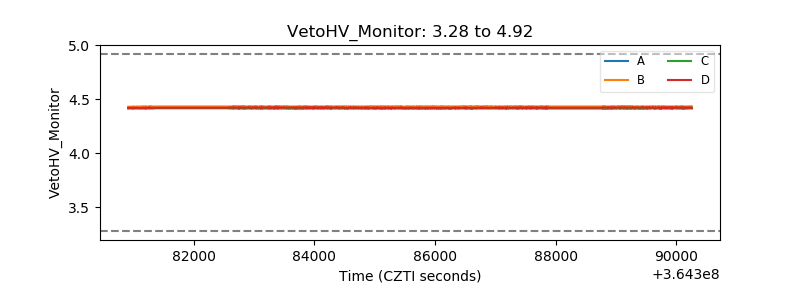 |
| Veto LLD |  |
| Alpha Counter | 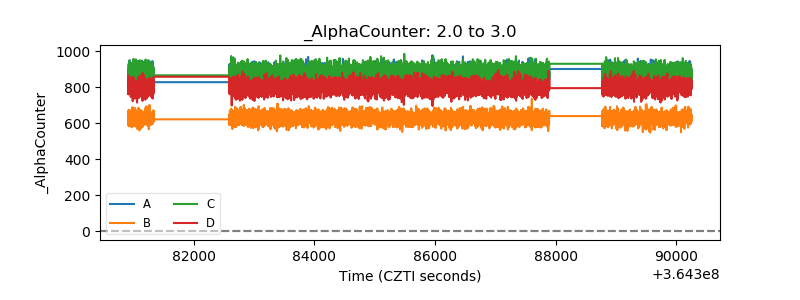 |
| _CPM_Rate | 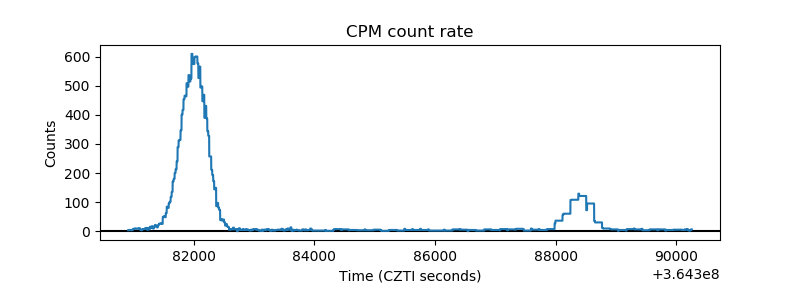 |
| CZT Counter | 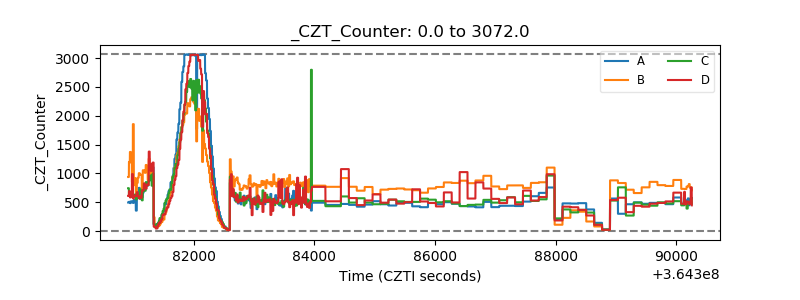 |
| +2.5 Volts monitor |  |
| +5 Volts monitor |  |
| _ROLL_ROT | 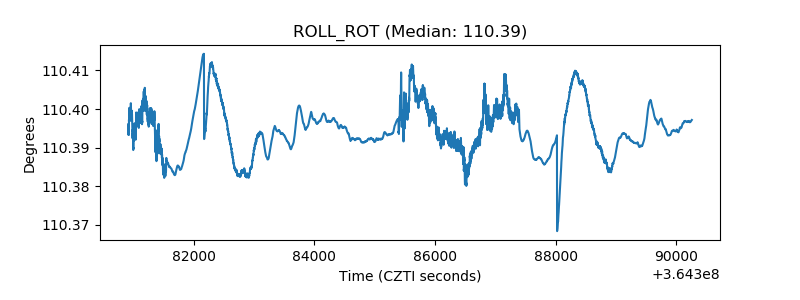 |
| _Roll_DEC | 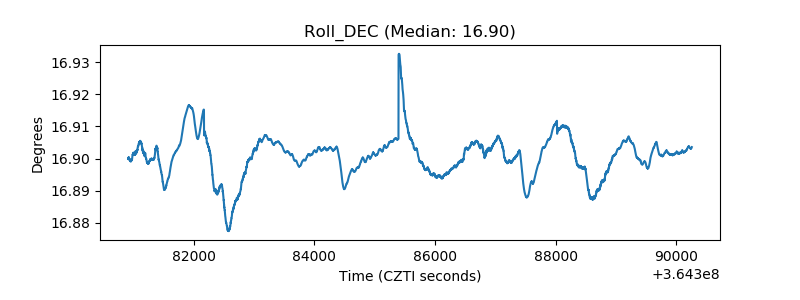 |
| _Roll_RA | 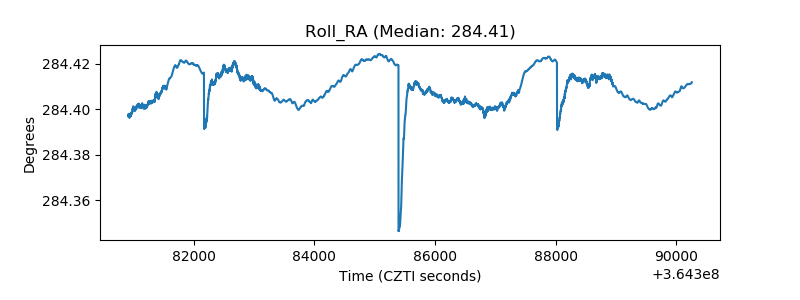 |
| Veto Counter | 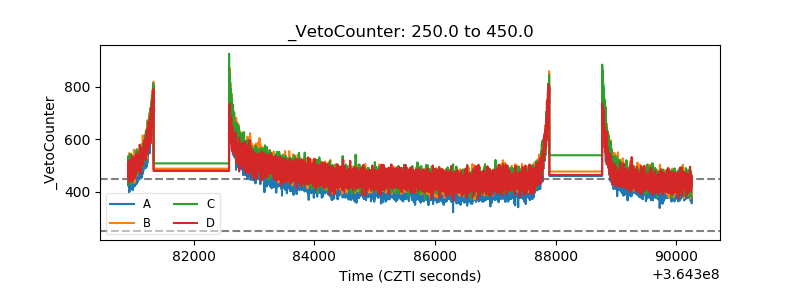 |