| Param | Original file | Final file |
|---|---|---|
| Filename | modeM0/AS1T04_026T01_9000004556_31402cztM0_level2.evt | modeM0/AS1T04_026T01_9000004556_31402cztM0_level2_quad_clean.evt |
| Size (bytes) | 792,895,680 | 94,078,080 |
| Size | 756.2 MB | 89.7 MB |
| Events in quadrant A | 3,444,291 | 645,099 |
| Events in quadrant B | 5,368,919 | 646,040 |
| Events in quadrant C | 3,855,167 | 613,398 |
| Events in quadrant D | 10,893,432 | 477,598 |
| Mode M9 | |||
|---|---|---|---|
| Quadrant | BADHDUFLAG | Total packets | Discarded packets |
| A | 0 | 2 | 0 |
| B | 0 | 2 | 0 |
| C | 0 | 2 | 0 |
| D | 0 | 2 | 0 |
| Mode M0 | |||
|---|---|---|---|
| Quadrant | BADHDUFLAG | Total packets | Discarded packets |
| A | 0 | 14754 | 1 |
| B | 0 | 21688 | 1 |
| C | 0 | 15885 | 1 |
| D | 0 | 37139 | 1 |
| Mode SS | |||
|---|---|---|---|
| Quadrant | BADHDUFLAG | Total packets | Discarded packets |
| A | 0 | 146 | 0 |
| B | 0 | 146 | 0 |
| C | 0 | 146 | 0 |
| D | 0 | -1 | -1 |
| Quadrant | Total seconds | Saturated seconds | Saturation percentage |
|---|---|---|---|
| A | 7152 | 124 | 1.733781% |
| B | 7153 | 203 | 2.837970% |
| C | 7153 | 432 | 6.039424% |
| D | 7152 | 2772 | 38.758389% |
Noise dominated data is calculated using 1-second bins in cleaned event files. If a bin has >2000 counts, and if more than 50% of those come from <1% of pixels, then it is considered to be noise-dominated and hence unusable.
| Quadrant | # 1 sec bins | Bins with >0 counts | Bins with >2000 counts | High rate bins dominated by noise | Noise dominated (total time) | Noise dominated (detector-on time) | Marked lightcurve |
|---|---|---|---|---|---|---|---|
| A | 7367 | 7153 | 0 | 0 | 0.00% | 0.00% | 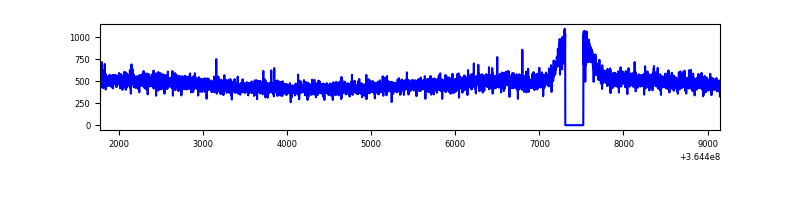 |
| B | 7368 | 7154 | 1 | 1 | 0.01% | 0.01% | 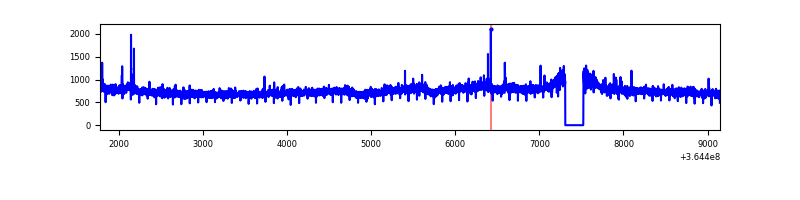 |
| C | 7368 | 7154 | 1 | 1 | 0.01% | 0.01% | 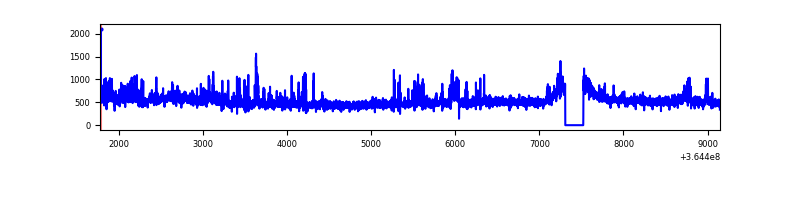 |
| D | 7367 | 7153 | 2384 | 2384 | 32.36% | 33.33% | 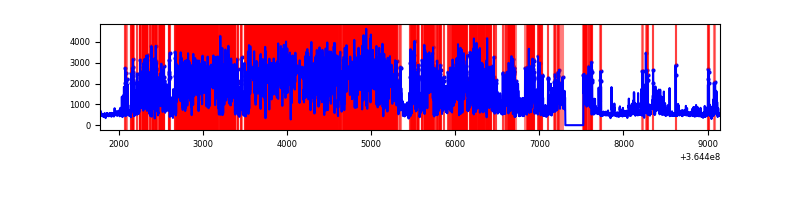 |
Top three noisy pixels from each quadrant. If the there are fewer than three noisy pixels in the level2.evt file, extra rows are filled as -1
| Pixel properties | Quadrant properties | ||||||
|---|---|---|---|---|---|---|---|
| Quadrant | DetID | PixID | Counts | Sigma | Mean | Median | Sigma |
| A | 13 | 254 | 12317 | 63.32 | 893 | 874 | 180.7 |
| A | 3 | 137 | 9458 | 47.5 | 893 | 874 | 180.7 |
| A | 0 | 226 | 7561 | 37.0 | 893 | 874 | 180.7 |
| B | 6 | 159 | 1869820 | 10986.56 | 875 | 852 | 170.1 |
| B | 4 | 80 | 22710 | 128.49 | 875 | 852 | 170.1 |
| B | 12 | 111 | 22008 | 124.36 | 875 | 852 | 170.1 |
| C | 14 | 238 | 224274 | 1108.66 | 844 | 849 | 201.5 |
| C | 14 | 254 | 128438 | 633.11 | 844 | 849 | 201.5 |
| C | 3 | 233 | 101386 | 498.88 | 844 | 849 | 201.5 |
| D | 12 | 218 | 7330852 | 40848.41 | 740 | 719 | 179.4 |
| D | 8 | 195 | 256846 | 1427.31 | 740 | 719 | 179.4 |
| D | 12 | 250 | 172873 | 959.36 | 740 | 719 | 179.4 |
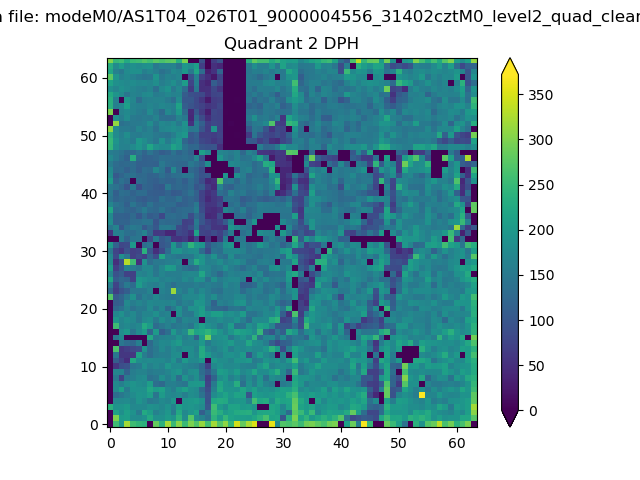
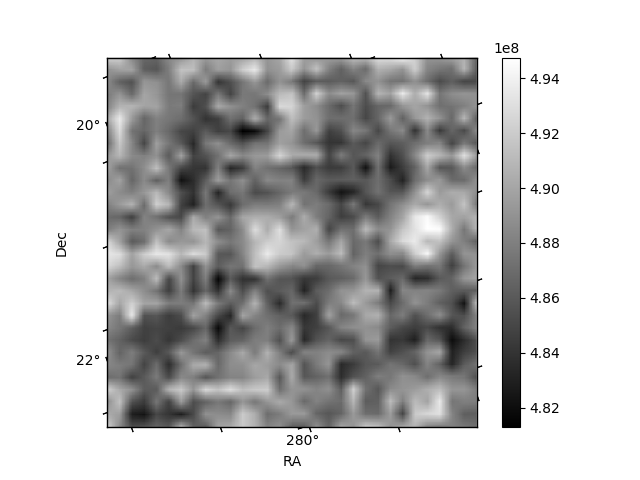
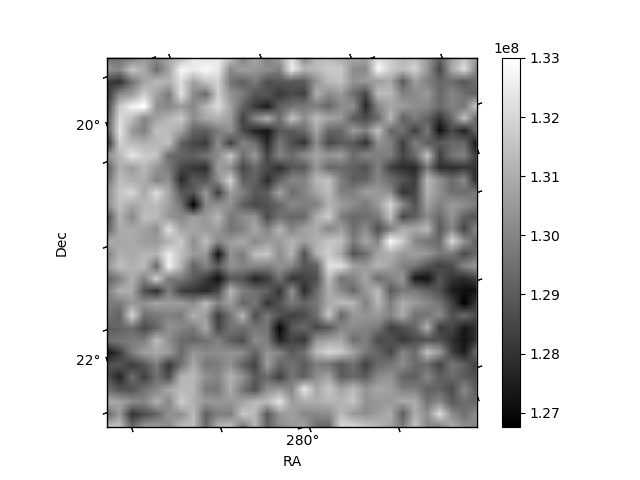
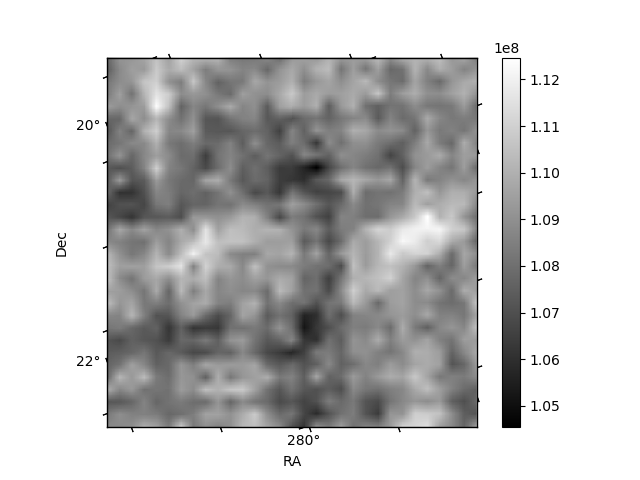
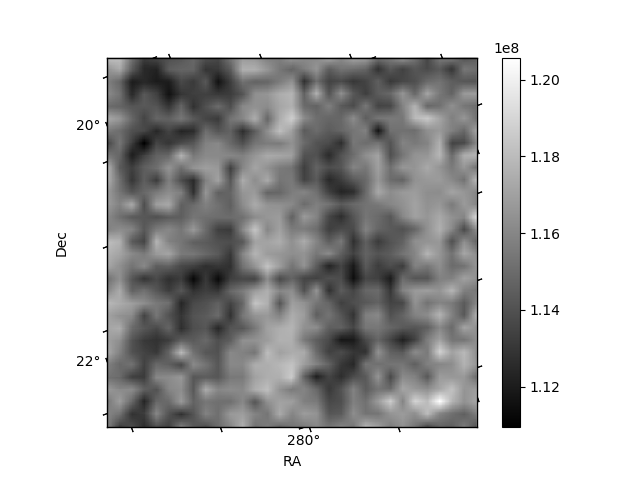
Histogram calculated using DETX and DETY for each event in the final _common_clean file
| Quadrant A | 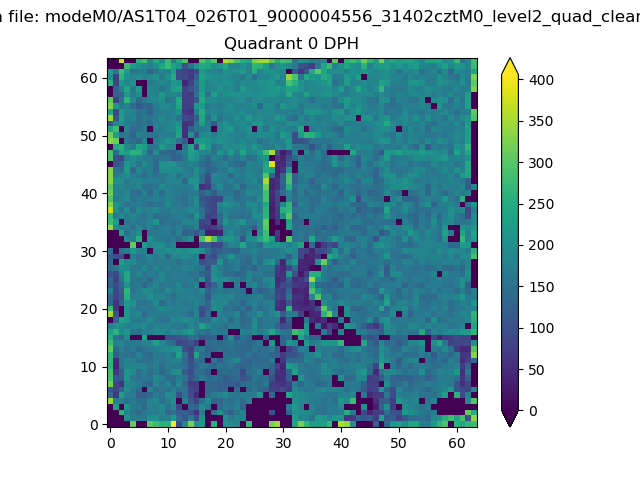 |
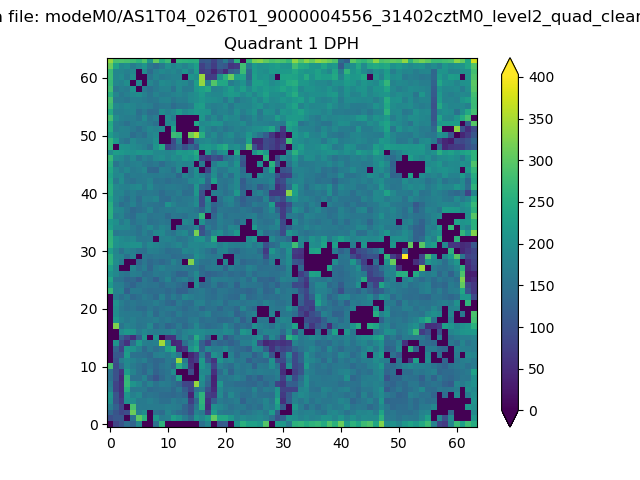 |
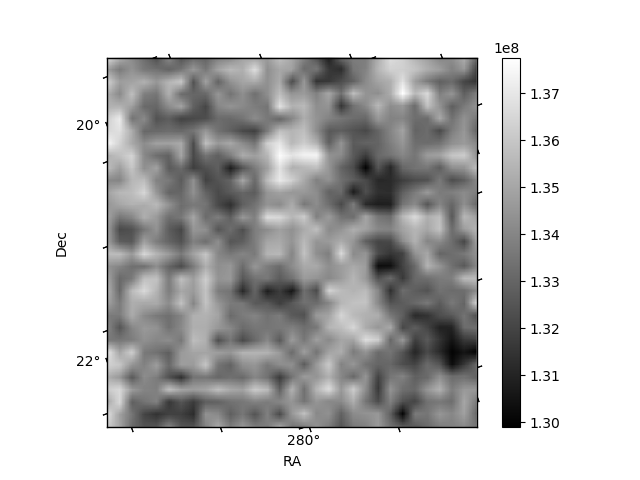
Quadrant B |
|---|---|---|---|
| Quadrant D | 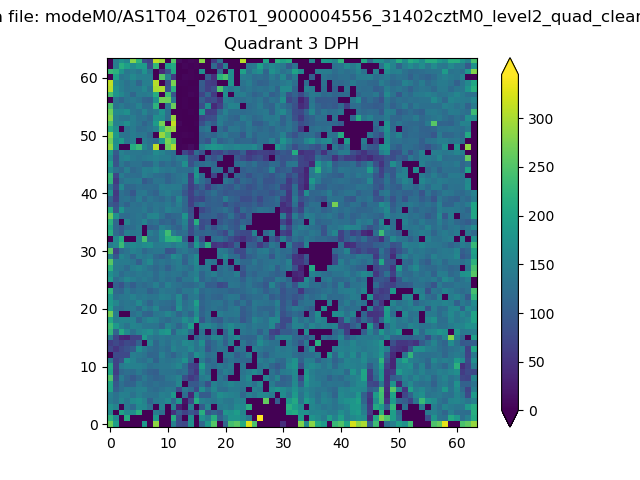 |
 |
Quadrant C |
| Plot type | Count rate plots | Images |
|---|---|---|
| Comparison with Poisson distribution Blue bars denote a histogram of data divided into 1 sec bins. Red curve is a Poisson curve with rate = median count rate of data. |
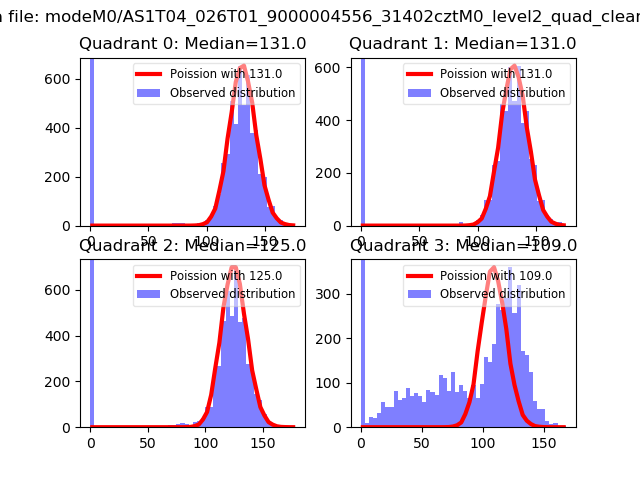 |
 |
| Quadrant-wise count rates Data is divided into 100 sec bins |
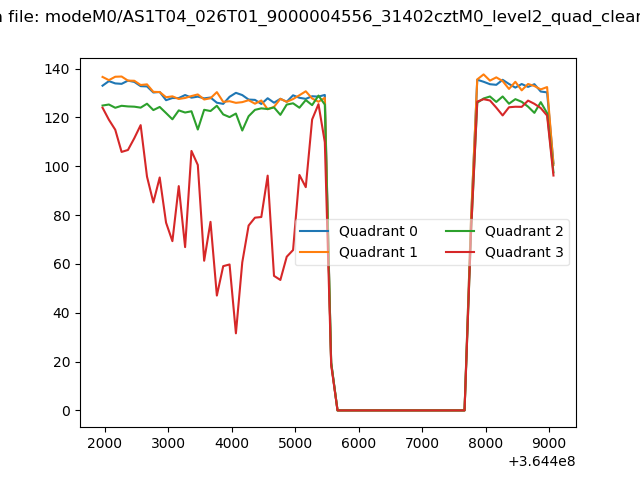 |
|
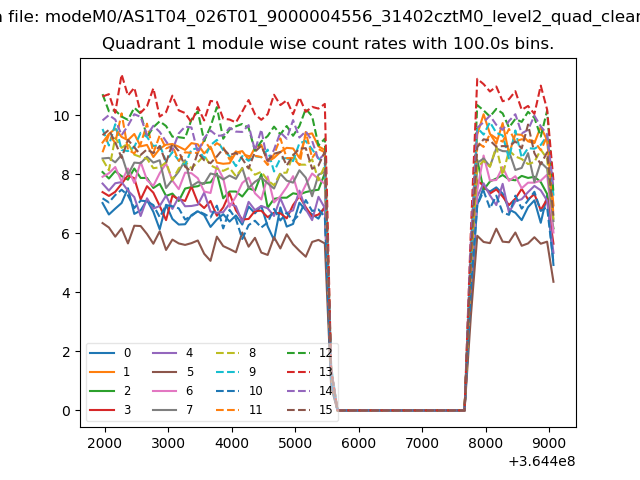
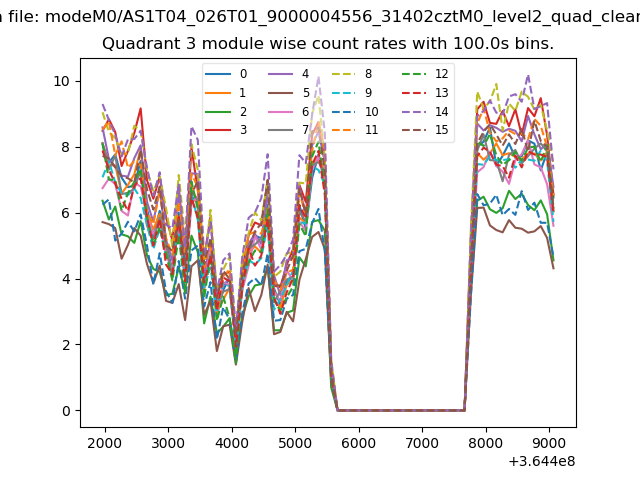
| Module-wise count rates for Quadrant A Data is divided into 100 sec bins |
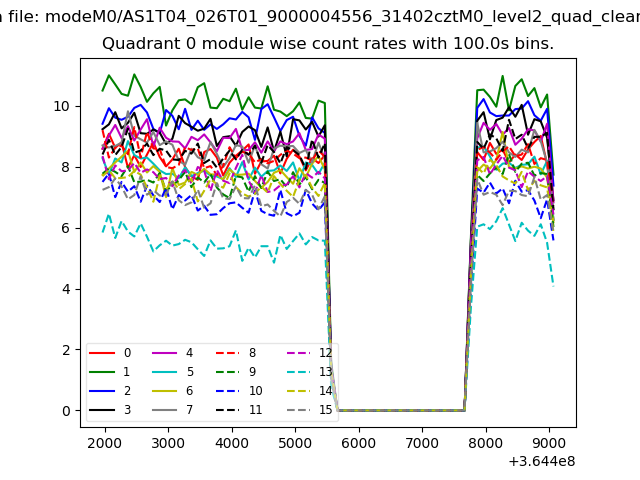 |
 |
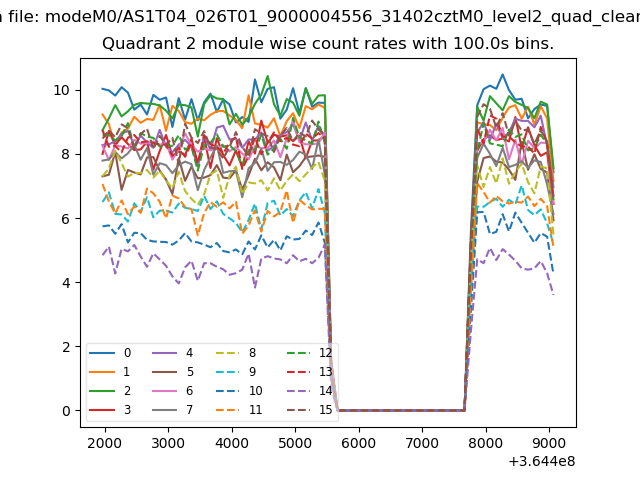
| Module-wise count rates for Quadrant B Data is divided into 100 sec bins |
 |
 |
| Module-wise count rates for Quadrant C Data is divided into 100 sec bins |
 |
 |
| Module-wise count rates for Quadrant D Data is divided into 100 sec bins |
 |
 |
| Parameter | Plot |
|---|---|
| CZT HV Monitor | 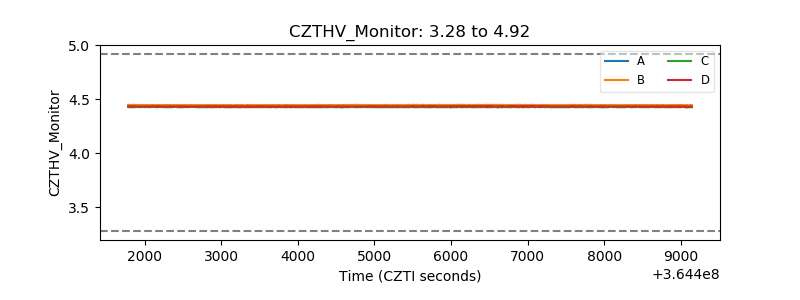 |
| D_VDD | 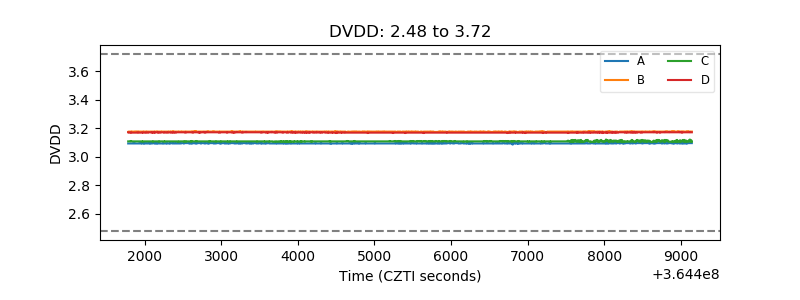 |
| Temperature 1 | 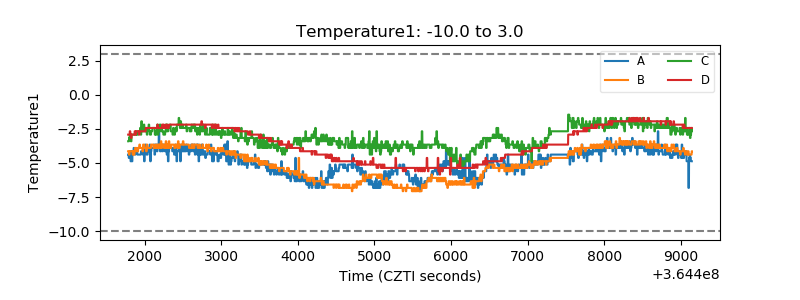 |
| Veto HV Monitor | 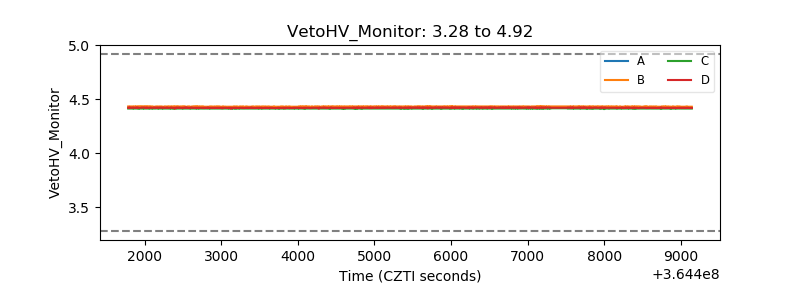 |
| Veto LLD | 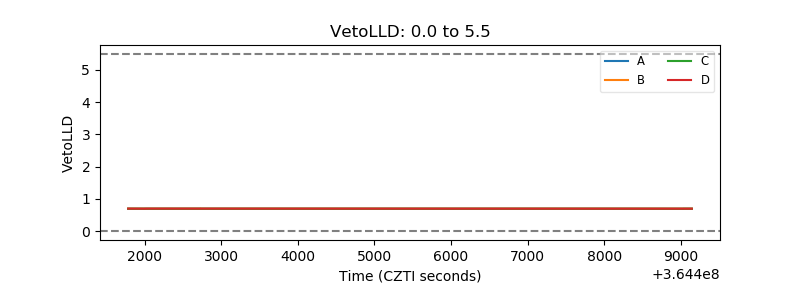 |
| Alpha Counter | 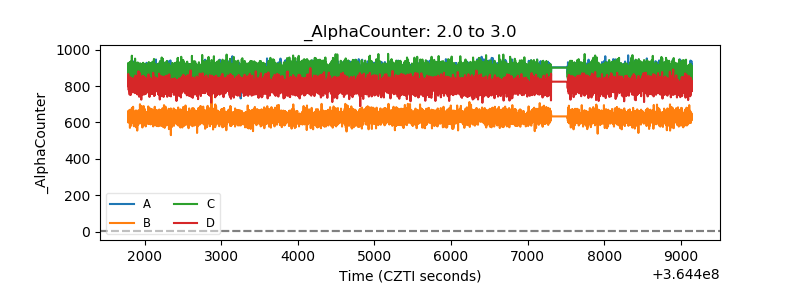 |
| _CPM_Rate | 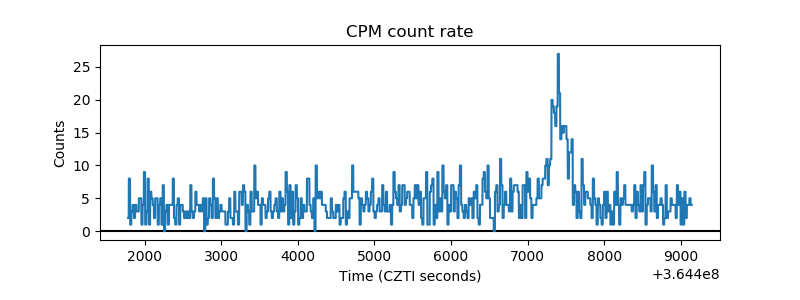 |
| CZT Counter | 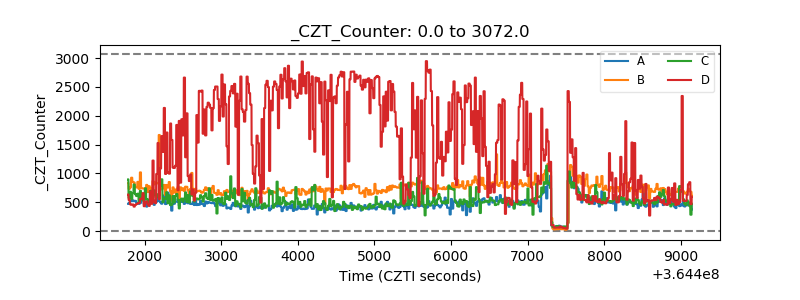 |
| +2.5 Volts monitor | 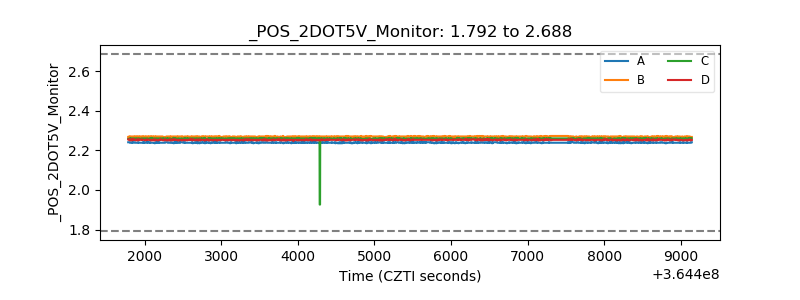 |
| +5 Volts monitor |  |
| _ROLL_ROT |  |
| _Roll_DEC |  |
| _Roll_RA | 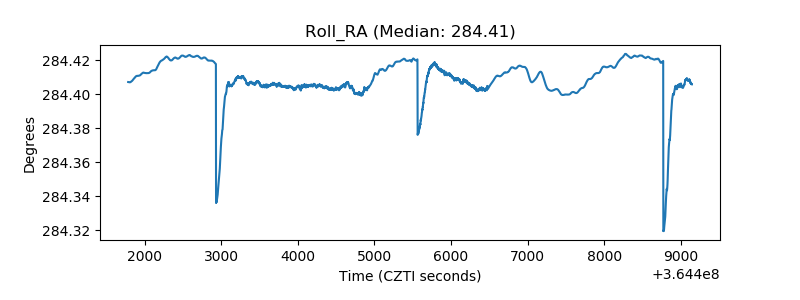 |
| Veto Counter | 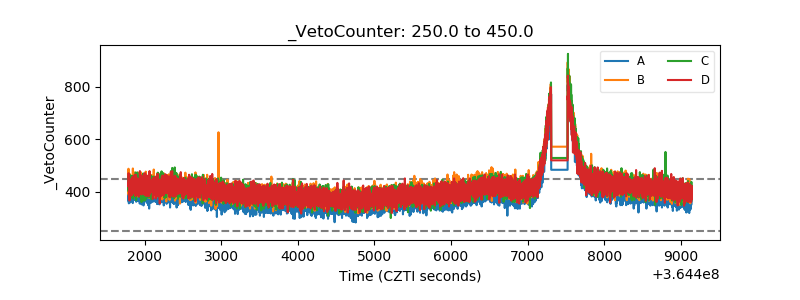 |