| Param | Original file | Final file |
|---|---|---|
| Filename | modeM0/AS1T04_026T01_9000004556_31404cztM0_level2.evt | modeM0/AS1T04_026T01_9000004556_31404cztM0_level2_quad_clean.evt |
| Size (bytes) | 439,637,760 | 72,731,520 |
| Size | 419.3 MB | 69.4 MB |
| Events in quadrant A | 2,625,915 | 463,880 |
| Events in quadrant B | 4,202,098 | 462,118 |
| Events in quadrant C | 2,796,631 | 443,151 |
| Events in quadrant D | 3,306,832 | 438,585 |
| Mode M0 | |||
|---|---|---|---|
| Quadrant | BADHDUFLAG | Total packets | Discarded packets |
| A | 0 | 11486 | 0 |
| B | 0 | 16983 | 0 |
| C | 0 | 11799 | 1 |
| D | 0 | 13532 | 0 |
| Mode SS | |||
|---|---|---|---|
| Quadrant | BADHDUFLAG | Total packets | Discarded packets |
| A | 0 | 112 | 0 |
| B | 0 | 112 | 0 |
| C | 0 | 112 | 0 |
| D | 0 | 112 | 0 |
| Quadrant | Total seconds | Saturated seconds | Saturation percentage |
|---|---|---|---|
| A | 5643 | 13 | 0.230374% |
| B | 5643 | 64 | 1.134149% |
| C | 5643 | 118 | 2.091086% |
| D | 5643 | 75 | 1.329080% |
Noise dominated data is calculated using 1-second bins in cleaned event files. If a bin has >2000 counts, and if more than 50% of those come from <1% of pixels, then it is considered to be noise-dominated and hence unusable.
| Quadrant | # 1 sec bins | Bins with >0 counts | Bins with >2000 counts | High rate bins dominated by noise | Noise dominated (total time) | Noise dominated (detector-on time) | Marked lightcurve |
|---|---|---|---|---|---|---|---|
| A | 5643 | 5643 | 0 | 0 | 0.00% | 0.00% | 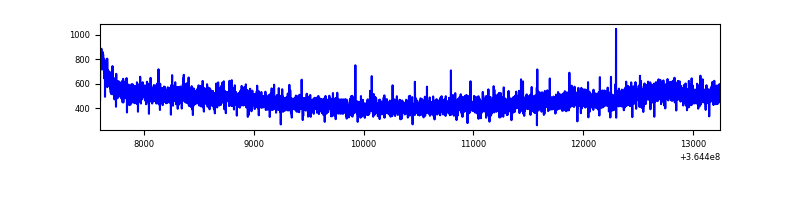 |
| B | 5643 | 5643 | 2 | 2 | 0.04% | 0.04% | 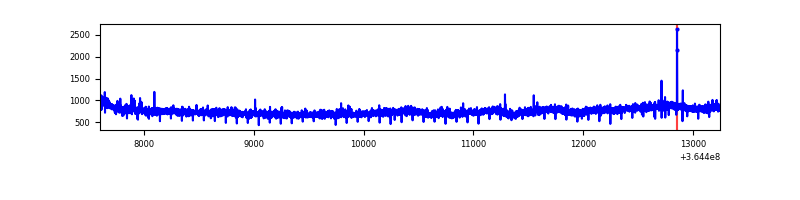 |
| C | 5643 | 5643 | 0 | 0 | 0.00% | 0.00% | 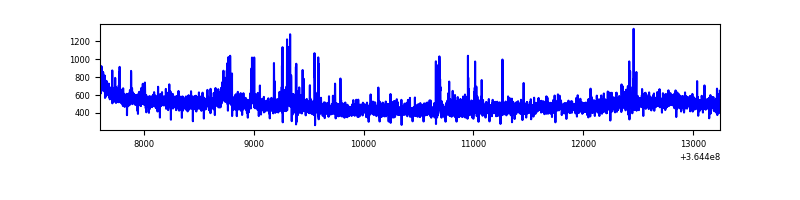 |
| D | 5643 | 5643 | 45 | 45 | 0.80% | 0.80% | 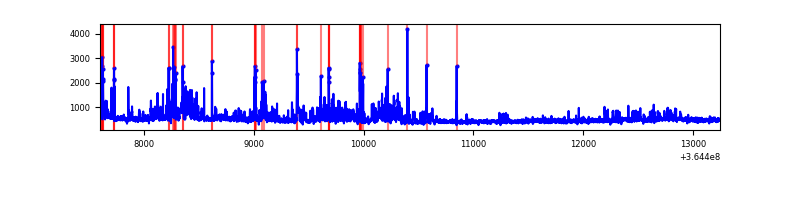 |
Top three noisy pixels from each quadrant. If the there are fewer than three noisy pixels in the level2.evt file, extra rows are filled as -1
| Pixel properties | Quadrant properties | ||||||
|---|---|---|---|---|---|---|---|
| Quadrant | DetID | PixID | Counts | Sigma | Mean | Median | Sigma |
| A | 13 | 254 | 10303 | 70.33 | 680 | 666 | 137.0 |
| A | 3 | 137 | 7298 | 48.4 | 680 | 666 | 137.0 |
| A | 0 | 226 | 5707 | 36.79 | 680 | 666 | 137.0 |
| B | 6 | 159 | 1521173 | 11670.38 | 670 | 654 | 130.3 |
| B | 12 | 111 | 16550 | 122.01 | 670 | 654 | 130.3 |
| B | 11 | 111 | 15473 | 113.74 | 670 | 654 | 130.3 |
| C | 14 | 238 | 145635 | 934.59 | 650 | 654 | 155.1 |
| C | 14 | 254 | 59014 | 376.21 | 650 | 654 | 155.1 |
| C | 3 | 233 | 27020 | 169.96 | 650 | 654 | 155.1 |
| D | 8 | 195 | 323931 | 2073.0 | 655 | 638 | 156.0 |
| D | 12 | 218 | 220667 | 1410.85 | 655 | 638 | 156.0 |
| D | 2 | 250 | 122797 | 783.3 | 655 | 638 | 156.0 |
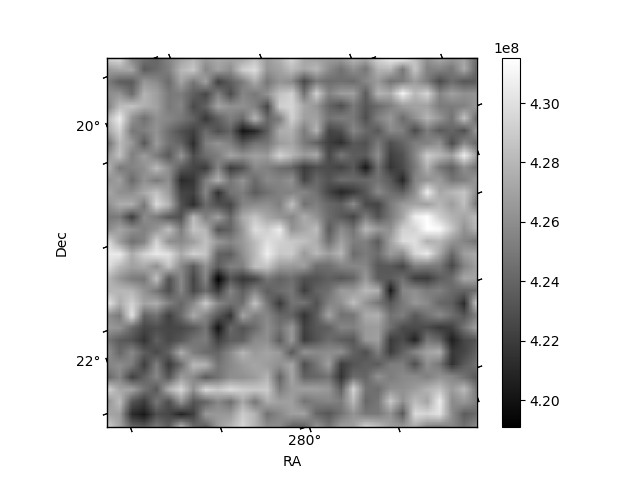
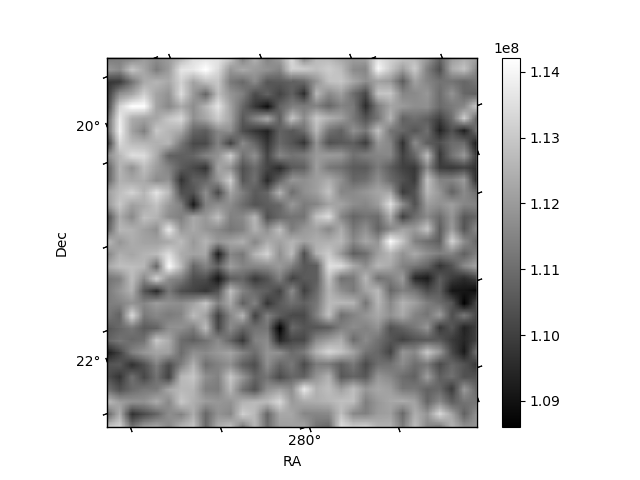
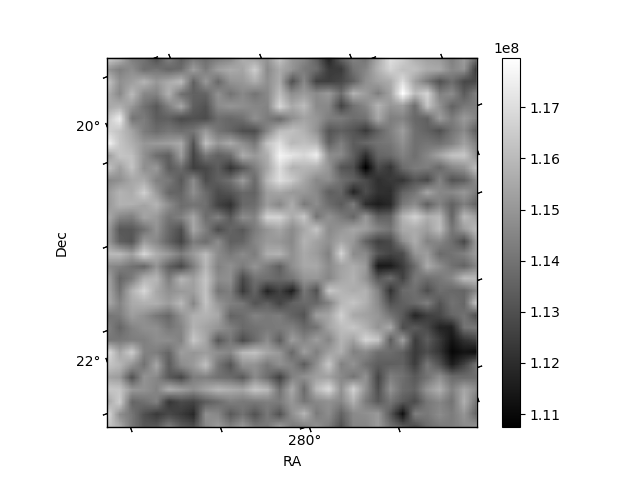
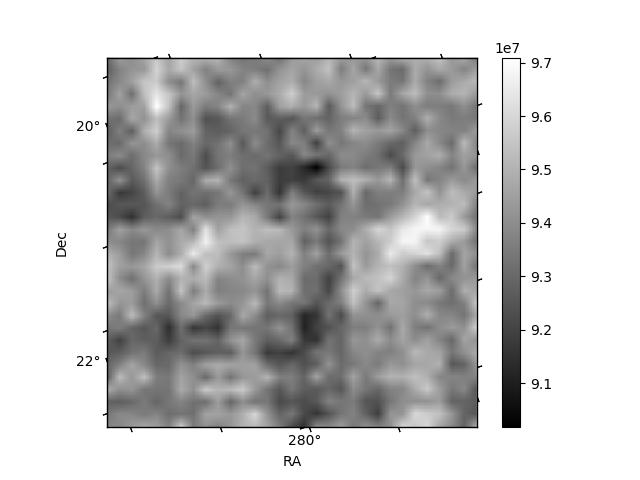
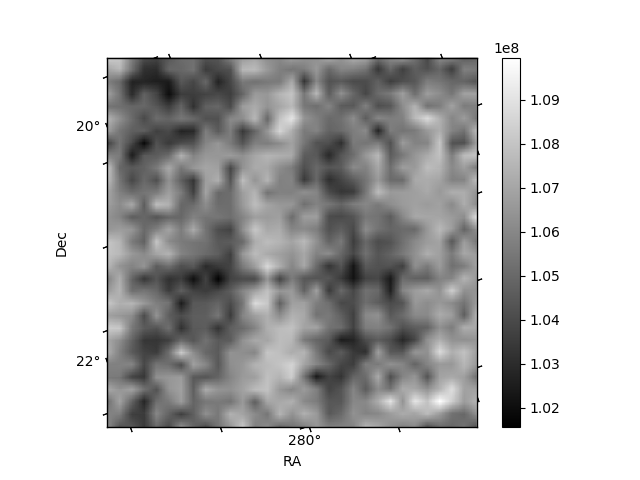
Histogram calculated using DETX and DETY for each event in the final _common_clean file
| Quadrant A | 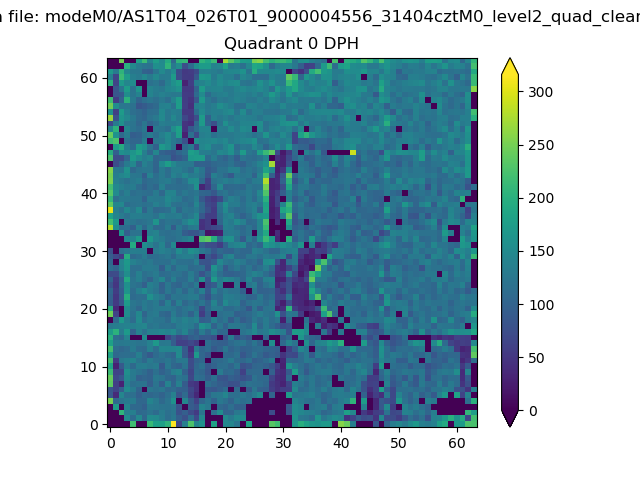 |
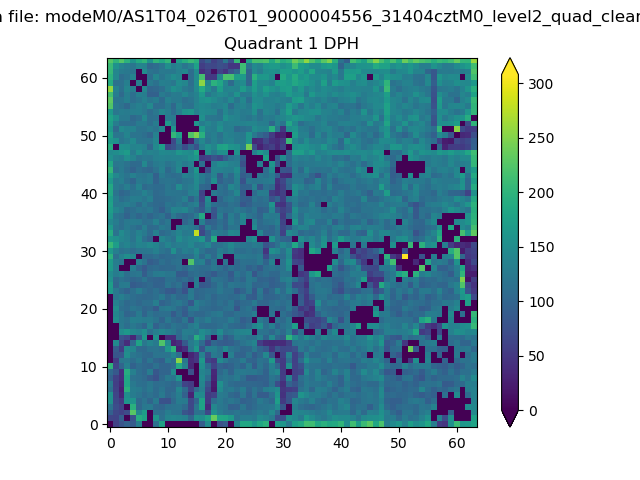 |
Quadrant B |
|---|---|---|---|
| Quadrant D | 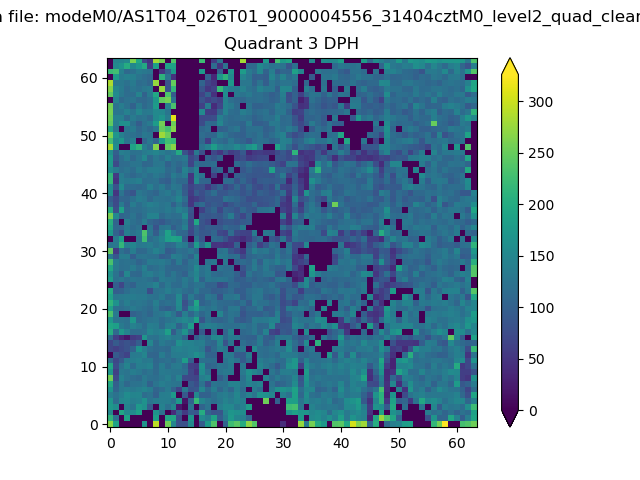 |
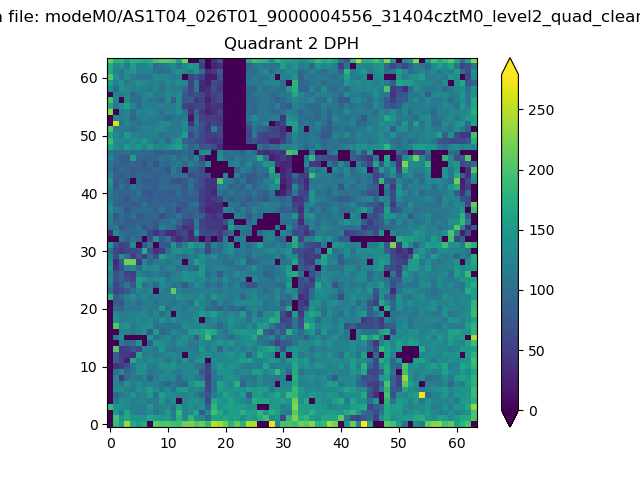 |
Quadrant C |
| Plot type | Count rate plots | Images |
|---|---|---|
| Comparison with Poisson distribution Blue bars denote a histogram of data divided into 1 sec bins. Red curve is a Poisson curve with rate = median count rate of data. |
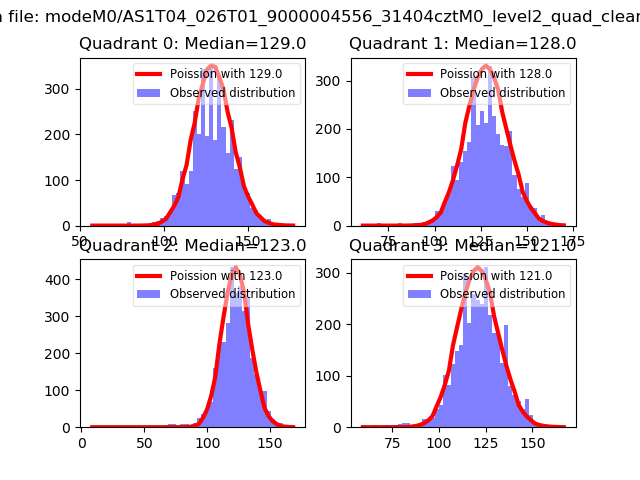 |
 |
| Quadrant-wise count rates Data is divided into 100 sec bins |
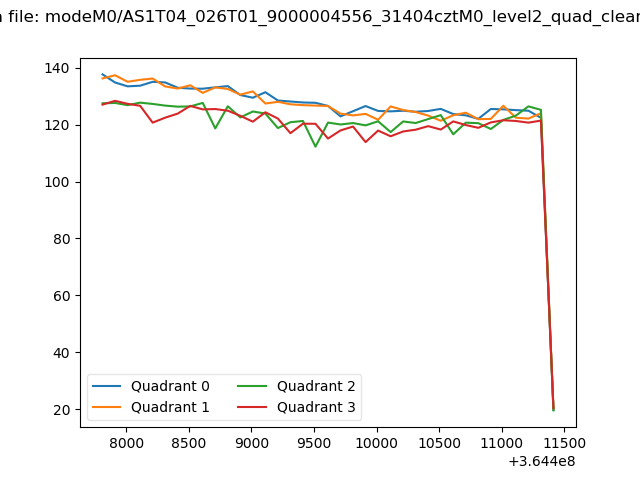 |
|
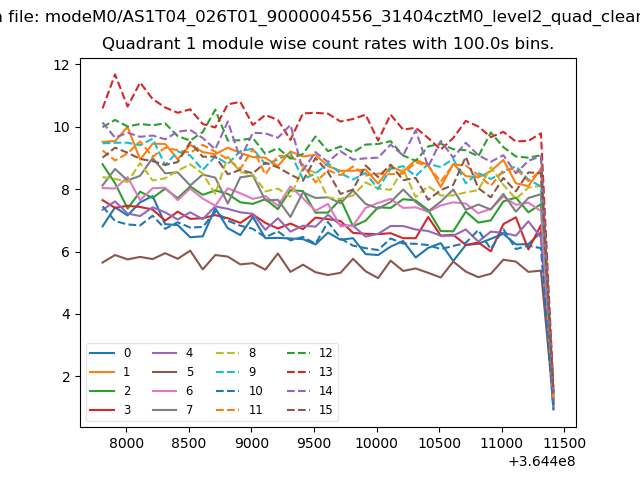
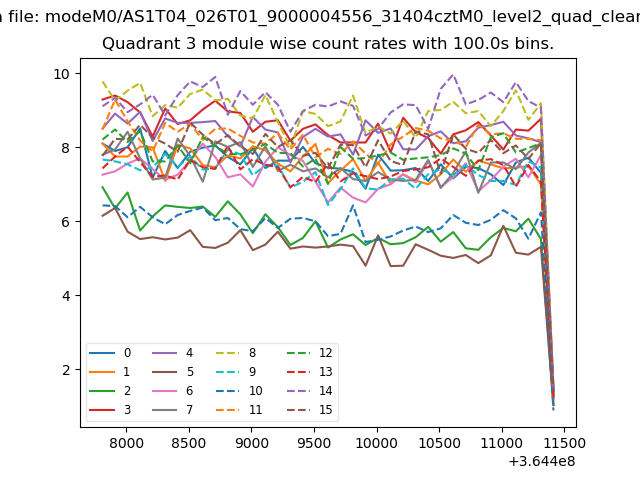
| Module-wise count rates for Quadrant A Data is divided into 100 sec bins |
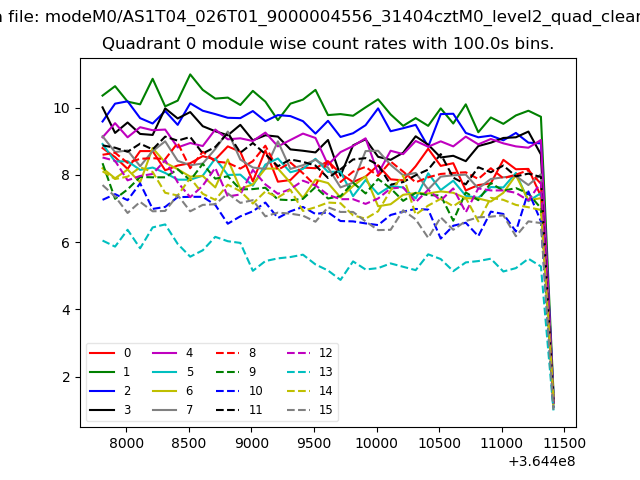 |
 |
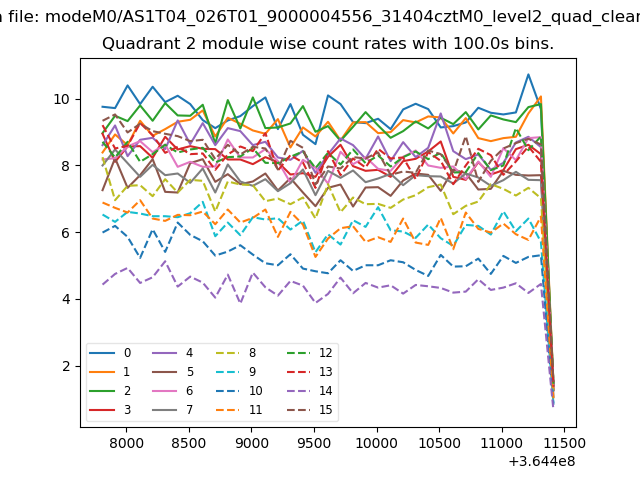
| Module-wise count rates for Quadrant B Data is divided into 100 sec bins |
 |
 |
| Module-wise count rates for Quadrant C Data is divided into 100 sec bins |
 |
 |
| Module-wise count rates for Quadrant D Data is divided into 100 sec bins |
 |
 |
| Parameter | Plot |
|---|---|
| CZT HV Monitor | 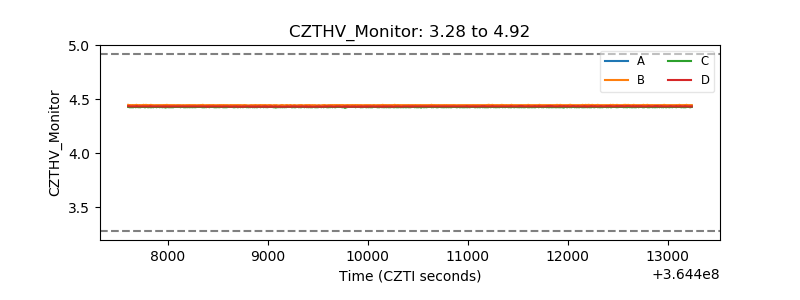 |
| D_VDD | 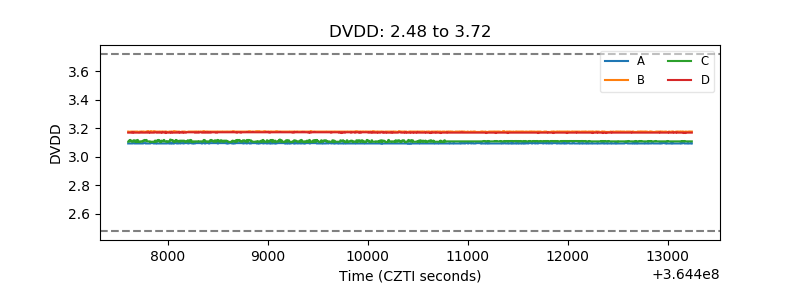 |
| Temperature 1 | 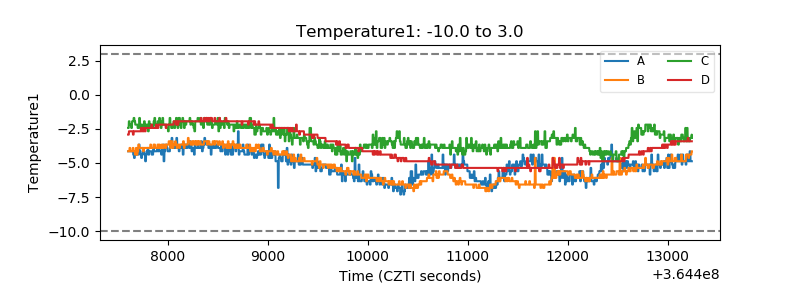 |
| Veto HV Monitor |  |
| Veto LLD | 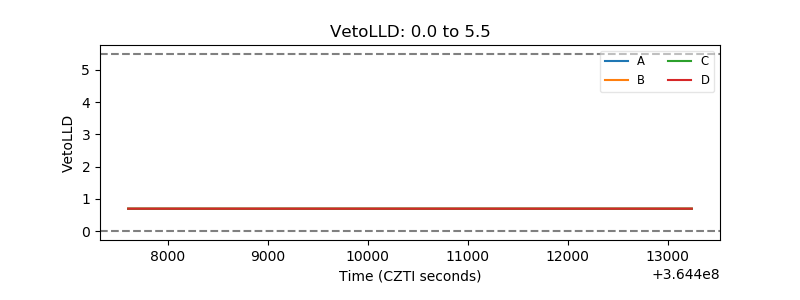 |
| Alpha Counter | 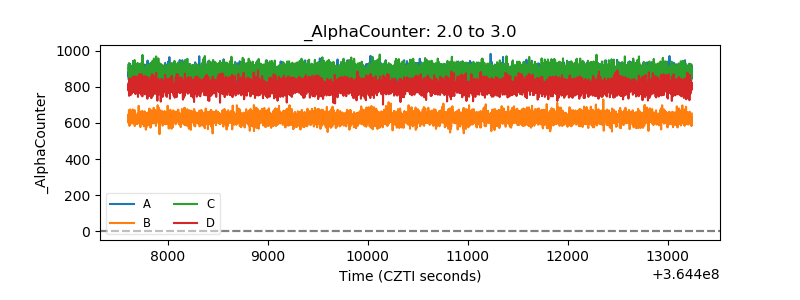 |
| _CPM_Rate | 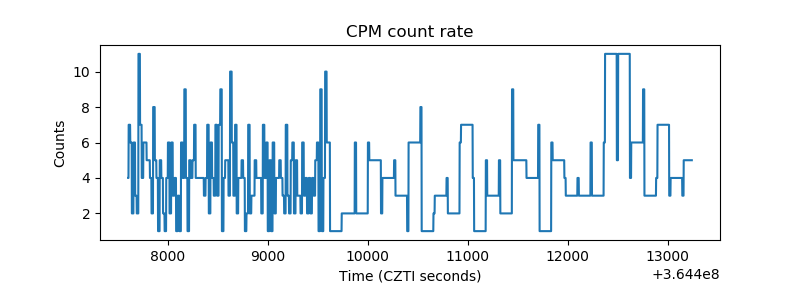 |
| CZT Counter | 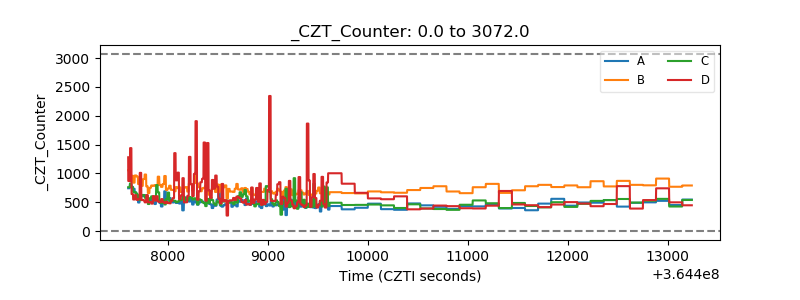 |
| +2.5 Volts monitor |  |
| +5 Volts monitor |  |
| _ROLL_ROT | 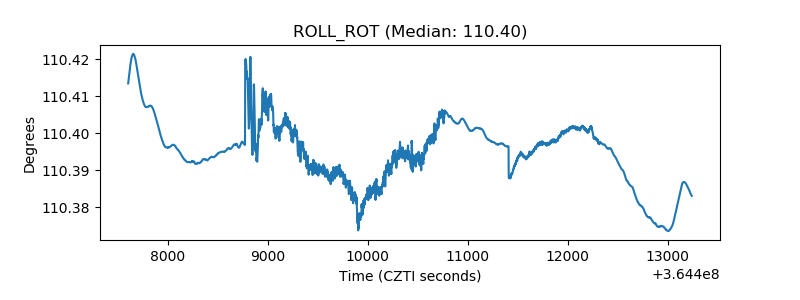 |
| _Roll_DEC |  |
| _Roll_RA | 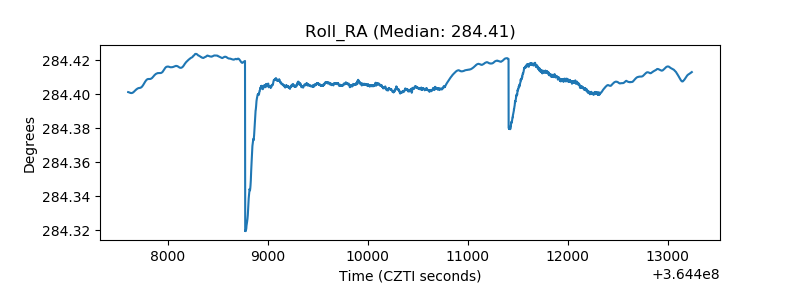 |
| Veto Counter | 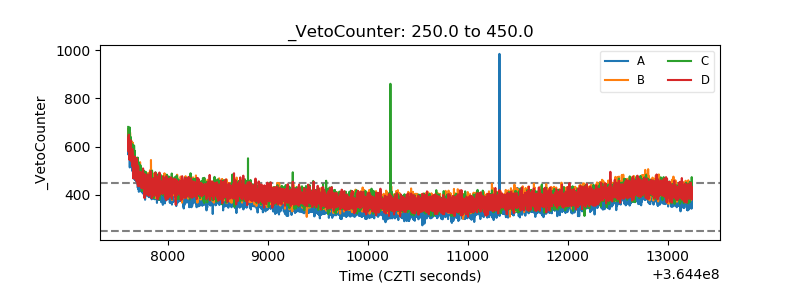 |