| Param | Original file | Final file |
|---|---|---|
| Filename | modeM0/AS1T04_026T01_9000004556_31405cztM0_level2.evt | modeM0/AS1T04_026T01_9000004556_31405cztM0_level2_quad_clean.evt |
| Size (bytes) | 1,068,912,000 | 168,958,080 |
| Size | 1019.4 MB | 161.1 MB |
| Events in quadrant A | 6,374,075 | 1,070,292 |
| Events in quadrant B | 10,390,699 | 1,068,776 |
| Events in quadrant C | 6,939,438 | 1,035,958 |
| Events in quadrant D | 7,761,731 | 1,014,929 |
| Mode M9 | |||
|---|---|---|---|
| Quadrant | BADHDUFLAG | Total packets | Discarded packets |
| A | 0 | 18 | 0 |
| B | 0 | 18 | 0 |
| C | 0 | 18 | 0 |
| D | 0 | 18 | 0 |
| Mode M0 | |||
|---|---|---|---|
| Quadrant | BADHDUFLAG | Total packets | Discarded packets |
| A | 0 | 27728 | 3 |
| B | 0 | 41014 | 3 |
| C | 0 | 29192 | 3 |
| D | 0 | 32061 | 3 |
| Mode SS | |||
|---|---|---|---|
| Quadrant | BADHDUFLAG | Total packets | Discarded packets |
| A | 0 | 276 | 0 |
| B | 0 | 276 | 0 |
| C | 0 | 276 | 0 |
| D | 0 | 276 | 0 |
| Quadrant | Total seconds | Saturated seconds | Saturation percentage |
|---|---|---|---|
| A | 13414 | 143 | 1.066050% |
| B | 13414 | 353 | 2.631579% |
| C | 13415 | 333 | 2.482296% |
| D | 13415 | 245 | 1.826314% |
Noise dominated data is calculated using 1-second bins in cleaned event files. If a bin has >2000 counts, and if more than 50% of those come from <1% of pixels, then it is considered to be noise-dominated and hence unusable.
| Quadrant | # 1 sec bins | Bins with >0 counts | Bins with >2000 counts | High rate bins dominated by noise | Noise dominated (total time) | Noise dominated (detector-on time) | Marked lightcurve |
|---|---|---|---|---|---|---|---|
| A | 15334 | 13416 | 0 | 0 | 0.00% | 0.00% | 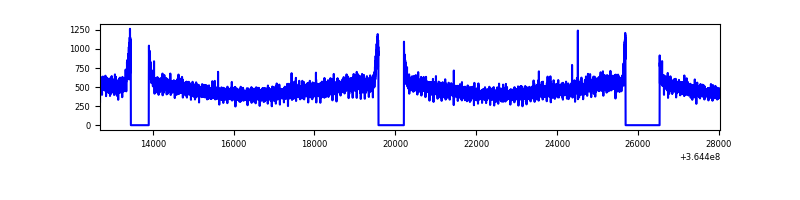 |
| B | 15334 | 13416 | 7 | 7 | 0.05% | 0.05% | 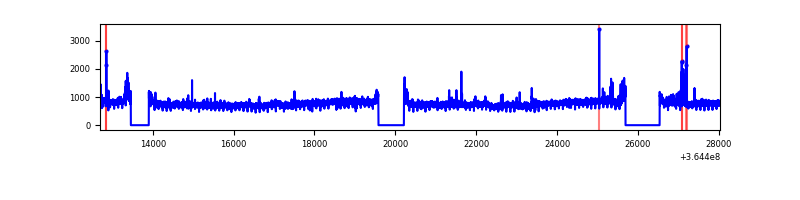 |
| C | 15335 | 13417 | 8 | 8 | 0.05% | 0.06% | 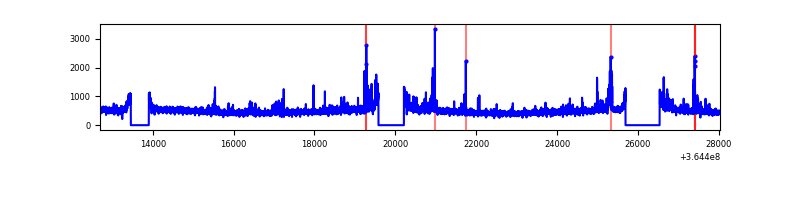 |
| D | 15335 | 13418 | 125 | 125 | 0.82% | 0.93% | 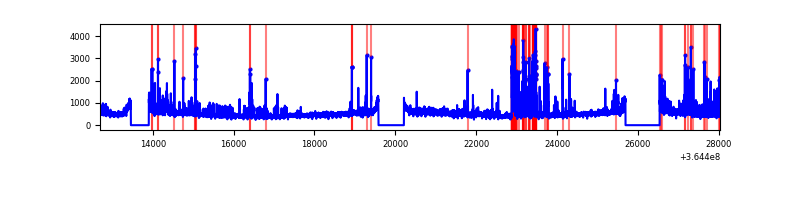 |
Top three noisy pixels from each quadrant. If the there are fewer than three noisy pixels in the level2.evt file, extra rows are filled as -1
| Pixel properties | Quadrant properties | ||||||
|---|---|---|---|---|---|---|---|
| Quadrant | DetID | PixID | Counts | Sigma | Mean | Median | Sigma |
| A | 13 | 254 | 21208 | 59.38 | 1652 | 1612 | 330.0 |
| A | 3 | 137 | 17844 | 49.18 | 1652 | 1612 | 330.0 |
| A | 0 | 226 | 13377 | 35.65 | 1652 | 1612 | 330.0 |
| B | 6 | 159 | 3719322 | 11911.84 | 1625 | 1580 | 312.1 |
| B | 0 | 190 | 110877 | 350.19 | 1625 | 1580 | 312.1 |
| B | 4 | 80 | 100061 | 315.54 | 1625 | 1580 | 312.1 |
| C | 14 | 238 | 279966 | 741.68 | 1591 | 1601 | 375.3 |
| C | 10 | 22 | 250443 | 663.02 | 1591 | 1601 | 375.3 |
| C | 3 | 233 | 139135 | 366.45 | 1591 | 1601 | 375.3 |
| D | 8 | 195 | 727607 | 1894.76 | 1604 | 1563 | 383.2 |
| D | 12 | 218 | 560886 | 1459.66 | 1604 | 1563 | 383.2 |
| D | 2 | 250 | 173031 | 447.48 | 1604 | 1563 | 383.2 |
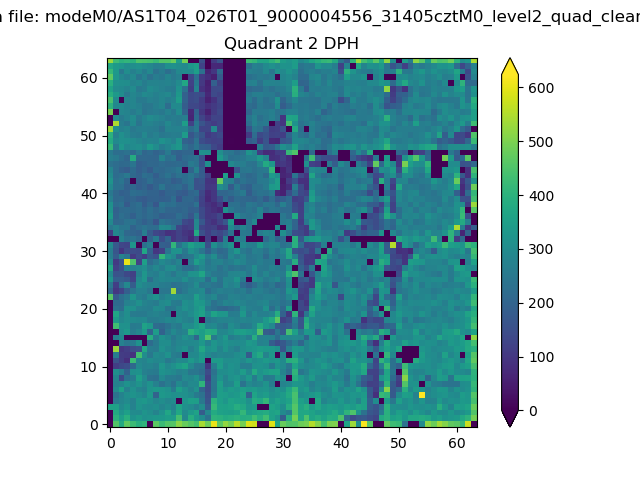
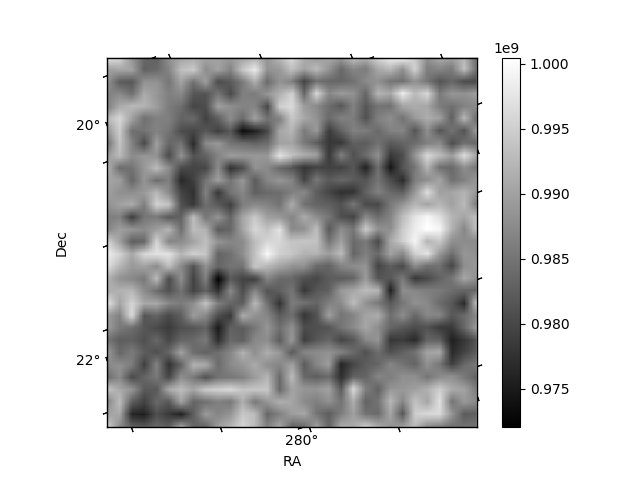
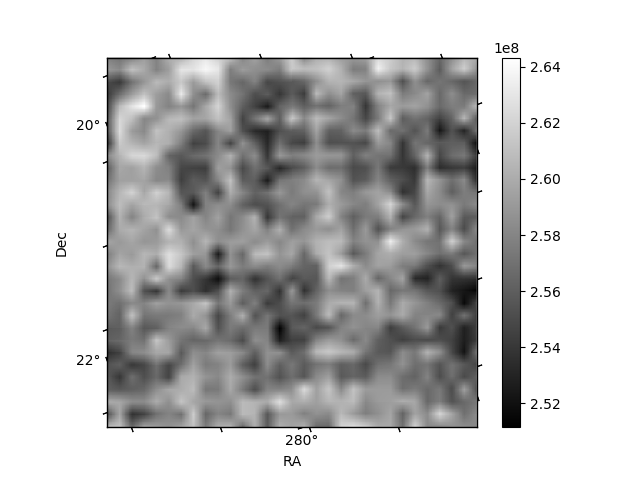
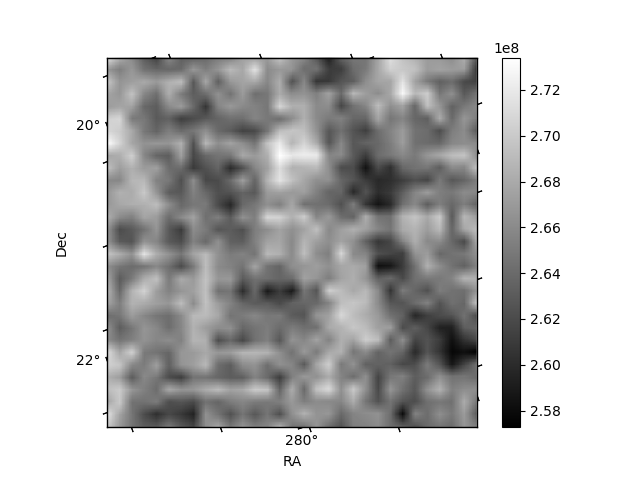
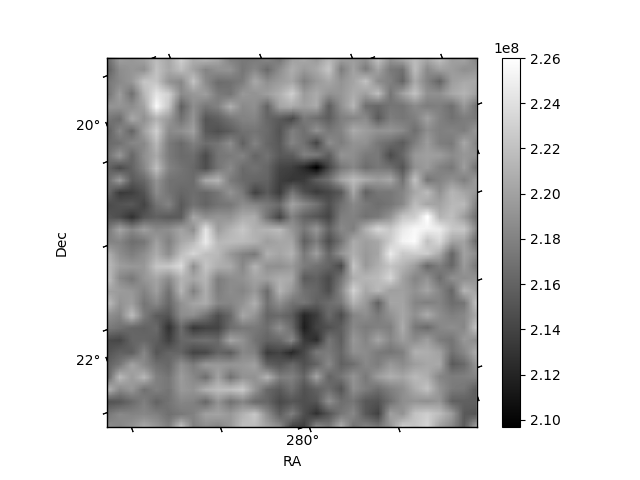
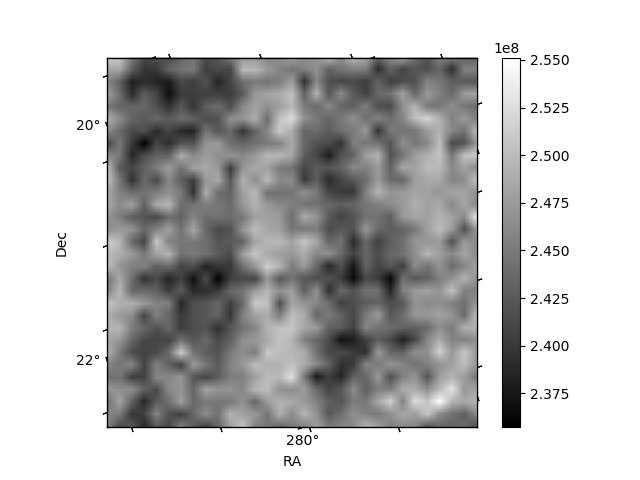
Histogram calculated using DETX and DETY for each event in the final _common_clean file
| Quadrant A | 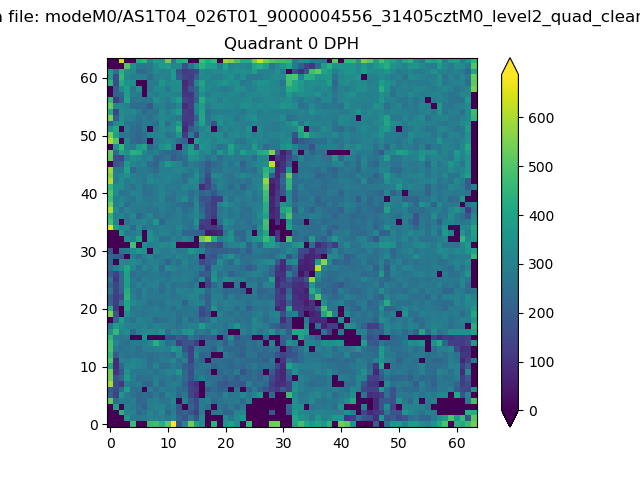 |
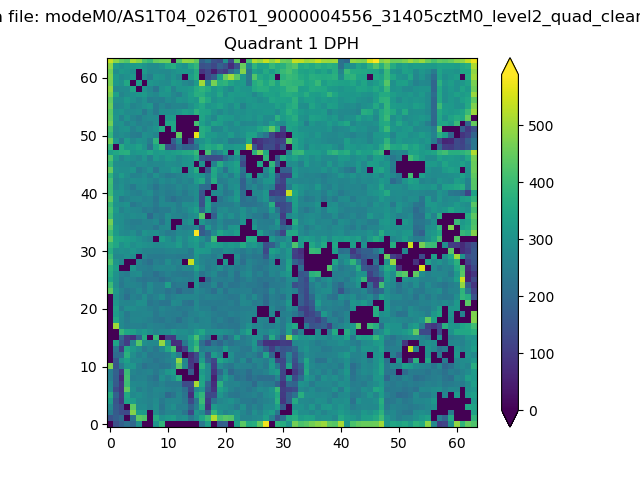 |
Quadrant B |
|---|---|---|---|
| Quadrant D | 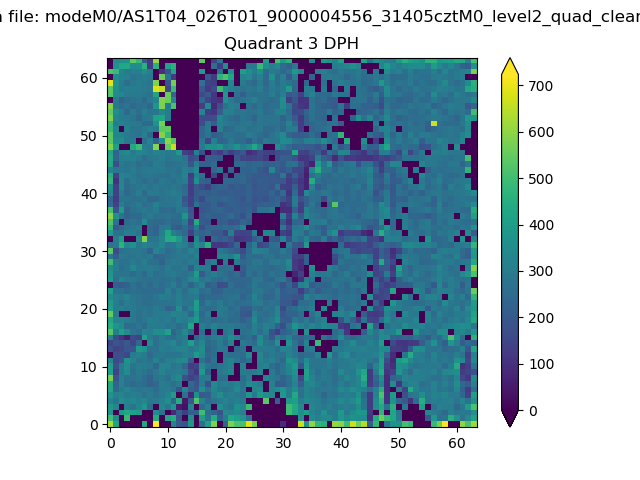 |
 |
Quadrant C |
| Plot type | Count rate plots | Images |
|---|---|---|
| Comparison with Poisson distribution Blue bars denote a histogram of data divided into 1 sec bins. Red curve is a Poisson curve with rate = median count rate of data. |
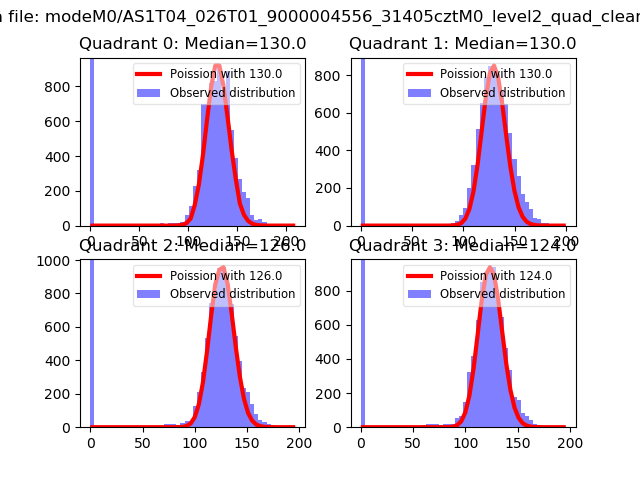 |
 |
| Quadrant-wise count rates Data is divided into 100 sec bins |
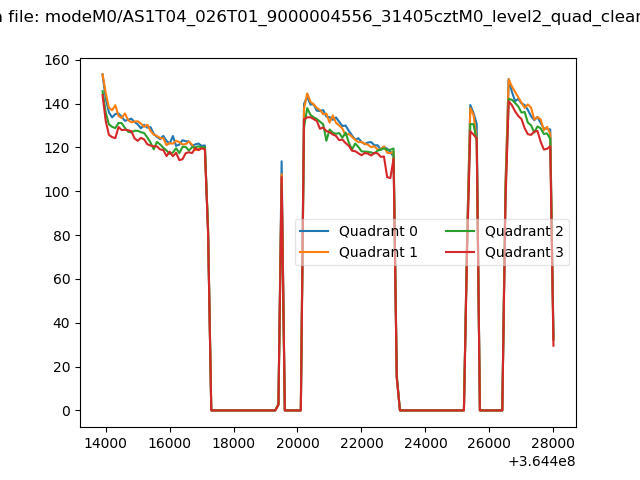 |
|
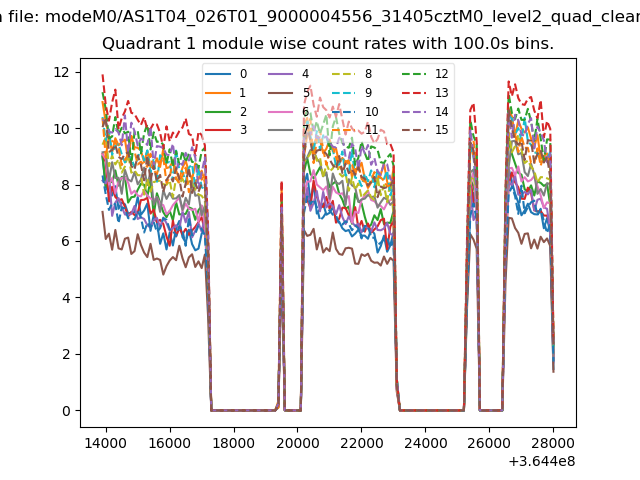
| Module-wise count rates for Quadrant A Data is divided into 100 sec bins |
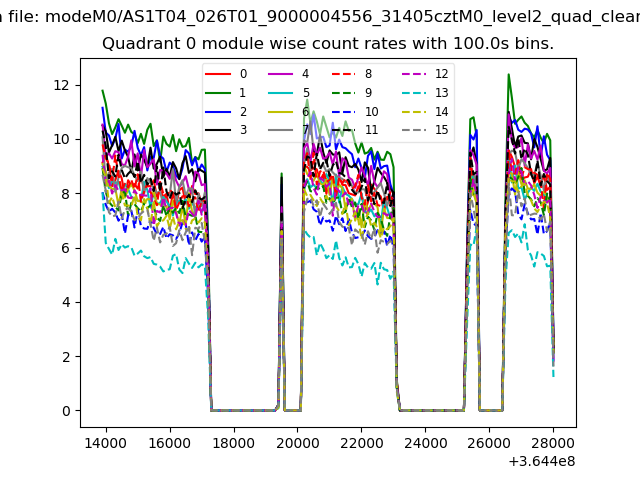 |
 |
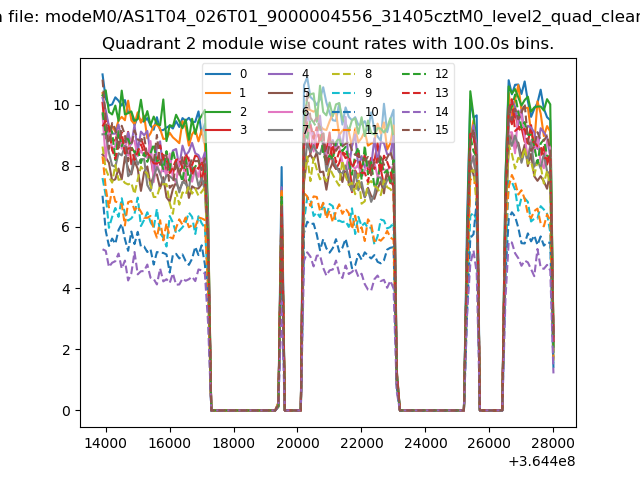
| Module-wise count rates for Quadrant B Data is divided into 100 sec bins |
 |
 |
| Module-wise count rates for Quadrant C Data is divided into 100 sec bins |
 |
 |
| Module-wise count rates for Quadrant D Data is divided into 100 sec bins |
 |
 |
| Parameter | Plot |
|---|---|
| CZT HV Monitor | 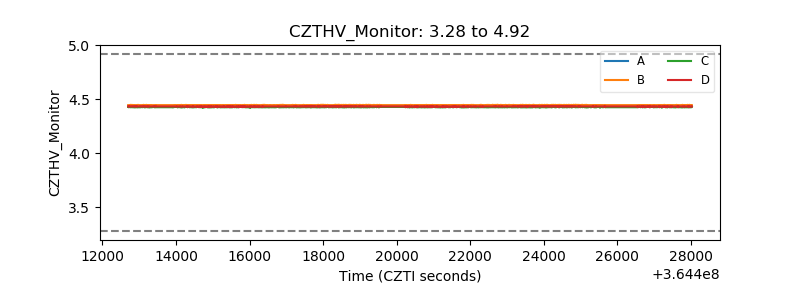 |
| D_VDD | 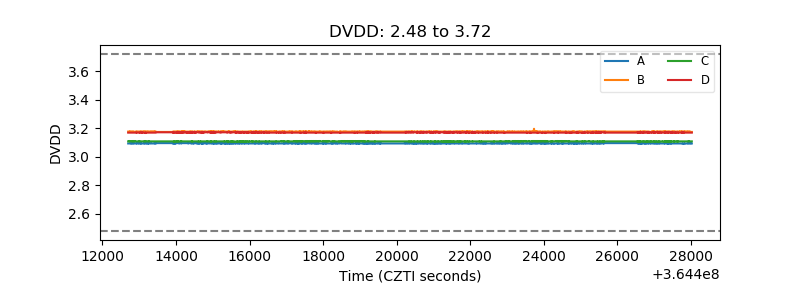 |
| Temperature 1 |  |
| Veto HV Monitor | 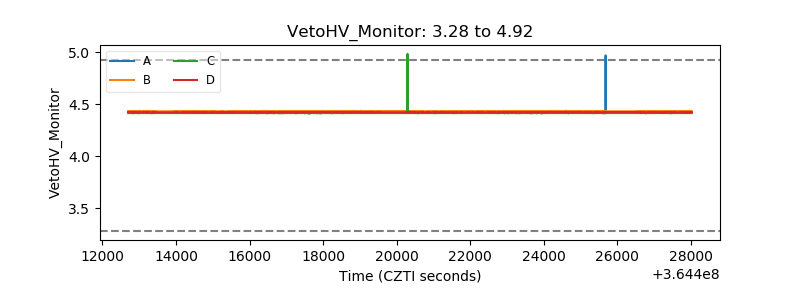 |
| Veto LLD | 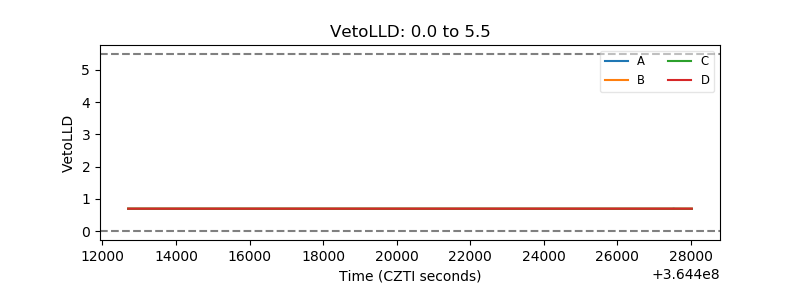 |
| Alpha Counter | 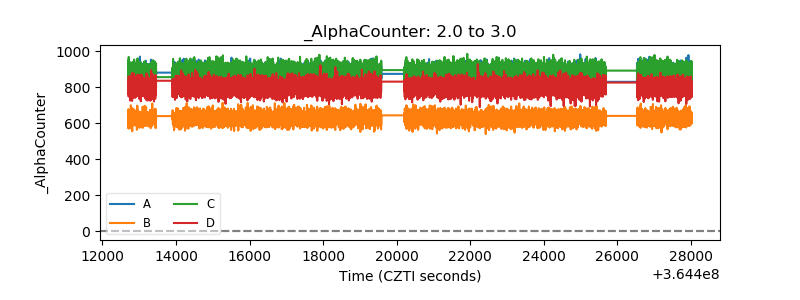 |
| _CPM_Rate | 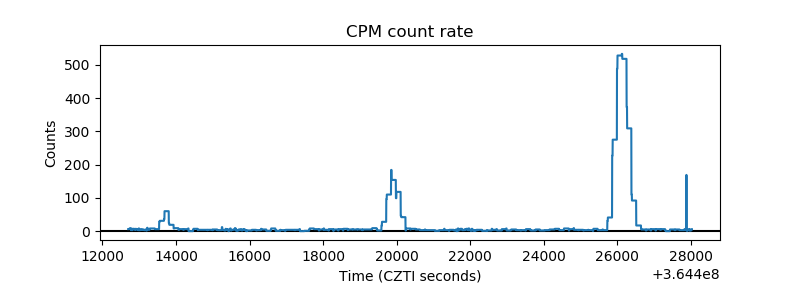 |
| CZT Counter | 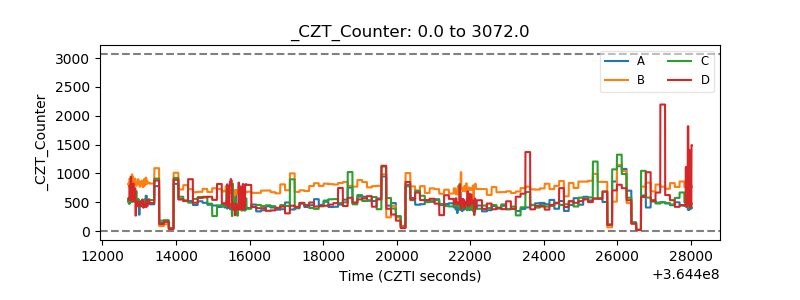 |
| +2.5 Volts monitor | 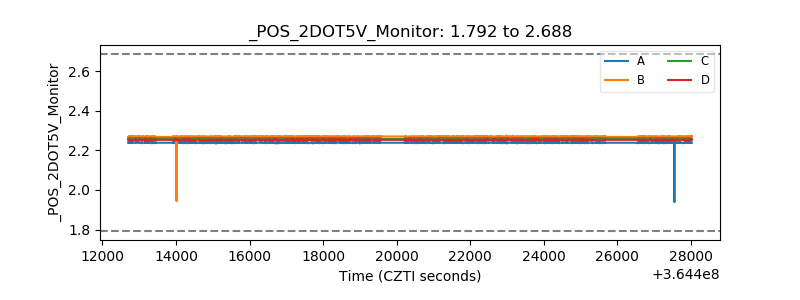 |
| +5 Volts monitor |  |
| _ROLL_ROT | 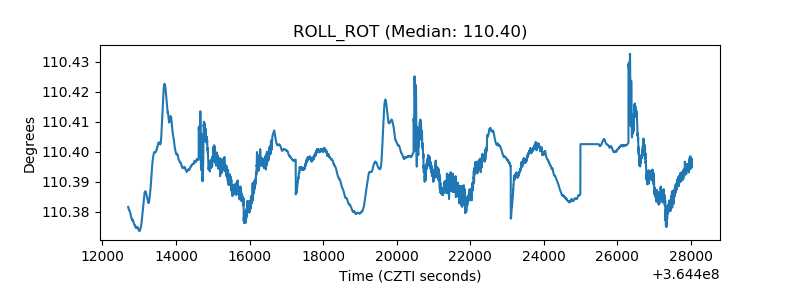 |
| _Roll_DEC |  |
| _Roll_RA | 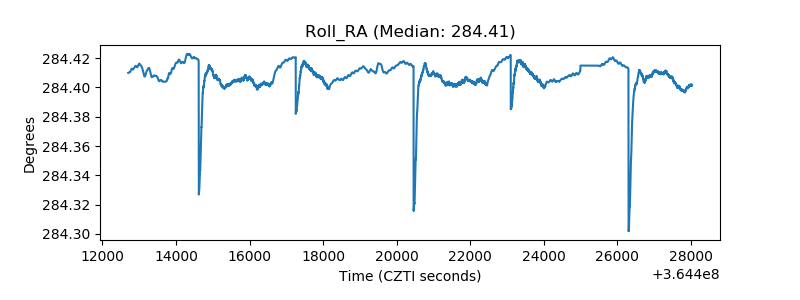 |
| Veto Counter |  |