| Param | Original file | Final file |
|---|---|---|
| Filename | modeM0/AS1T04_026T01_9000004556_31406cztM0_level2.evt | modeM0/AS1T04_026T01_9000004556_31406cztM0_level2_quad_clean.evt |
| Size (bytes) | 532,290,240 | 94,498,560 |
| Size | 507.6 MB | 90.1 MB |
| Events in quadrant A | 3,142,081 | 612,180 |
| Events in quadrant B | 5,212,223 | 615,590 |
| Events in quadrant C | 3,365,897 | 592,079 |
| Events in quadrant D | 3,946,832 | 575,512 |
| Mode M9 | |||
|---|---|---|---|
| Quadrant | BADHDUFLAG | Total packets | Discarded packets |
| A | 0 | 13 | 0 |
| B | 0 | 14 | 0 |
| C | 0 | 14 | 0 |
| D | 0 | 14 | 0 |
| Mode M0 | |||
|---|---|---|---|
| Quadrant | BADHDUFLAG | Total packets | Discarded packets |
| A | 0 | 13685 | 2 |
| B | 0 | 20397 | 2 |
| C | 0 | 14283 | 2 |
| D | 0 | 16357 | 4 |
| Mode SS | |||
|---|---|---|---|
| Quadrant | BADHDUFLAG | Total packets | Discarded packets |
| A | 0 | 136 | 0 |
| B | 0 | 136 | 0 |
| C | 0 | 136 | 0 |
| D | 0 | 136 | 0 |
| Quadrant | Total seconds | Saturated seconds | Saturation percentage |
|---|---|---|---|
| A | 6690 | 12 | 0.179372% |
| B | 6690 | 68 | 1.016442% |
| C | 6690 | 79 | 1.180867% |
| D | 6689 | 59 | 0.882045% |
Noise dominated data is calculated using 1-second bins in cleaned event files. If a bin has >2000 counts, and if more than 50% of those come from <1% of pixels, then it is considered to be noise-dominated and hence unusable.
| Quadrant | # 1 sec bins | Bins with >0 counts | Bins with >2000 counts | High rate bins dominated by noise | Noise dominated (total time) | Noise dominated (detector-on time) | Marked lightcurve |
|---|---|---|---|---|---|---|---|
| A | 7725 | 6691 | 0 | 0 | 0.00% | 0.00% | 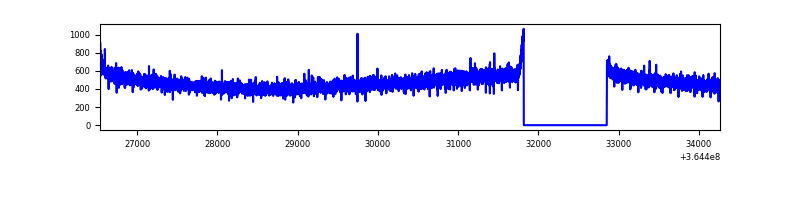 |
| B | 7725 | 6691 | 5 | 5 | 0.06% | 0.07% | 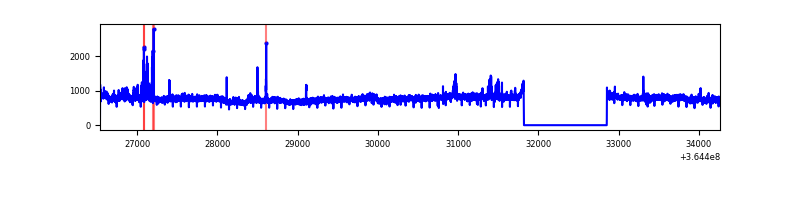 |
| C | 7725 | 6691 | 4 | 4 | 0.05% | 0.06% | 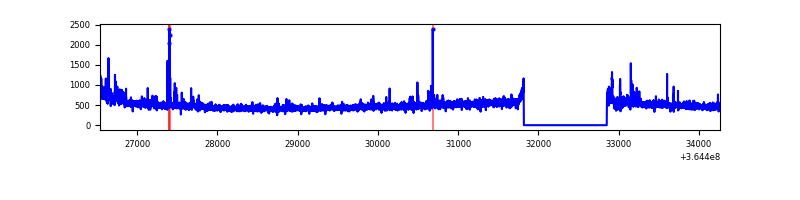 |
| D | 7724 | 6690 | 44 | 44 | 0.57% | 0.66% | 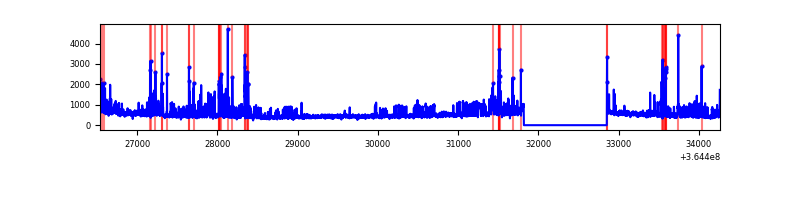 |
Top three noisy pixels from each quadrant. If the there are fewer than three noisy pixels in the level2.evt file, extra rows are filled as -1
| Pixel properties | Quadrant properties | ||||||
|---|---|---|---|---|---|---|---|
| Quadrant | DetID | PixID | Counts | Sigma | Mean | Median | Sigma |
| A | 13 | 254 | 10329 | 58.5 | 813 | 796 | 163.0 |
| A | 3 | 137 | 8526 | 47.44 | 813 | 796 | 163.0 |
| A | 0 | 226 | 6615 | 35.71 | 813 | 796 | 163.0 |
| B | 6 | 159 | 1859237 | 11953.6 | 808 | 787 | 155.5 |
| B | 0 | 190 | 67044 | 426.17 | 808 | 787 | 155.5 |
| B | 4 | 80 | 51637 | 327.07 | 808 | 787 | 155.5 |
| C | 14 | 238 | 136359 | 728.88 | 787 | 791 | 186.0 |
| C | 10 | 22 | 97696 | 521.01 | 787 | 791 | 186.0 |
| C | 3 | 233 | 27510 | 143.65 | 787 | 791 | 186.0 |
| D | 8 | 195 | 507008 | 2702.95 | 787 | 766 | 187.3 |
| D | 12 | 218 | 239068 | 1272.35 | 787 | 766 | 187.3 |
| D | 2 | 250 | 117170 | 621.51 | 787 | 766 | 187.3 |
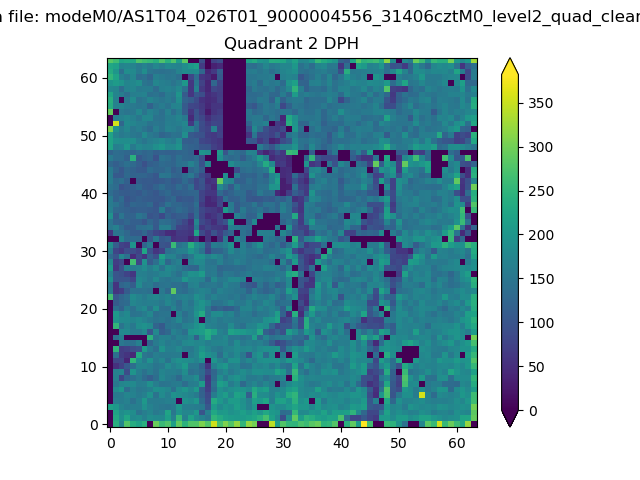
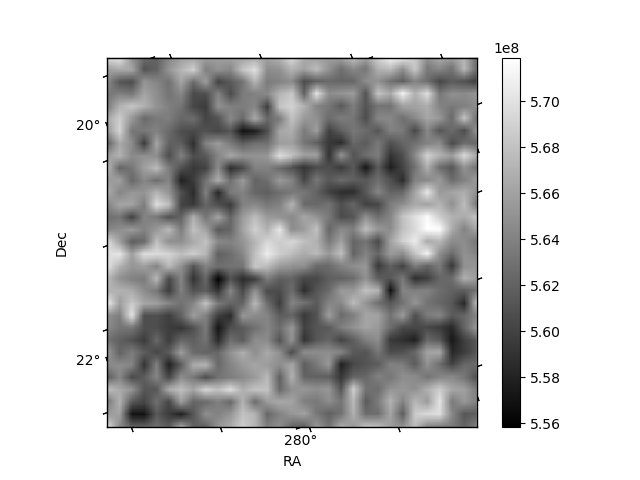
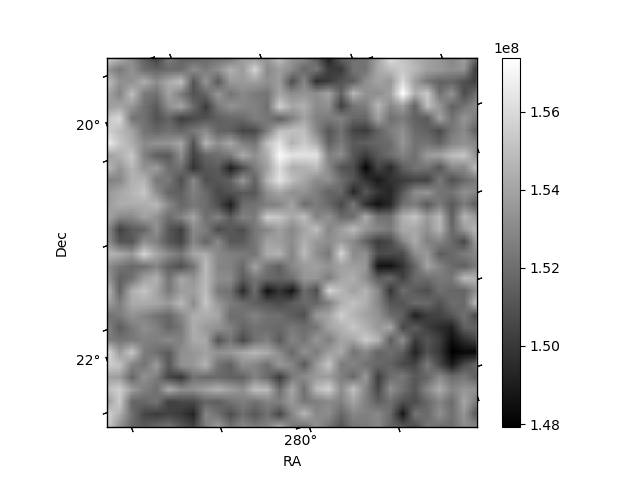
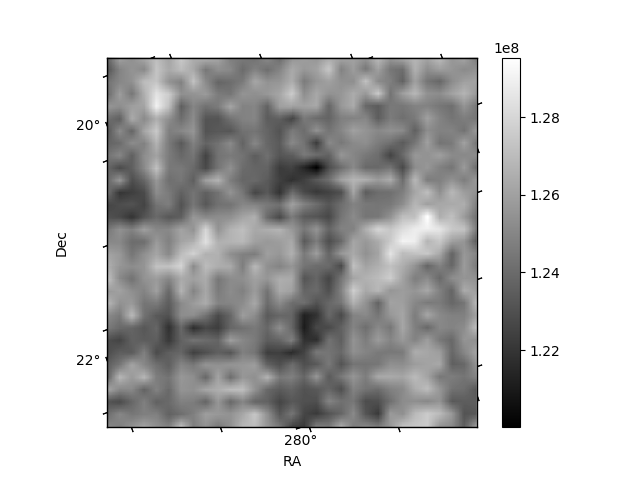
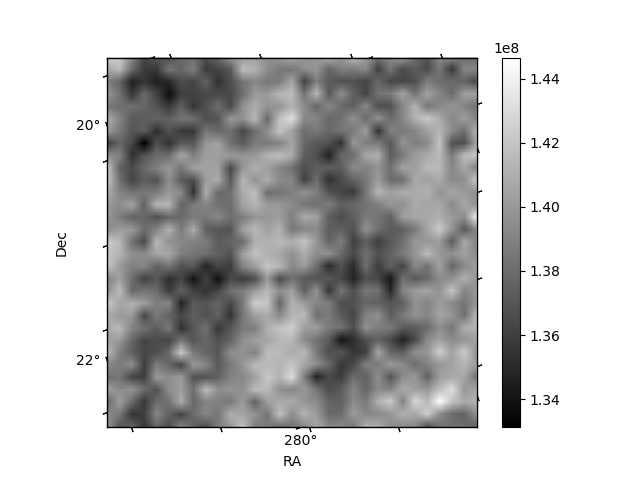
Histogram calculated using DETX and DETY for each event in the final _common_clean file
| Quadrant A | 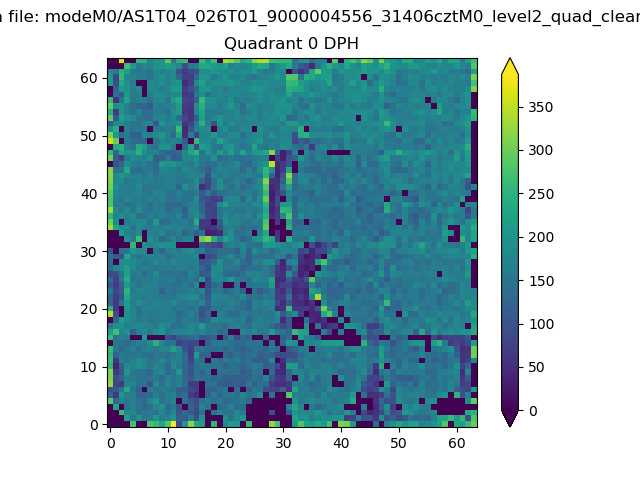 |
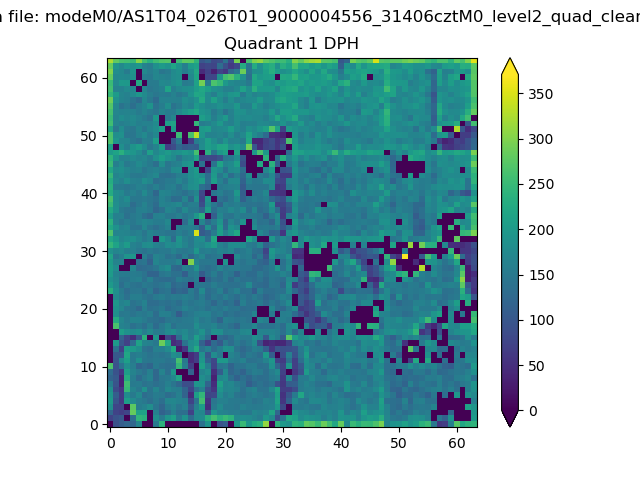 |
Quadrant B |
|---|---|---|---|
| Quadrant D | 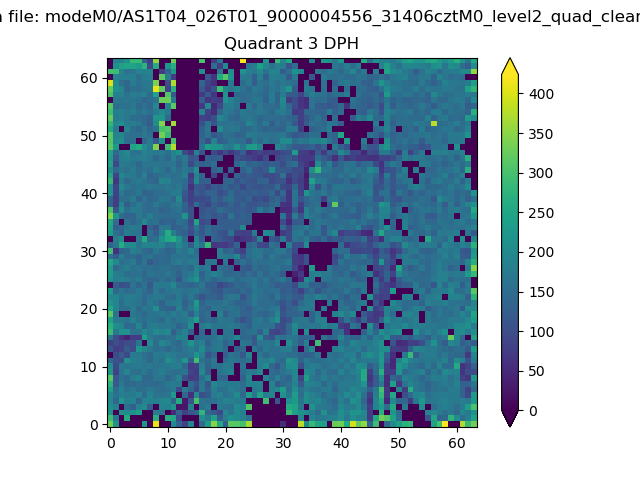 |
 |
Quadrant C |
| Plot type | Count rate plots | Images |
|---|---|---|
| Comparison with Poisson distribution Blue bars denote a histogram of data divided into 1 sec bins. Red curve is a Poisson curve with rate = median count rate of data. |
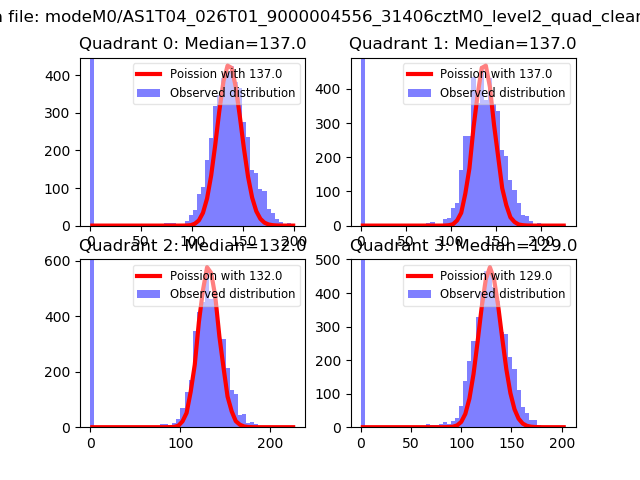 |
 |
| Quadrant-wise count rates Data is divided into 100 sec bins |
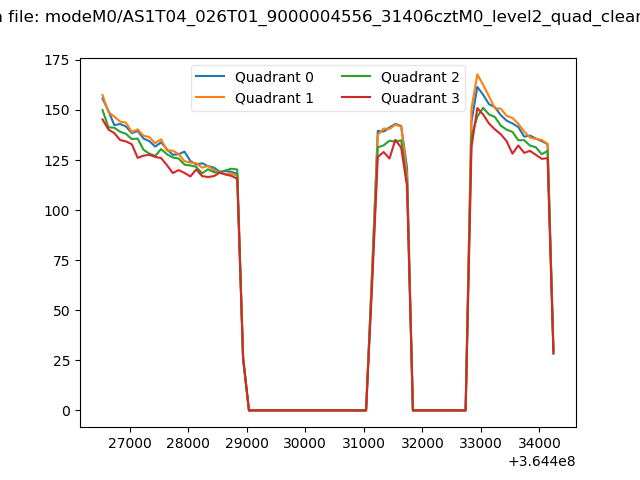 |
|
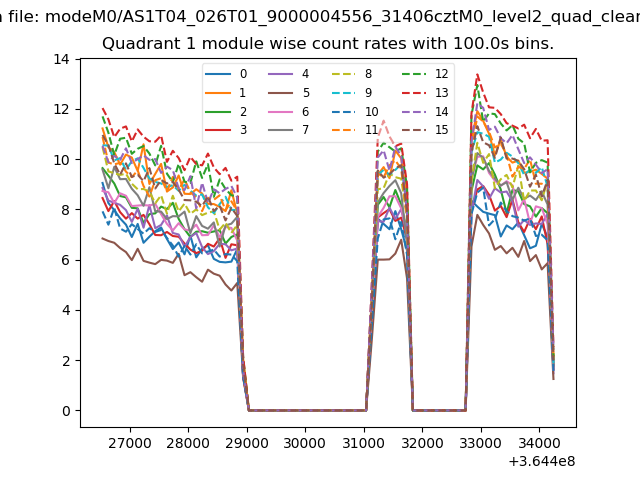
| Module-wise count rates for Quadrant A Data is divided into 100 sec bins |
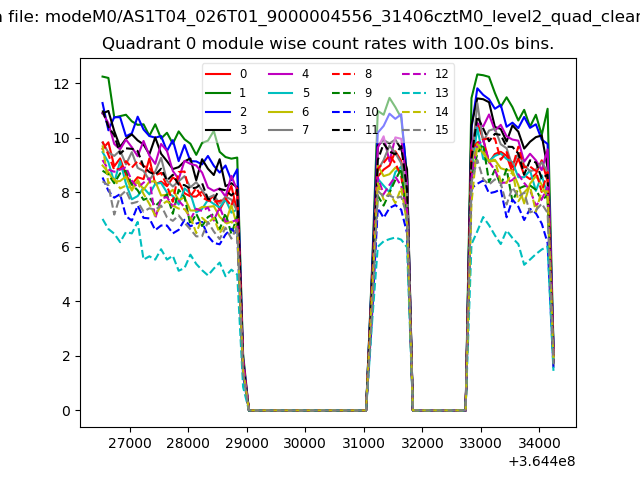 |
 |
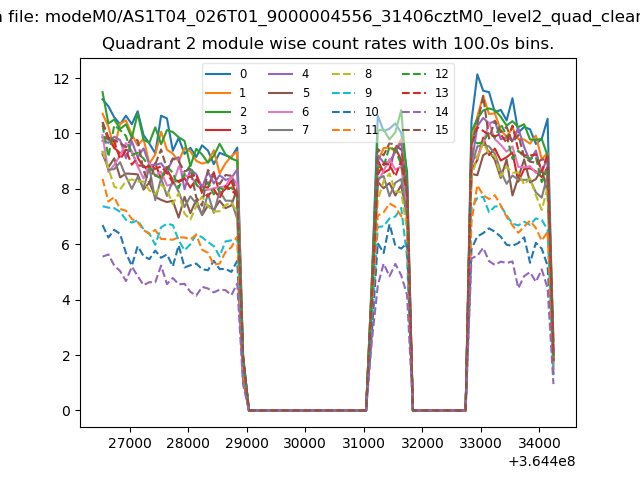
| Module-wise count rates for Quadrant B Data is divided into 100 sec bins |
 |
 |
| Module-wise count rates for Quadrant C Data is divided into 100 sec bins |
 |
 |
| Module-wise count rates for Quadrant D Data is divided into 100 sec bins |
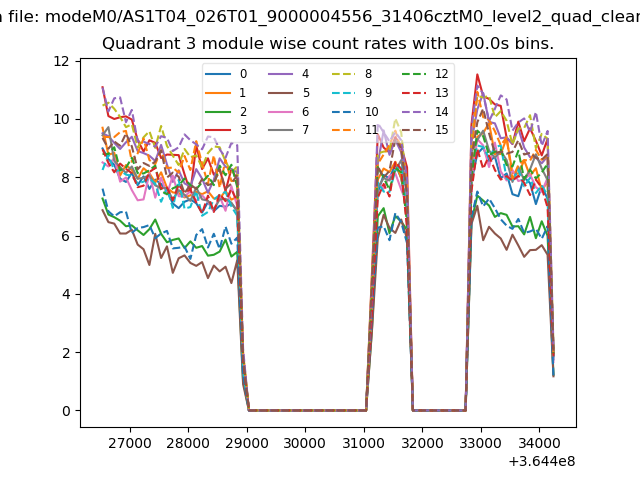 |
 |
| Parameter | Plot |
|---|---|
| CZT HV Monitor | 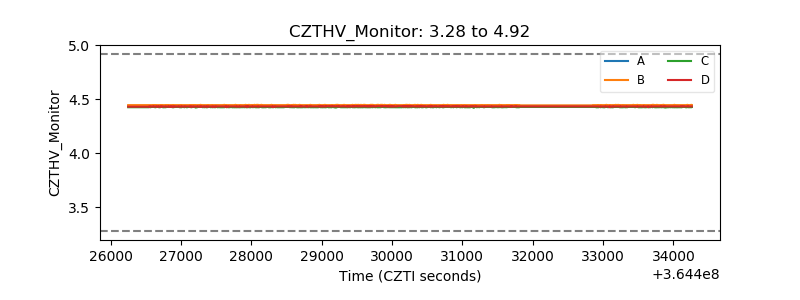 |
| D_VDD | 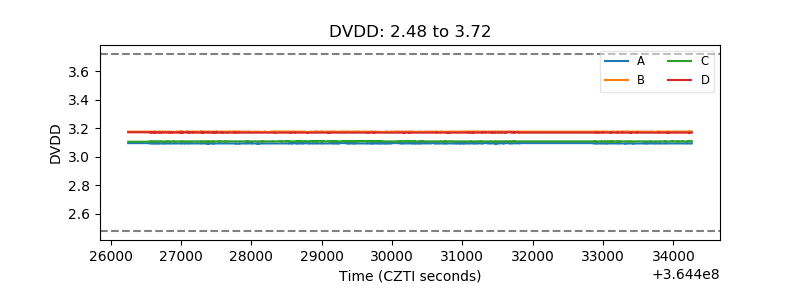 |
| Temperature 1 |  |
| Veto HV Monitor |  |
| Veto LLD | 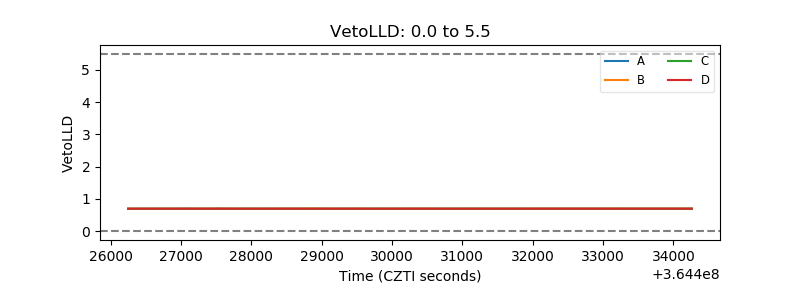 |
| Alpha Counter | 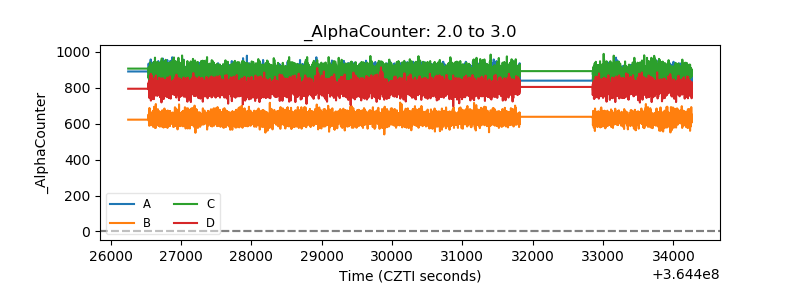 |
| _CPM_Rate | 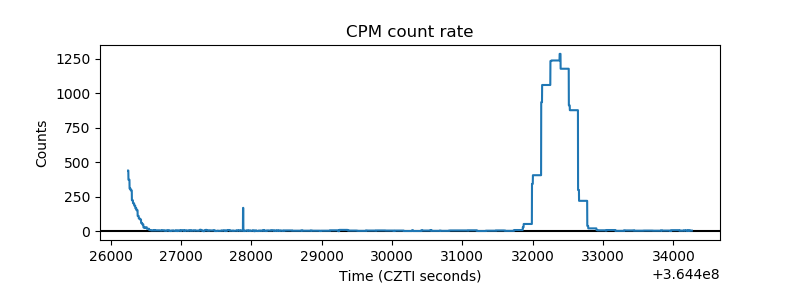 |
| CZT Counter | 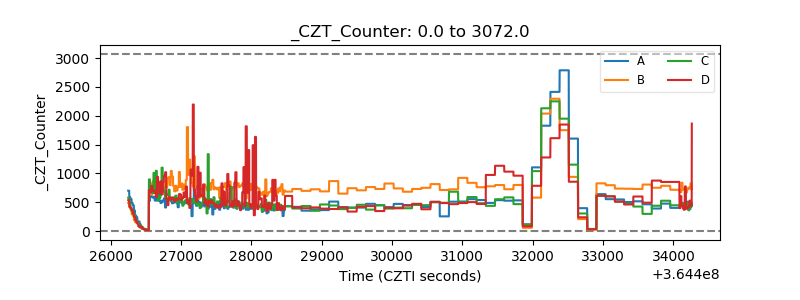 |
| +2.5 Volts monitor |  |
| +5 Volts monitor |  |
| _ROLL_ROT | 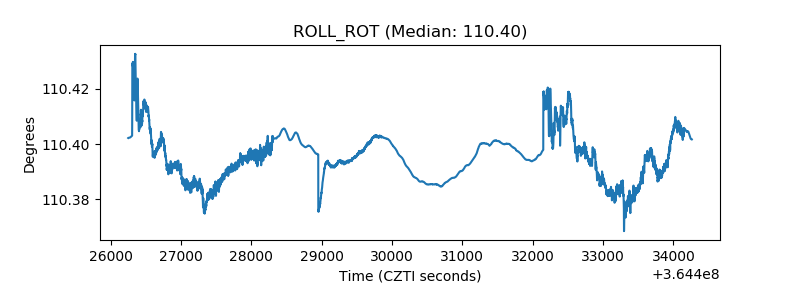 |
| _Roll_DEC |  |
| _Roll_RA | 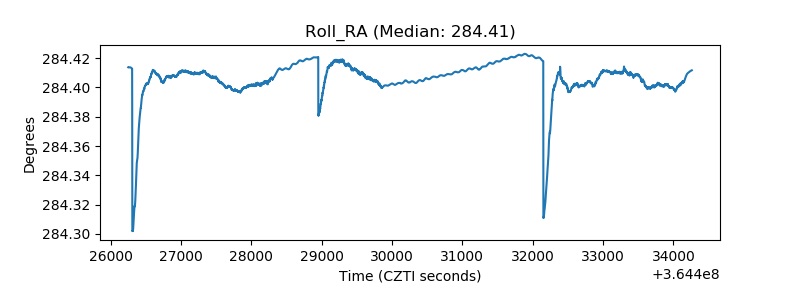 |
| Veto Counter | 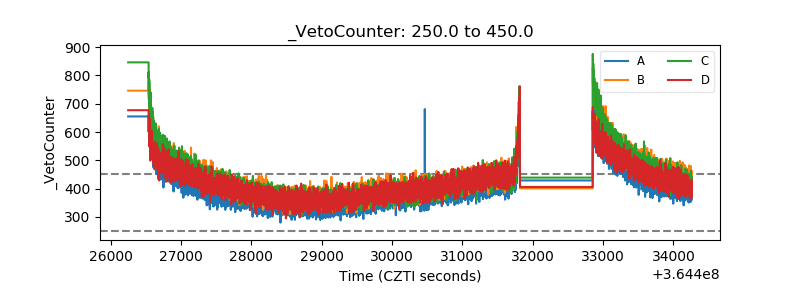 |