| Param | Original file | Final file |
|---|---|---|
| Filename | modeM0/AS1T04_026T01_9000004556_31416cztM0_level2.evt | modeM0/AS1T04_026T01_9000004556_31416cztM0_level2_quad_clean.evt |
| Size (bytes) | 321,762,240 | 57,502,080 |
| Size | 306.9 MB | 54.8 MB |
| Events in quadrant A | 1,792,011 | 377,145 |
| Events in quadrant B | 2,878,061 | 377,144 |
| Events in quadrant C | 2,421,952 | 355,017 |
| Events in quadrant D | 2,387,558 | 357,042 |
| Mode M0 | |||
|---|---|---|---|
| Quadrant | BADHDUFLAG | Total packets | Discarded packets |
| A | 0 | 7862 | 0 |
| B | 0 | 11689 | 0 |
| C | 0 | 9644 | 0 |
| D | 0 | 9543 | 0 |
| Mode SS | |||
|---|---|---|---|
| Quadrant | BADHDUFLAG | Total packets | Discarded packets |
| A | 0 | 78 | 0 |
| B | 0 | 78 | 0 |
| C | 0 | 78 | 0 |
| D | 0 | 78 | 0 |
| Quadrant | Total seconds | Saturated seconds | Saturation percentage |
|---|---|---|---|
| A | 3889 | 2 | 0.051427% |
| B | 3889 | 19 | 0.488557% |
| C | 3889 | 143 | 3.677038% |
| D | 3890 | 29 | 0.745501% |
Noise dominated data is calculated using 1-second bins in cleaned event files. If a bin has >2000 counts, and if more than 50% of those come from <1% of pixels, then it is considered to be noise-dominated and hence unusable.
| Quadrant | # 1 sec bins | Bins with >0 counts | Bins with >2000 counts | High rate bins dominated by noise | Noise dominated (total time) | Noise dominated (detector-on time) | Marked lightcurve |
|---|---|---|---|---|---|---|---|
| A | 3889 | 3889 | 0 | 0 | 0.00% | 0.00% | 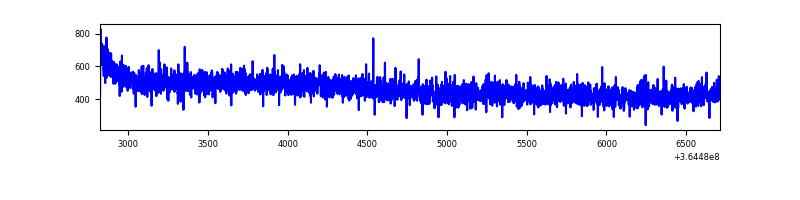 |
| B | 3889 | 3889 | 0 | 0 | 0.00% | 0.00% | 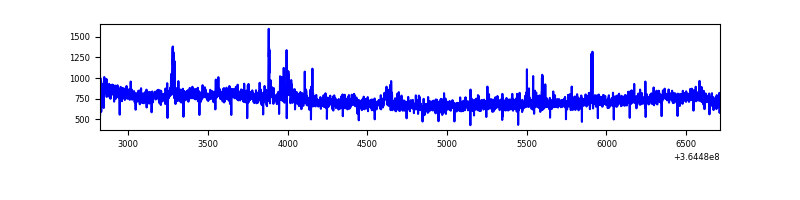 |
| C | 3889 | 3889 | 92 | 92 | 2.37% | 2.37% | 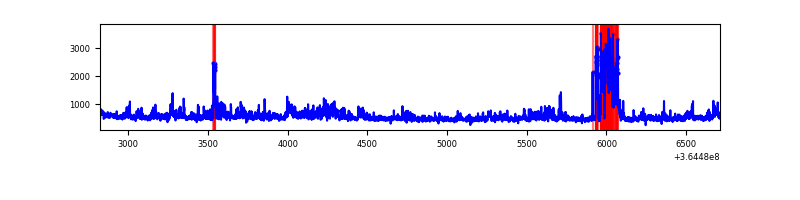 |
| D | 3890 | 3890 | 16 | 16 | 0.41% | 0.41% | 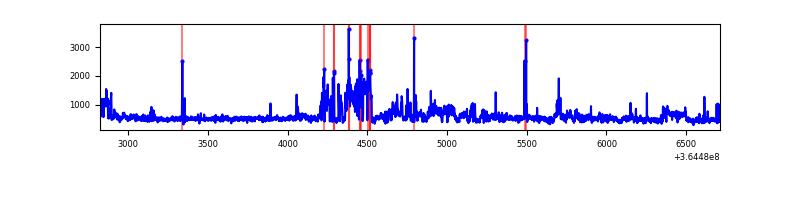 |
Top three noisy pixels from each quadrant. If the there are fewer than three noisy pixels in the level2.evt file, extra rows are filled as -1
| Pixel properties | Quadrant properties | ||||||
|---|---|---|---|---|---|---|---|
| Quadrant | DetID | PixID | Counts | Sigma | Mean | Median | Sigma |
| A | 13 | 254 | 6160 | 60.92 | 464 | 455 | 93.6 |
| A | 3 | 137 | 4957 | 48.08 | 464 | 455 | 93.6 |
| A | 0 | 226 | 3822 | 35.96 | 464 | 455 | 93.6 |
| B | 6 | 159 | 1023368 | 11533.54 | 455 | 443 | 88.7 |
| B | 0 | 190 | 39781 | 443.54 | 455 | 443 | 88.7 |
| B | 12 | 111 | 10969 | 118.68 | 455 | 443 | 88.7 |
| C | 3 | 233 | 315991 | 2983.97 | 442 | 445 | 105.7 |
| C | 10 | 22 | 297844 | 2812.36 | 442 | 445 | 105.7 |
| C | 14 | 238 | 73461 | 690.48 | 442 | 445 | 105.7 |
| D | 8 | 195 | 586798 | 5342.93 | 453 | 441 | 109.7 |
| D | 2 | 250 | 48951 | 442.03 | 453 | 441 | 109.7 |
| D | 12 | 218 | 37911 | 341.43 | 453 | 441 | 109.7 |
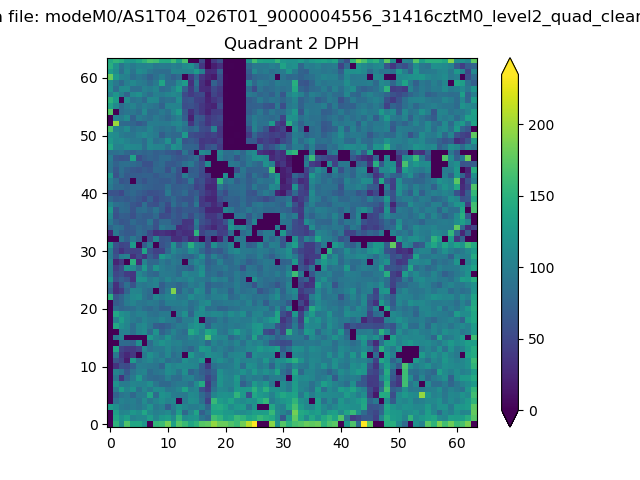
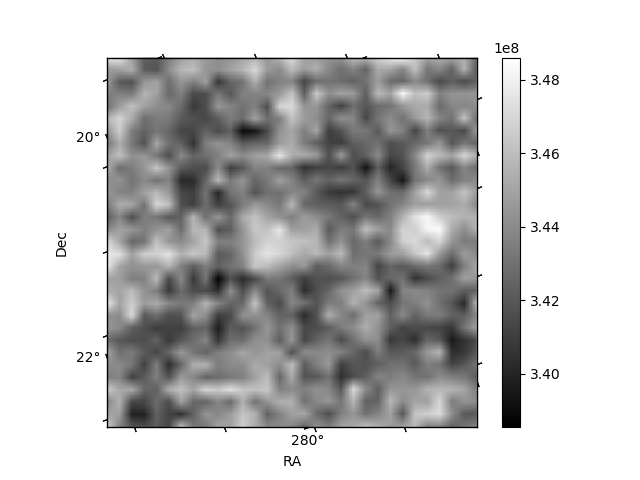
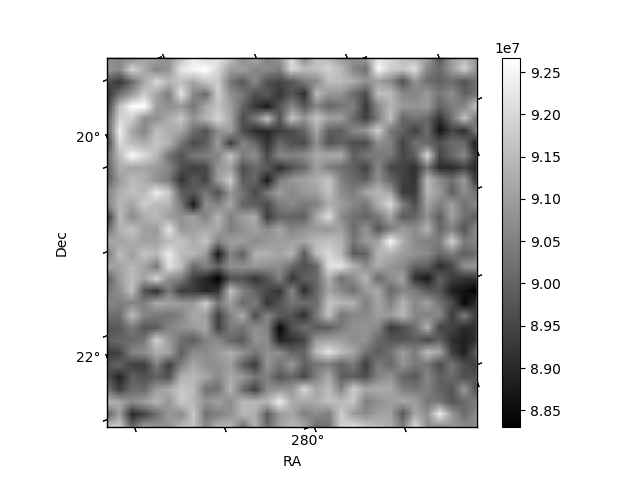
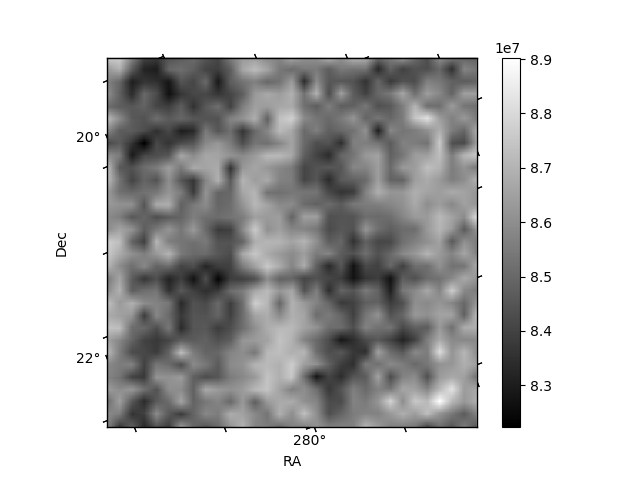
Histogram calculated using DETX and DETY for each event in the final _common_clean file
| Quadrant A | 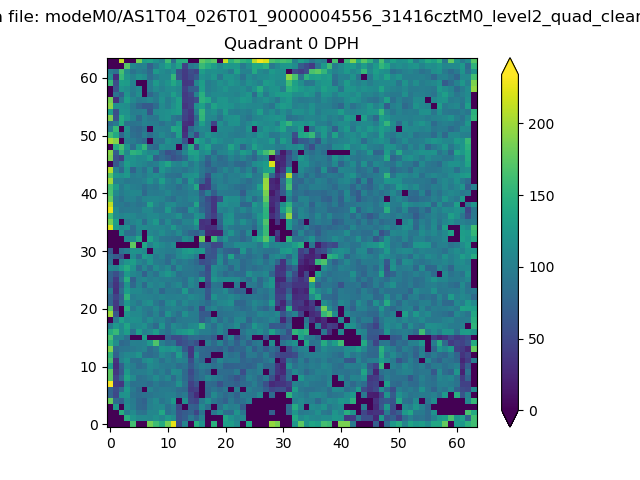 |
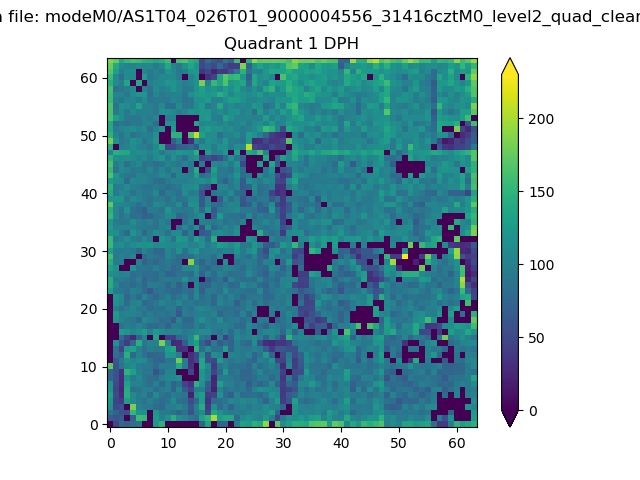 |
Quadrant B |
|---|---|---|---|
| Quadrant D | 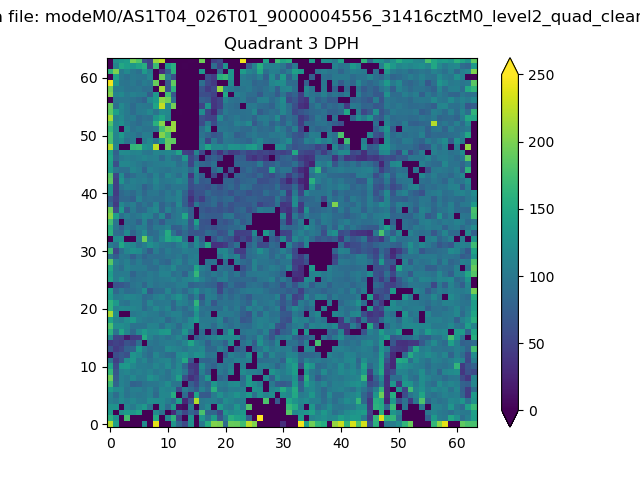 |
 |
Quadrant C |
| Plot type | Count rate plots | Images |
|---|---|---|
| Comparison with Poisson distribution Blue bars denote a histogram of data divided into 1 sec bins. Red curve is a Poisson curve with rate = median count rate of data. |
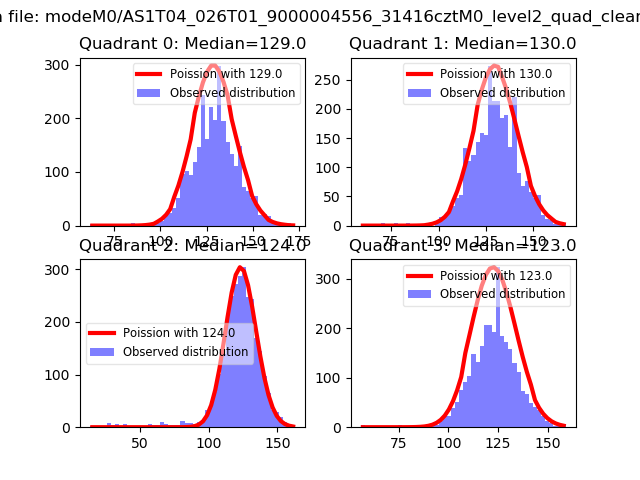 |
 |
| Quadrant-wise count rates Data is divided into 100 sec bins |
 |
|
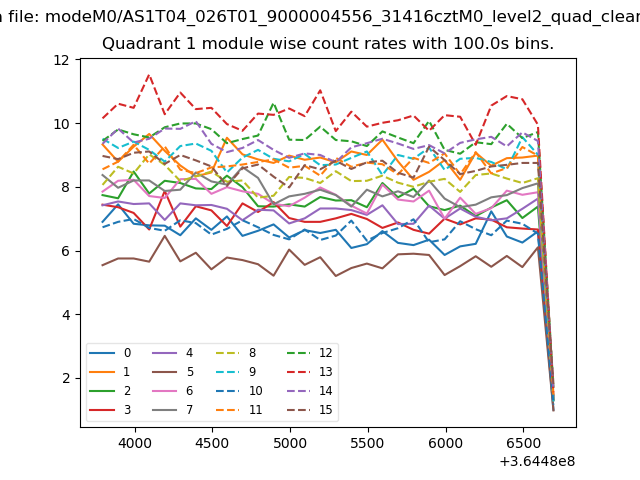
| Module-wise count rates for Quadrant A Data is divided into 100 sec bins |
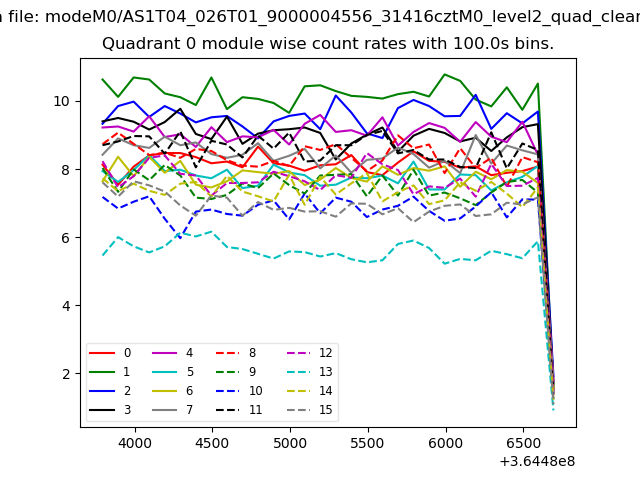 |
 |
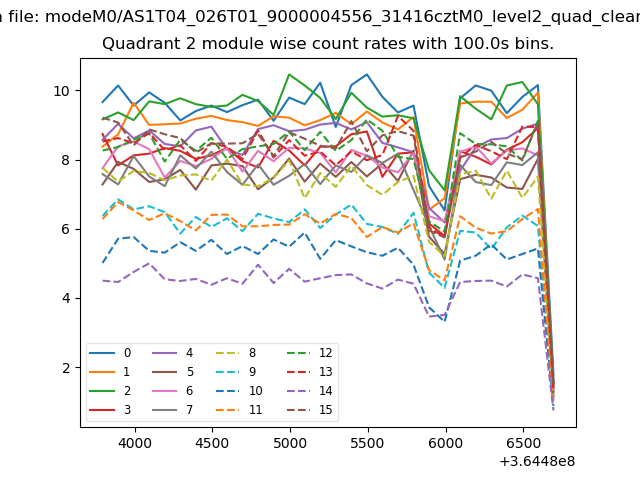
| Module-wise count rates for Quadrant B Data is divided into 100 sec bins |
 |
 |
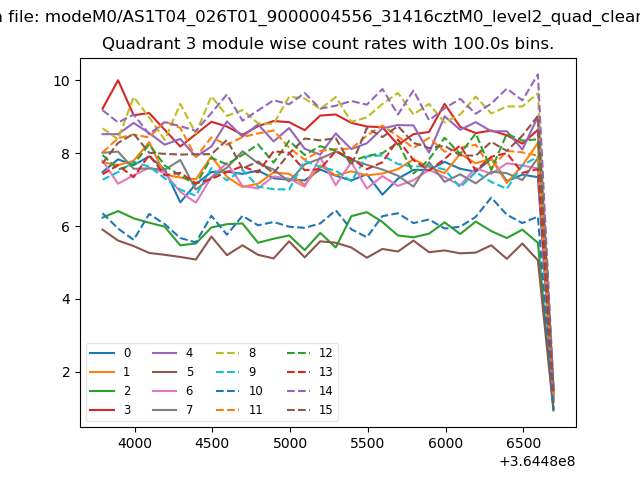
| Module-wise count rates for Quadrant C Data is divided into 100 sec bins |
 |
 |
| Module-wise count rates for Quadrant D Data is divided into 100 sec bins |
 |
 |
| Parameter | Plot |
|---|---|
| CZT HV Monitor | 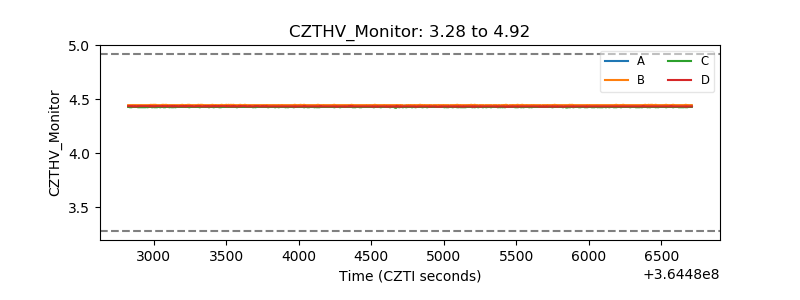 |
| D_VDD | 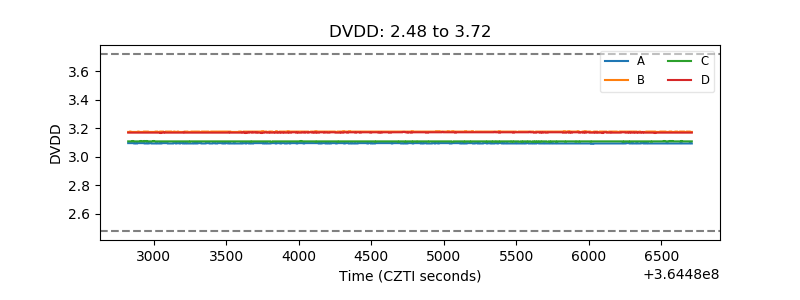 |
| Temperature 1 | 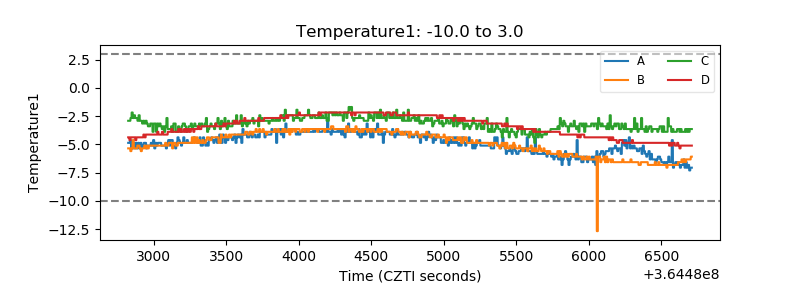 |
| Veto HV Monitor | 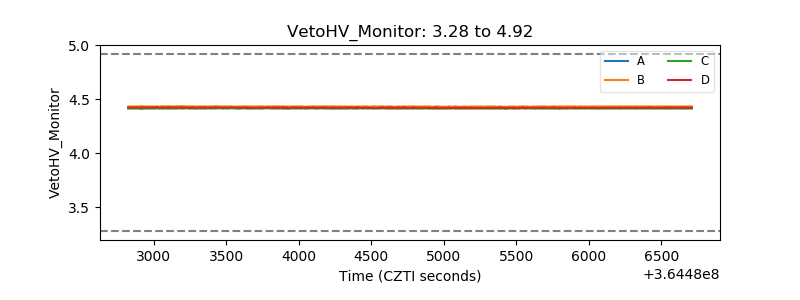 |
| Veto LLD | 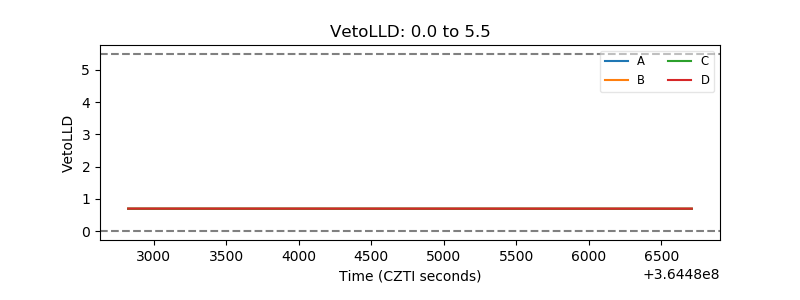 |
| Alpha Counter | 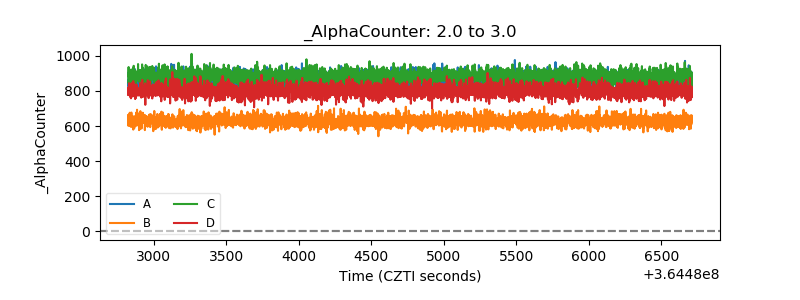 |
| _CPM_Rate | 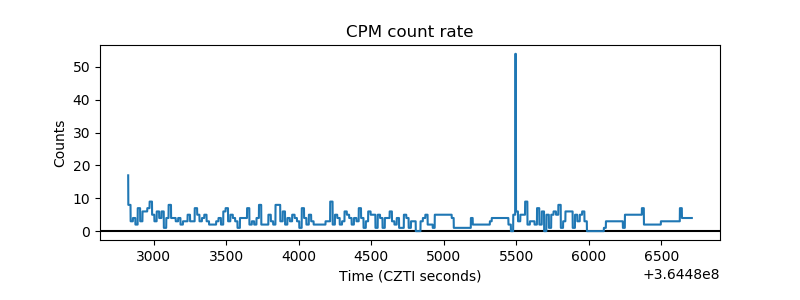 |
| CZT Counter | 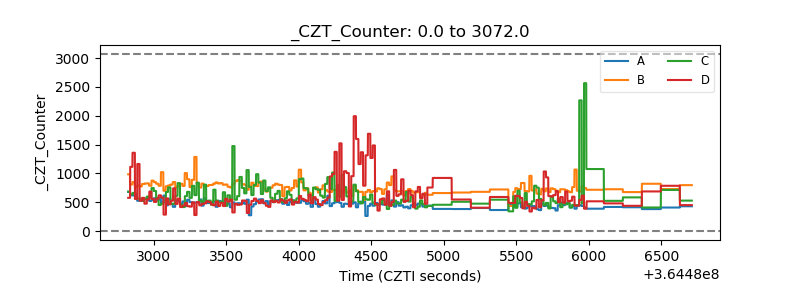 |
| +2.5 Volts monitor |  |
| +5 Volts monitor | 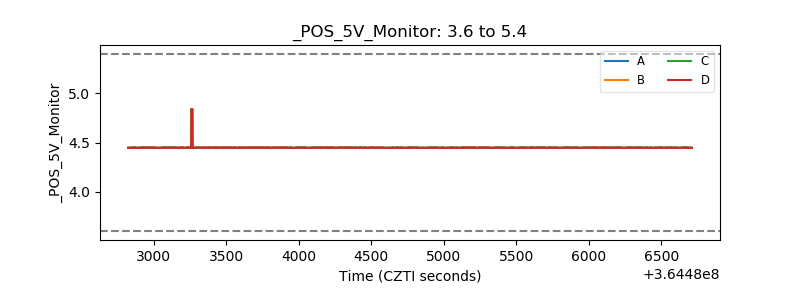 |
| _ROLL_ROT | 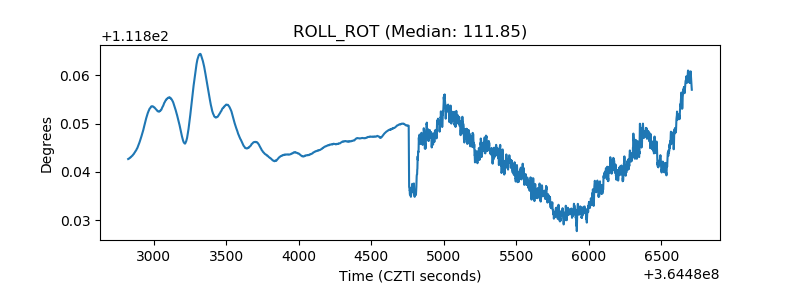 |
| _Roll_DEC | 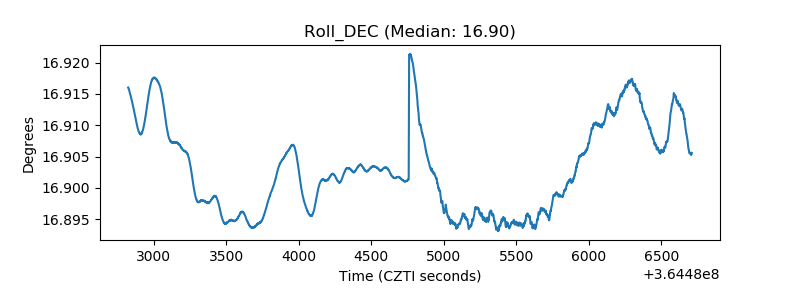 |
| _Roll_RA | 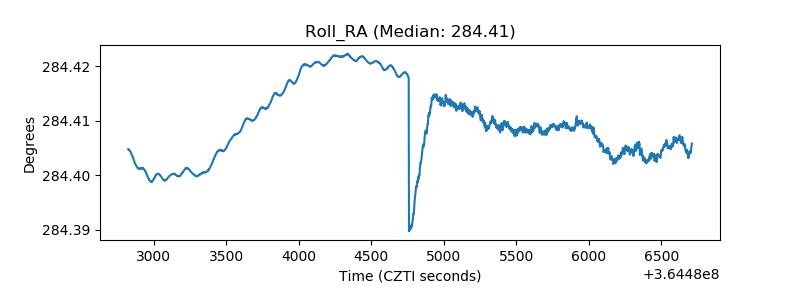 |
| Veto Counter | 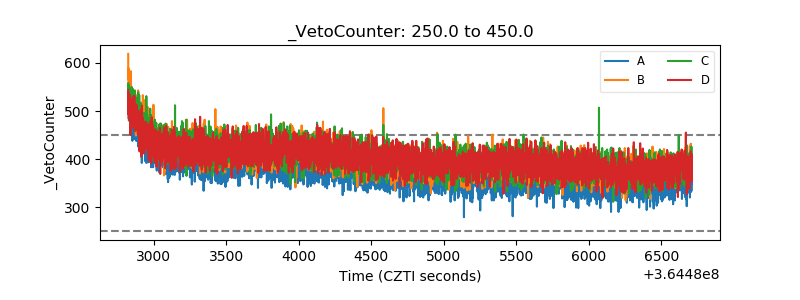 |